1
Chapter 1: Getting Ready
Chapter 1:
Getting Ready
This chapter acquaints you with CASIO Data Analyzer key operations, display indicators, and other basic information you need to know. It also tells you
how to replace batteries, connect to a graphic scientific unit, and perform
other set up procedures before beginning actual operation.
Unpacking ............................................................................ 2
CASIO Data Analyzer Overview .......................................... 3
Keyboard .............................................................................. 5
Reading the Display ............................................................. 8
Power Supply ..................................................................... 10
Connecting the Data Analyzer to a Calculator ................... 13
Connecting a Probe ........................................................... 13
1
Chapter 1: Getting Ready
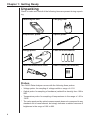
Unpacking
Check to make sure that all of the following items are present during unpacking.
Data analyzer unit
Carrying case
Temperature probe
Optical probe
Voltage probe
Four AA-size batteries
Data communication cable
User’s Guide (this manual)
EA-100
Probes
The CASIO Data Analyzer comes with the following three probes.
• Voltage probe: for sampling of voltages within a range of ±10V
• Optical probe: for sampling of irradiance (radiant flux density) from 100 to
999*
• Temperature probe: for sampling of temperatures in the range of –20 to
130°C
* The value produced by optical measurements does not correspond to any
standard unit of measurement, but simply indicates a relative measure of
brightness in the range of 100 to 999.
2
Chapter 1: Getting Ready
CASIO Data Analyzer Overview
The CASIO Data Analyzer is a digital instrument you can use to sample and
collect data on various everyday natural phenomena. The following sections
provide information on using its probes and channels, and tell you how to
connect to a graphic scientific calculator. A number of other important functions of the data analyzer unit are also introduced here.
Sample Data
The probes that come with the CASIO Data Analyzer make it possible to
sample temperature, light, and voltage. Data sampling can be performed at
up to 512 points per channel, and data can be sampled on up to five channels simultaneously. Data can be transferred to a CASIO CFX-9850G or CFX9800G graphic scientific calculator as it is sampled.
Probes
Probes are actually sensors for picking up data on temperature, light, and
other natural phenomena.
When using the supplied probes, the data analyzer unit’s Auto-ID feature
automatically detects which of the probes is connected.
Channels
Probes are connected to input/output terminals, called “channels,” that are
equipped on the data analyzer unit. There are a total of six channels for
connection of probes: three analog channels (CH1, CH2, CH3), one ultrasonic channel (SONIC), one digital input channel (DIG IN), and one digital
output channel (DIG OUT).
Data Analyzer and the CFX-9850G/CFX-9800G
Though the data analyzer unit can be used alone to sample, store, and recall
data, you can also connect to a graphic scientific calculator for more detailed
manipulation and analysis of sampled data. The data analyzer unit can be
controlled from the calculator, and sampled data can be displayed in graphic
form on the calculator’s screen.
Control of the data analyzer unit is performed by sending calculator list data
(CFX-9850G) or matrix data (CFX-9800G), which the data analyzer unit interprets as commands.
The data analyzer unit can be linked to a CFX-9850G or CFX-9800G graphic
scientific calculator by connecting the input/output terminals equipped on each
unit with a data communication cable (SB-62).
3
Chapter 1: Getting Ready
Command and Programs
There are a total of 10 commands defined for this data analyzer unit: Command 0 through Command 9. These commands can be used to specify such
parameters as the type of data being sampled, the channel being used for
sampling, the sample time, and the number of samples. Commands are sent
from a connected graphic scientific calculator (CFX-9850G/CFX-9800G) to
the data analyzer unit, which then executes them.
A program is a set of multiple commands that cause the data analyzer unit to
perform a series of actions. For example, you could send a set of commands
that tell the data analyzer unit to set up, to sample some data, and then send
the data back to the calculator. Data analyzer unit programs can be written
using the CFX-9850G graphic scientific calculator’s program function only.
Be sure to read the documentation that comes with the CFX-9850G to thoroughly familiarize yourself with the programming function before trying to use
it to control this data analyzer unit.
Conversion Equations and Post-processing
Conversion Equations
The physical units measured by the probes are converted into a more easily
understood unit of measurement by built-in conversion equations. In the case
of the temperature probe, for example, changes in temperature are measured by fluctuations in electrical resistance by an electrical device called a
“thermistor.” The conversion equation converts the measured resistance value
to a temperature unit (such as degrees Celsius) and produces the converted
value on its screen. Each of the analog channels and the SONIC channel
has its own built-in conversion equation.
Post-processing
The data analyzer unit provides the means to perform certain calculations
using sampled data when required. This is called “post-processing” (processing of data after it is sampled).
This data analyzer unit supports three types of post-processing: first derivative, first and second derivatives, and statistics. Selecting first and second
derivatives for post processing, for example, calculates the first and second
derivatives* for the sample data and stores the result into memory. Selecting
statistics calculates the mean, standard deviation, minimum and maximum
for the sampled data and stores them in memory. Calculated data can also
be downloaded to a graphic scientific calculator.
* The term “derivative” here means “time increment.”
4
Chapter 1: Getting Ready
Data Filtering
Static “noise” can sometimes cause sampled data to become corrupted,
making it impossible to obtain accurate results from calculations and analysis. This data analyzer unit includes a data filtering system that eliminates
noise and help to make sure that data is always accurate.
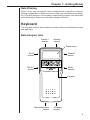
Keyboard
The front panel of this data analyzer unit has a liquid crystal display screen
and eight keys.
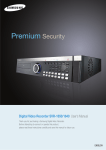
Data Analyzer Unit
Channel 1
terminal
Channel 2
terminal
Display screen
Channel 3
terminal
DIG IN
terminal
SONIC
terminal
DIG OUT
terminal
Keyboard
Data communication
terminal
AC adaptor
terminal
5
Chapter 1: Getting Ready
Key Functions
The following describes the functions of each of the eight keys on the keyboard. This section is intended more as a reference and contains information
that may be difficult to understand at first glance. Don’t worry though, many
of the expressions used in the following key function descriptions will become clearer after you read the section of this manual titled “Modes.”
Key
Description
[SHIFT]
Pressing this key shifts the keyboard and accesses the functions printed above the [MODE], [INTERNAL], and [HALT] keys.
A SHIFT indicator appears on the display screen to indicate
when the keyboard is shifted.
[MODE]
Pressing this key switches the data analyzer unit between the
Multimeter Mode and Communications Mode.
[SETUP]
Pressing [SHIFT] [MODE] enters the Setup Mode for
configuring the data analyzer unit for manual stand-alone sampling.
[TRIGGER]
Each press of this key while the data analyzer unit is in the
READY state (indicated when the READY indicator is on the
display screen) starts a data sampling operation.
[ENTER]
The [TRIGGER] key functions as an [ENTER] key in the Setup
Mode. It is used to select values when manually setting up the
data analyzer unit in the Setup Mode.
[CH-View]
This key’s operation varies according to the mode the data
analyzer unit is in.
P.47
• Communications Mode: Each press of [CH-View] while the
data analyzer unit is in the READY state or while sampling
is in progress sequentially selects each currently active channel and displays the data sampled over that channel on the
screen. Selecting a channel causes its channel indicator to
flash on the screen. After sampling is done (indicated by
the DONE indicator), each press of [CH-View] shifts the
sequence that data is sent to a graphic scientific calculator
in the following sequence:
RecTIME → CH1 → CH2 → CH3 → SONIC → DIG IN →
RecTIME → ...
• Multimeter Mode: Each press of [CH-View] in this mode
switches the sampling channel in the following sequence:
CH1 → CH2 → CH3 → SONIC → DIG IN → CH1 → ...
• Internal Mode: The [CH-View] key is disabled in this mode.
6
Chapter 1: Getting Ready
Key
Description
• Data-Log Mode: Each press of [CH-View] in this mode
sequentially switches the channel whose data is on the display. The channel indicator of the currently selected channel flashes on the screen.
[INTERNAL] Pressing this key while in the Communications Mode enters
the Internal Mode. Pressing it again returns to the Communications Mode
P.35
[XMIT-9800]
Pressing [SHIFT][INTERNAL] sends data to the CFX-9800G.
[ON/OFF]
Pressing this key turns data analyzer unit power on and off.
[HALT]
• Pressing this key while a sampling operation is in progress
halts the operation.
• Pressing this key in the Data-Log Mode exits the Data-Log
Mode and returns to the DONE state in the Communications Mode.
• Pressing this key during manual setup in the Setup Mode
exits the setup procedure.
[RESTART]
Pressing [SHIFT] [HALT] clears any data sampled up to that
point, returns to the READY state, and stands by for the next
sampling operation to be started.
[DataLOG]
Pressing this key enters the Data-Log Mode. Note, however,
that pressing this key in the Multimeter Mode sequentially
changes the unit of measurement for the currently displayed
channel.
[NEXT]
The [DataLOG] key functions as a [NEXT] key in the Setup
and Data-Log Modes.
• Pressing [NEXT] while performing manual setup recalls the
next setting value for the item you are setting. [SHIFT]
[NEXT] returns to the previous value.
• Pressing [NEXT] in the Data-Log Mode recalls the next data
item. [SHIFT] [NEXT] recalls the previous data item.
7
Chapter 1: Getting Ready
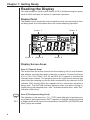
Reading the Display
The data analyzer’s liquid crystal display (LCD) is divided among five areas,
each of which indicates the status of a particular operation.
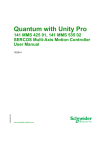
Display Panel
The display screen shows the current operating mode, the input/output channel being used, and information about the current sampling operation.
Area 1
Area 3
Area 4
Area 2
Area 5
Display Screen Areas
Area 1 (Channel Area)
This area shows the active channel and the sampling unit for each channel,
and whether recorded time data is absolute or relative. Channel indicators
(CH1, CH2, CH3, SONIC, DIG IN, and DIG OUT) appear to indicate the
currently active channel. The sampling units to the right of each channel indicator show the sampling unit for the probe connected to the channel. An EQ
indicator (EQ1 through EQ4) also appears when a conversion equation is
being used. The RecTIME indicator appears when time data is being recorded along with sampled data. “Abs.” indicates absolute time, while “Rel.”
indicates relative time.
Area 2 (Post-processing Area)
P.4
P.6,7
8
The indicators in this area (d/dt, d2/dt2, STAT ) show what type of post-processing of data is being performed. SHIFT appears to indicate that the keyboard
is shifted and that the functions marked above the [MODE], [INTERNAL] and
[HALT] keys are enabled.
Chapter 1: Getting Ready
Area 3 (Sampling Status Area)
The indicators in this area shows the current data sampling status. READY
means the data analyzer is ready and standing by for data sampling, SAMPLING indicates that a sampling operation is in progress, and DONE means
that the sampling operation is finished. All three of these indicators flash in
the Setup Mode.
Area 4 (Mode Area)
These indicators show the current operating mode of the data analyzer. The
DATA-LOG, INTERNAL, or MULTIMETER indicator appears when the corresponding mode is entered. No indicator is shown when the data analyzer is
in the Communications Mode.
Area 5 (Data/Output Unit Area)
This area shows the sampled data values and error codes. The indicators on
the right include unit (meters, Ω, seconds, etc.) indicators and a low battery
indicator.
• Keep in mind that Area 1 shows the unit used by the probe for sampling,
while Area 5 shows the unit used for displayed or output values, so the
two areas may indicate two different units. When the temperature probe
is used, for example, Area 1 will indicate Ohms (Ω) as the unit because
the probe uses a thermistor to measure temperature as a change in
resistance. Area 5, on the other hand, will indicate °F or °C, because this
is the unit used to represent the displayed value.
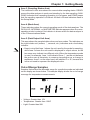
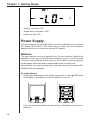
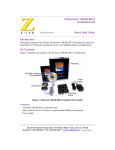
Out-of-Range Samples
Samples that exceed the allowable range for a particular probe are indicated
on the display as shown below. This sample display shows the out-of-range
message for temperature measurements.
• Voltage: Greater than 10V
• Temperature: Greater than 130°C
• Light: Greater than 999
9
Chapter 1: Getting Ready
• Voltage: Less than –10V
• Temperature: Less than –20°C
• Light: Less than 100
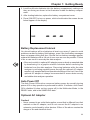
Power Supply
The data analyzer can be powered by four AA-size batteries or an optional
AC adaptor (AD-A60024). This section tells you when you should replace
batteries and how to connect the optional AC adaptor.
Batteries
The data analyzer can be powered by four AA-size batteries. Battery life
depends on how long you leave the data analyzer turned on, and the amount
of current required by the probes you use. A low battery message appears
on the display whenever battery power drops below a certain level.
Note that you can extend battery life by using the optional AC adaptor (ADA60024) whenever possible.
To load batteries
1. Holding the data analyzer unit upright, press down on the {▲OPEN} part
of the battery compartment cover and slide the cover off.
If you are replacing batteries, remove all four old batteries from the compartment.
10
Chapter 1: Getting Ready
2. Load four AA-size batteries into the battery compartment, making sure
they are facing as shown in the illustration inside the battery compartment.
3. After loading batteries, replace the battery compartment cover.
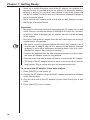
4. Press [ON/OFF] to turn on power, which should make the screen shown
below appear on the display.
Battery Replacement Interval
You should replace all four batteries at least once every 2 years to avoid
problems caused by battery fluid leakage, even if the low battery messages
does not appear during that time. Should the low battery message appear,
replace the batteries with a full set of new ones as soon as possible. Failure
to do so can result in errors by the data analyzer.
• Be sure to switch to optional AC adaptor power or back up sampled data
by transferring it to a graphic scientific calculator before removing the
batteries from the data analyzer. Removing batteries while the data
analyzer is not being supplied power through the optional AC adaptor
results in all sampled data and operational settings to be lost. Use of the
optional AC adaptor is always recommended to ensure data security
and stable data analyzer operation.
Auto Power Off
The Auto Power Off function conserves battery power by normally turning
power off if no key operation is performed for about 10 minutes. Auto Power
Off is disabled (it does not turn power off) in the Multimeter Mode, in the
READY state, and in the SAMPLING state.
Optional AC Adaptor
Caution!
• Never connect to an outlet that supplies current that is different from that
marked on the AC adaptor, and do not connect the AC adaptor to an
extension cord shared by other devices. Either of the above creates the
danger of fire and electrical shock.
11
Chapter 1: Getting Ready
• Never try to modify the power cord of the AC adaptor, do not allow it to
become broken or cracked, and do not subject it to excessive bending,
twisting, or pulling. Do not place heavy objects on top of the power cord
and do not subject it to direct heat. Any of the above creates the danger of
fire and electrical shock.
• Never touch the AC adaptor while your hands are wet. Doing so creates
the danger of electrical shock.
Important!
• Never pull on the power cord when unplugging the AC adaptor from a wall
outlet. Doing so creates the danger of damage to the cord, fire, and electrical shock. When unplugging the AC adaptor, be sure to grasp the body
of the adaptor.
• Be sure to unplug the AC adaptor from the wall outlet whenever leaving it
unattended for long periods.
• Be sure to use only a genuine optional AD-A60024 AC adaptor. Use of
another type of adaptor can result in damage to the adaptor, the data
analyzer, or some other unforeseen serious problem. Use of an unauthorized AC adaptor also voids your warranty.
• Remove the batteries from the data analyzer whenever you plan to operate under AC adaptor power for long periods.
• Be sure to turn the data analyzer off before connecting the AC adaptor.
• The body of the AC adaptor becomes warm to the touch when used for
long periods. This is normal and does not indicate malfunction.
To connect the AC adaptor to the data analyzer
1. Press [ON/OFF] to turn power off.
2. Connect the AC adaptor’s plug into the AC adaptor terminal on the bottom
of the data analyzer.
3. Plug the other end of the AC adaptor’s power cord directly into a wall
outlet.
4. Press [ON/OFF] to turn on power.
12
Chapter 1: Getting Ready
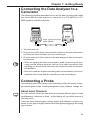
Connecting the Data Analyzer to a
Calculator
The following procedure describes how to use the data communication cable
that comes with the data analyzer to connect it to a CFX-9850G or CFX9800G graphic scientific calculator.
Data communication
cable (SB-62)
1. Turn both units off.
2. Plug one end of the data communication cable into the data communication terminal of the calculator you are connecting to.
3. Plug the other end of the cable into the data analyzer’s data communication terminal.
• When connecting the data communication cable, be sure to push it securely into the terminal as far as it will go. Poor cable connection is the
first thing you should check whenever you experience data communication problems.
• Be sure to read the chapter describing data communication in the documentation that comes with the calculator you are connecting to.
Connecting a Probe
Connecting probes to the various input channels provides the means to sample various types of data, including temperature, light, distance, voltage, etc.
About Input Channels
P.8
You can connect more than one probe and sample different types of data
simultaneously. Indicators in Area 1 of the display tell you which channel is
currently active.
There are three channel types: analog, digital, and ultrasonic, and the connector of each type is slightly different to protect against plugging in the wrong
type of probe.
13
Chapter 1: Getting Ready
Analog Input Channels
CH1, CH2, and CH3 are analog input channels for connection of probes that
measure electrical change. All three analog channels perform identical types
of sampling.
Ultrasonic Input Channel
This channel is for connection of a distance sensor that can be used to measure the distance from the probe to an object.
Digital Input/Output Channel
This channel provides a means to connect to an external device for exchanging 0 to 5V binary signals, which means you can use digital data from the
data analyzer in experiments and other procedures. One very simply application using this channel would be to drive an LED in accordance with digital
signals output from the data analyzer.
14