1
There are three general sheets for emissions to water, for providing supporting information and data
(according to the monitoring regime in place):
•
•
•
The "6. General info WWTP" sheet, for providing contextual information
The "7. Water freq sampling" sheet, for providing data
The "7. Water periodic" sheet, for providing data
As for emissions to air, a number of data sheets will be automatically generated, according to the
specified points of release in sheet 2. Also again, with the selection of a FDM sector, only the
parameters for which it was concluded to collect data at the kick-off meeting will be shown in the
data sheets.
Data can be reported for three reference years (2012, 2013, 2014). As a general remark, it should be
emphasised that reported data should refer only to normal operating conditions.
Please note that emission data are requested not only in concentrations, but also in specific loads
(except for the water flow). The units1 for specific loads should be chosen from a drop-down list. The
data reported here should refer only to normal operating conditions; data referring to other than
normal operating conditions, as well as periods when the plant was not operational, should be
excluded.
Data on removal efficiencies are also requested. Removal efficiency can be easily calculated from the
influent and effluent data, as follows:
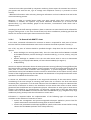
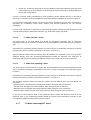
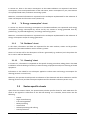
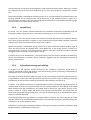
=
where:
EF
I
E
−
is the removal efficiency, expressed in %.
is the influent data, expressed in concentration (mg/L) or specific load
(kg/tonne).
is the effluent data, expressed in concentration (mg/L) or specific load
(kg/tonne).
As for emissions to air, the following contextual monitoring information is requested in the sheets for
providing emission data:
- Sampling duration: duration of the sampling period related to the values reported for these
discontinuous monitoring events.
- Standard monitoring method: published or documented procedure for using the monitoring
approach and technique, so that comparable results can be obtained when the monitoring is carried
out at different times or by different organisations. Please report CEN, ISO or other standards, e.g. EN
872 for the measurement of total suspended solids.
- Uncertainty of a single measurement (%): the uncertainty assigned to a measured result represents
the size of the region around the result in which the 'true value' is expected to lie (with certain
probability, i.e. in 95 times out of 100, the result will be within these bounds); the range of dispersion
is inherent to the measurement approach and technique. For each pollutant monitored the
uncertainty of measurement should be reported in the form of a percentage of the measured value.
- Has the uncertainty already been subtracted from the values reported in this row? Specify (YES or
NO) whether the reported value is obtained directly from the calibrated measurement device, i.e. 'as
seen on the device screen', or is calculated as the number 'as seen on the device screen' minus the
uncertainty of the measurement in the form of a 95 % confidence interval.
1
The units for specific loads will be discussed in the questionnaire workshop in Brussels.
12
Workshop draft version EIPPCB/FDM BREF Questionnaire User's Manual