1
Group 1032i
B.3
B.3. STATE CHART DIAGRAM
State Chart Diagram
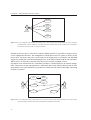
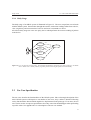
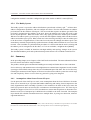
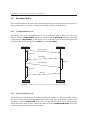
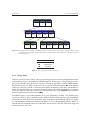
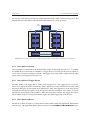
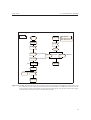
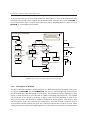
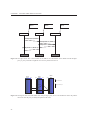
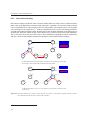
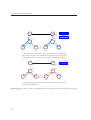
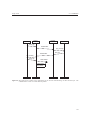
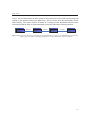
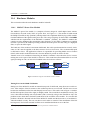
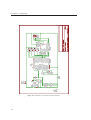
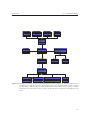
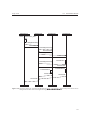
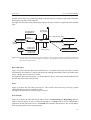
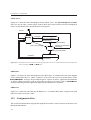
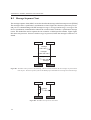
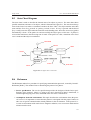
The state chart is used to describe the internal state of an object or process. The state chart shows
possible transitions and states of an object, which is illustrated in Figure B.3. The state chart always
starts in the Initial state where a transition is made to the State "Idle". The object remains in the Idle
state until the Event "key_pressed" or "packet_received" occurs. If a key is pressed and the Guard
[key==send] is true the object takes the transition to the Sending state, where the Action send_packet
automatically is done. If the packet is send successfully the object goes to idle state. If packet is
received the transition to the Receiving state is made. If the packet is valid, a transition to the Final
state is made and the object is terminated.
Figure B.3: The figure shows a state chart.
B.4
Holzmann
The Holzmann method is a procedure for specifying communication protocols, created by Gerard J.
Holzmann [Hol91]. The method focus on describing the protocol in 5 phases:
• Service specification: The service specification provides the designer with the basic specifications of the protocol: where it is going to be used, what kind of data is transferred, is
acknowledgment going to be used, what kind of bit error rates is tolerated etc.
• Assumptions about the environment: This topic describes the environment where the protocol is used. It is important to ensure that the protocol is designed with the proper features to
take care of special communication related problems in the environment. If the protocol i.e.
is used in environment with much electro magnetic radiation, error correction and detection
schemes must be used.
191