1
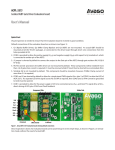
ACPL-C79B, ACPL-C79A & ACPL-C790
Isolation Amplifier Evaluation Board User Manual
User Guide
Quick-Start Guide
Once visual inspection is done to ensure that the Evaluation Board is received in good condition, the Evaluation Board
can be powered up in just 3 simple steps according to Figure 1 as shown:
1. Select either one of the provided sensing resistors (10mΩ or 15mΩ), or user’s own sensing resistor and mount it
(through soldering) on pads provided for R1 on the Evaluation Board;
2. Connect the necessary power supplies and current source as shown:
a. Connect 1st isolated 5V DC supply (DC Supply 1) to connector CON1 as shown;
b. Connect a 3.3V DC supply (DC Supply 2, can be non-isolated) to connector CON2 as shown;
c. Connect, through soldering, the required input current source (for sensing) cables as shown;
3. Supply the input current (subject to a maximum signal level of 250mVpp, or ±125mVdc across resistor R1) through
the cables (as shown in 2c) and monitor the output through an oscilloscope.
2c
Current Source Cables
for sensing
1
Gnd2
+3.3V
2b
DC Supply 2
Gnd1
DC Supply 1
+5V
2a
Output to
Oscilloscope
for monitoring
/or MCU for
Readings
3
Figure 1. Default Test Setup of Evaluation Board
Schematics
Schematics of the Evaluation Board are as shown in Figure 2.
+V dd3
+V dd2
U3
L78L33ACD 13TR
8
1
TP1
1 V dd1
C8
100nF
2
3
6
7
C7
100nF
U1
CON1
J2
R4
1K , 1%
ACP L-C79X
8
C1
100nF
3 Batt-/Gnd1
U2
2
3
6
7
2 9V Batt+
V ref
J1
LM78L05ACM
1
1
C2
100nF
V DD1
V DD2
8
C5
100nF
GND2
GND2
GND2
C13
R5
C6
100nF
C14
NM
1K , 1%
J4
10uF
CON1X3
C10
GND1
GND1
GND1
2
Rsense+
V in+
V out+
TP2
10K , 1%
TP4
R6
R8
C3
22nF
TP5
10K , 1%
2
10K , 1%
3
+
TP3
R3
3
Rsense-
V in-
V out-
GND2
7
10R, 1%
R1
68pF
GND2
R7
R2
7
GND1
4
GND1
6
10R, 1%
C15
C9
NM
68pF
R9
10K , 1%
0.1uF
C11
6
GND2
GND2
GND2
U4
OPA237UA
J3
+V dd2
CON2
+V dd3
1
2
3
4
5
6
-V dd3
C12
0.1uF
6PIN HEADER
GND2
GND1
4
Gnd1
Gnd2
GND1
5
V ref
GND2
-V dd3
GND2
GND2
Figure 2. Schematics of ACPL-C79X Evaluation Board
Board Description
Using the Board
The ACPL-C79X evaluation boards (shown in Figure 3),
can accommodate either a ACPL-C79B(0.5% tolerance),
ACPL-C79A(1% tolerance), or ACPL-C790(3% tolerance)
device on U1, to demonstrate the high linearity and lowoffset capability of Avago’s Isolation Amplifier over a wide
range of input current conditions. It allows a designer to
easily test the performance of the high-precision isolation amplifier in an actual application under real-life operating conditions. Many of the circuit recommendations
discussed in Application Note 1078 are implemented on
the board. Operation requires merely the addition of a
5V Supply and a low-resistance shunt resistor on the input side of the isolation amplifier. The board has holes for
mounting a through-hole shunt, and pads for mounting
a surface-mount shunt. The board may also be used for
general voltage isolation without any shunt resistor.
The evaluation board is easily prepared for use. Only minor preparations (just by soldering of shunt resistor, wires
for power / sense current path and output signal) are required. The evaluation board is having a default setup 1 as
shown in the tables when shipped to customer. Customer
is free to choose any one of the 6 setup configurations as
shown in the tables by setting J1, J2, J3 and J4 as shown.
As can be seen on the board, the isolation circuitry is easily
contained within a small area while maintaining adequate
spacing for good voltage isolation and easy assembly. The
overall size of the evaluation board has been enlarged to
allow mounting of feet for stand-alone use (using the 4
drilled holes at the corners of the board).
Figure 3. Top View of ACPL-C79X Evaluation Board
2
Table 1.
Recommended Vin
for better linearity [1] Vdd1
Vdd2
Vdd3
-Vdd3
Default Setup 1
<230mVpp
+5Vdc
+3.3Vdc
+3.3Vdc
0V
Setup 2
<500mVpp
+5Vdc
+3.3Vdc
+3.3Vdc
-3.3Vdc
Setup 3
<230mVpp
+5Vdc
+5Vdc
+3.3Vdc
0V
Setup 4
<500mVpp
+5Vdc
+5Vdc
+3.3Vdc
-3.3Vdc
Setup 5
<440mVpp
+5Vdc
+5Vdc
+5Vdc
0V
Setup 6
<550mVpp
+5Vdc
+5Vdc
+5Vdc
-5Vdc
Notes
1. Linear input range is limited by the post-amp output swing range. To avoid this limitation, directly measure the VOUT+, VOUT– of the isolation
amplifier.
In order to satisfy the above Vdd1, Vdd2, Vdd3 and –Vdd3 voltages, J1, J2, J3 and J4 must be set according to the table
as shown below:
Table 2.
J1 [1]
J2
J3
J4
Remarks
Default
Setup 1
Always
shorted
Shorting Vdd2
& Vdd3 pins
Short
Open
Only 2 external supplies (+5V Vdd1 & isolated +3,3V for Vdd2) are
needed
Setup 2
Always
shorted
Shorting Vdd2
& Vdd3 pins
Open
Short
3 external supplies (+5V Vdd1, isolated +3,3V for Vdd2 and Vdd3,
while isolated -3,3V for –Vdd3) are needed.
Setup 3
Always
shorted
Shorting Vdd3
& C8_2 pins
Short
Open
Only 2 external supplies (+5V Vdd1 & isolated +5V for Vdd2) are
needed, Vdd3 is obtained thru converter U3.
Setup 4
Always
shorted
Shorting Vdd3
& C8_2 pins
Open
Short
3 external supplies (+5V Vdd1 & isolated +5V for Vdd2, while
isolated -3,3V for –Vdd3) are needed, Vdd3 is obtained thru
converter U3.
Setup 5
Always
shorted
Shorting Vdd2
& Vdd3 pins
Short
Open
Only 2 external supplies (+5V Vdd1 & isolated +5V for Vdd2 &
Vdd3) are needed.
Setup 6
Always
shorted
Shorting Vdd2
& Vdd3 pins
Open
Short
3 external supplies (+5V Vdd1, isolated +5V for Vdd2 & Vdd3,
while isolated -5V for –Vdd3) are needed.
Notes
1. To obtain +5Vdc at Vdd1, a 9V Battery can be connected across Pin-2 and 3 of CON1 connector or by connecting an external +5V DC supply directly
to Pin-1 and 3 of CON1 connector. J1 can be left shorted permanently unless U2 is non-functioning.
The output signal is measured between the “Vout” and “GND2” terminals (at the output side of the board). With all connections made and power supplies turned on, the approximate relationship of output voltage to input current is:
VOUT = 8.2 x VIN, where
VIN= RSENSE x IIN;
With the shunt resistor in place, the maximum differential input voltage swing for linear operation is ±200mV as specified in the datasheet. However, input voltage as high as ±300mV can be safely applied with minimal performance
degradation.
When 68pF capacitance is selected for both C9 and C10, the bandwidth will be limited to 150kHz. To obtain 200kHz
bandwidth, change both C9 & C10 to 47pF.
3
Output Measurement
A sample Vout against Vin waveforms are captured and shown in Figure 4 below.
(Orange and Green traces are the input and output voltages respectively).
VIN+ = 100 mV, 50kHz.
Vout is taken at U4 Vout node, which is at pin-3 of Connector CON2.
Figure 4. Vout vs Vin Voltage Waveforms
For product information and a complete list of distributors, please go to our web site:
www.avagotech.com
Avago, Avago Technologies, and the A logo are trademarks of Avago Technologies in the United States and other countries.
Data subject to change. Copyright © 2005-2011 Avago Technologies. All rights reserved.
AV02-2502EN - July 14, 2011