1
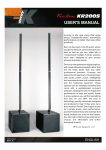
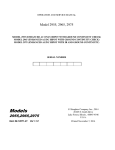
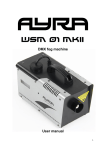
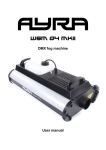
TSX1
Thermal protection device for electric units
4 analog input channels, 4 output relays
USER’S MANUAL
TESAR srl
52030 Chiassa Superiore (AR) - Italy
Tel +39 0575 3171 fax +39 0575 317201
[email protected]
www.trafo.it
Technical specifications
Power supply
!
!
!
!
!
nominal line voltage and frequency: 24 ÷ 250 Vcc and Vac at 40 ÷ 60 Hz
Maximum line voltage from 20 to 260 Vcc and Vac
Vcc with reversible polarity
Maximum power absorption 7 VA
Protection against electrical and magnetic noises
Inputs
!
!
!
!
!
4 analog input channels for three wires Pt100 probes compliance with
requirement DIN 43760. The operator can de-activate the 4th channel from
programming
connection with removable terminals for wires of 1,5 mm2 section
cables length compensation up to 500 m (1 mm2 section)
detection for broken or not connected probes
input channels protected against electromagnetic noises and spikes
Outputs
!
!
4 output relays with contacts capacity of 5A with 250Vac
- one relay for the 1st setpoint level (for fan control)
- one ralay for the 2nd setpoint level (pre-alarm)
- one relay for the 3rd setpoint level (unhook of the electrical unit)
- one relay for probe fault or working anomaly signaling (general alarm)
output connection with removable terminals for wire of 1,5 mm2 section and
capacity of 8A/250 Vac
Device dimensions
!
!
!
!
!
frontal dimension 96 mm x 96 mm compliance with DIN 43700 requirements.
Device length of 105 mm with rear terminals
assembling on the front of the electric panel
panel cut-out 92 mm x 92 mm
ABS self-extinguishing container
Frontal panel in anti-scratch polyestere with keyboard and signal leds
Performances
!
!
!
!
!
!
!
!
!
!
Temperature monitoring from 20°C to 200°C
Temperature measurements accuracy ±0,5% full scale, ±1 digit
Digital linearity of probe signal compliance with DIN 43760 requirements
Self-diagnostics
Operating temperature range from 5°C to 50°C
Humidity lower then 95% no-condensing
Compliance with CE requirement
User data storage for 10 years without power supply
Device functionality self-diagnostic
Alarm signal for working anomalies or wrong user data definition
Device and accessories description
The Figure represents the scheme of the device.
Frontal panel
1. Backlighted LCD display 16 characters per 2 lines. It allows the simultaneous
visualization of the measured temperatures. It is possible to visualize and modify
the alarm sets using the keys.
2. Leds A1, A2, A3 point out the corresponding alarm activation due to the
exceeding of the alarm sets by one of the measured temperatures.
3. General Alarm led points out anomalies. This led lights up in these cases:
- The self-diagnostics program pointed out an anomaly
- There is a damaged or not connected probe
- The system is in no-active control (data programming modality)
4. Second function v key. Pressed with the confirming key (7) it allows to enter
the programming modality; in this modality it allows the shift on number to be
modified.
5. Decrease u key. Out of the programming modality it allows the navigation in
the data visualization pages. In the programming modality it allows to decrease
the value of the programming datum.
6. Increase t key. Out of the programming modality it allows the navigation in the
data visualization pages. In the programming modality it allows to increase the
value of the programming datum.
7. Confirming å key. In the programming modality it confirms the set datum.
NEX
1
3
2
A1
A2
A3
7
4
5
6
front view
3
Back panel and accessories
1.
2.
3.
4.
5.
Connector for probes connection
Connector for the relay outputs
Power supply connector
Removable terminals for the wiring harness
Clips for the device clamping.
1
1
2
2
3
3
A
13
13
14
14
15
15
16
16
17
17
4
4
5
5
6
6
18
18
7
7
19
19
20
20
21
21
22
8
8
9
9
10
10
11
11
12
12
B
C
D
A1
4
A2
A3
22
25
25
23
23
26
26
24
24
27
27
5
3
2
1
Rear view and accessories
Mechanical installation
mm
9524,54mm
27,01
mm
105
mm
NEX
A2
A3
mm
9626,32mm
mm
9224,27mm
A1
mm
9626,32mm
mm
89,5 x24,0387,5
mm
The device provides a black self-extinguishing ABS container. The device
dimensions are compliance to the standard of DIN 43700: 96 mm x 96 mm section
and a maximum depth of 105 mm.
The dimensions of the panel perforation are 92 mm x 92 mm. The fixing is carried
out using the clamps provided with the device.
mm
9224,27mm
Electrical connections
All the connections are carried out with the removable terminals provided with the
device for a simplified wiring harness. For the wiring harness you can refer to the
figure 5 and to the terminals numeration.
4
Power Supply
The power supply connection is performed connecting the power voltage to the
terminals 25 and 27 without any respect of polarity for Vcc.
The nominal allowed voltages are in the 24 Vcc 240 Vcc range for the direct voltage,
or in the 24 Vca 240 Vca range with 50 Hz frequency for the alternate voltage.
Terminal 26 has to be connected to the ground reference.
The device power supply is protected from momentary input over-voltages.
The damage due to a wrong power supply is not covered by guarantee.
The device does not provide internal fuses, so that you must provide an external
adequate protection.
Relays outputs connection
Figure 5 shows the position of the relays not excited (turned off device).
The alarm relays are excited when one of the probes exceeds the set limit. The
General Alarm relay operates in intrinsic security, so that it is excited at the device
switching on, and it is de-excited when conditions that compromise the device
functionality take place. In this way when the device is switched off you have the noactive control signal.
Probes connection
The analog inputs are compatible with three wires Pt100 resistive probes.
For the sensors connection we suggest you the following expedients:
! use a shielded cable to connect the probe with the device and with the shield
fixed to the ground reference inside the electric panel
! the connection cables
route has to be
separated from the
high-tension cables
6
5
8
1
3
4
7
2
9 10 11 12
and
from cables
probe A
probe B
probe D
probe C
driving inductive
elements as remoteinput probes Pt100
control switch
! the 3 wires of each
probe will have the
same length and
13 14 15 16 17 18 19 20 21 22 23 24
section so that they
General
have all the same line
A1
A3
A2
allarm
resistance. The line
output relays
resistance will be
red
lower than 10 W,
red
corresponding to a
25 26 27
wire of 500 meters
white
length and 1 mm2
probe Pt100
power supply
section. It is also
possible to use 2
5
!
jumper
section. It is also possible to use 2
wires Pt100 probes making a link
on the terminals for the line
resistance measure, as shown in
figure. In that case the temperature's 1 2 3
measure will be affected by an error 3 wires probe
as large as longer is the probe
connection cable.
1
2
3
2 wires probe
Instructions for use
Visualization and keyboard use
On the NEX device the measured temperatures and the set data visualization is done
by the navigation on pages by keyboard. Besides this kind of visualization has a very
intuitive use, it allows the simultaneous visualization of data related to the same
ambit.
Navigation on pages
Navigation on visualization pages takes place using the increase and decrease keys
referred to with t and u symbols.
Pages are cyclically placed: when you arrive to the last page you directly go to the
first one. Referring to the scheme, with the key u you run the pages clockwise,
whereas with the key t you run the pages anticlockwise.
The usually visualized page is page 1, which is the principle one. It shows the
temperatures measured by the probes. The device visualizes this page at the
1
A 888°
C 888°
B 888°
D 888°
2
7
6
LIGHT ALWAYS ON?
YES/NO
MAX A 888°B 888°
C 888°D 888°
DEFAULT DATA ?
YES/NO
set ABC
A2 888°
HYS 88°
IMP 88s
DEL 88s
AUT 0
set D
A2 888°
A1 888°
A3 888°
A1 888°
A3 888°
3
4
5
ENABLE
PROBE D ? YES/NO
6
4b
switching on and every time it is standing for a time greater than 30 seconds (no key
pushed).
Page 2 visualizes the maximum values of temperatures measured by each probe.
Page 3 visualizes the three alarm levels setpoints programmed for probes A, B and C.
Page 4 visualizes the three alarm levels setpoints programmed for probe D. If lines
appear instead of numbers, it means that the D probe has been de-activated by
programming. Entering the programming modality from this page, you go to page
4b that allows the activation or de-activation of the D probe.
Page 5 visualizes the hysteresis, delay, alarm memory and impulsive release data.
Page 6 provides the loading of the data set usually fornished with the device.
In page 7 you can choose the operation of the display backlighting: always or
limited-time alight.
Programming
The programmable data can be modified following a procedure, later on described,
that allows to intuitively set data in little groups.
Data are visualized collected in pages as described in the previous paragraph. To
modify one of these groups you must follow the next procedure:
! using t and u keys (as indicated in the previous paragraph) you can choose the
visualization page containing the data to be programmed
! simultaneously pushing v and å keys you can enter the programming
modality.
In the programming modality, according to the data group, either a guided page with
specific questions or the same page with a flashing cursor standing on a cipher of the
first datum to be modified, appears. The programming modality entry is easily
recognizable, because also the General Alarm led lights up to signal that the device is
no more in the active-control modality.
Once you entered the programming modality, a flashing cursor appears on one of the
visualized data. Using t and u keys it is possible to increase, decrease or anyway
modify. For numerical data it is possible to shift the cursor to the next cipher pushing
the v key. The shift is cyclical: keeping on pushing the v key you pass through all
the datum ciphers and after the last one you return to the initial one. This is usefull to
correct erroneous sets. When the datum definition is completed, you must confirm it
pushing the å key and the cursor will shift on a cipher of the next datum. If you don't
want to modify the datum it's sufficient to confirm it pushing the å key.
Once you have confirmed the last programmable data of the visualized page, the
device carries out a conformity test of the set data: if the test is positive, the set data
are storaged and the device leaves the programming modality and returns to the usual
visualization modality.
If the data test is negative an error signal appears and the device doesn't leave the
programming modality showing the same page to correct data.
7
The exit from the programming modality can occur also for inactivity, if nobody
pushes a key for at least 30 seconds. In that case the device ignores the data
modifications eventually done and restores data set before entering the programming
modality.
You have to program even not numerical data using the t and u keys and confirm
them by the å key.
A brief description of each page programming follows:
! in page 2 of in the programming modality, simultaneously pushing the v and
the å keys, you can modify the maximum temperatures reached by each
acquisition channel. You can only put these data at zero. Entering the
programming modality the four maximum values will be simultaneously put at
zero. Anyway you won't see zeros because the device, once you have finished
the zero setting, will do a comparison with the measured temperatures that will
surely be greater so that the maximum values will immediately be updated.
! in page 3 of in the programming modality, simultaneously pushing the v and
the å keys, you can modify the temperature levels relative to the three A, B and
C probes alarms. The data modification modality is the general one described
above. The A1 threshold is the first alarm level, the A2 threshold is the second
one and the A3 one is the last level (transformer's uncoupling).
! in page 4 of in the programming modality, simultaneously pushing the v and
the å keys, you can go the 4b page that allows the D probe activation or deactivation. This probe is usually joined to the transformer's core, but sometimes
it's not installed. In that case you have to de-activate the probe from
programming to avoid the system's signal of an alarm for the disconnected
probe. You can decide to activate or de-activate the D probe using the t and the
u keys. If you activate the probe, you go to the temperature's thresholds
programming page for the alarms: as for A, B and C probes the A1 threshold is
the first alarm level, the A2 threshold is the second one and the A3 one is the last
level (transformer's uncoupling).
! in page 5 of in the programming modality, simultaneously pushing the v and
the å keys, you can set a series of data whose meaning is specified in the
Description of programmable data paragraph.
! in page 6 of in the programming modality, simultaneously pushing the v and the
å keys, you can restore the standard data. In the programming modality it's
necessary to answer 'sì' or 'no' using the t and u keys.
! in page 7 of in the programming modality, simultaneously pushing the v and
the å keys, you can choose two different options for the backlighting of the
display. In the programming modality it's necessary to answer YES or NO using
the t and u keys. If you answer YES the display will be always lighted. If you
choose the second operation modality the backlighting will be usually turned off
and will be turned on for a short time when the user pushes any key.
8
Entering the programming modality, if you simultaneously push the v and the å
keys in the page 1, you can cancel the alarms in case the alarm memory has been
programmed (see the Description of programmable data paragraph).
When the programming data modality is activated the system is
in no-active control modality, so that the relays are de-excited
and the “No-active control/General alarm” led lights up.
Description of programmable data
The programmable data are the following ones:
! 3 temperatures setpoint for the ABC probes: the exceedings of those levels
excites the alarms A1, A2 and A3. On these data a condition is present: the value
of A1 has to be lower than the value of A2 and this one has to be lower than that
of A3. If you don't respect this condition, the system signals an error and doesn't
permit the exit from the programming modality.
! 3 temperatures setpoint for the D probe: the exceding of the set levels excites the
alarms A1, A2 and A3. There is a condition on this data: the value of A1 has to be
lower than that of A2, whose value has to be lower than that of A3. If you don't
respect this condition, the system signals an error doesn't permit the exit from the
programming modality.
! A unique hysteresis datum for all the programmable temperature thresholds. It
avoids the alarms to switch on and off closely in time because of temperature
oscillation around the temperature setpoint. This data appears as HYS in page 5.
! A delay datum to excite each alarm when a temperature threshold is exceeded: it
represents the minimum time the temperature has to spend over the setpoint for
the alarm activation. It avoids the alarms to be activated for temporary
exceedings of the temperature setpoint. This data appears as DEL in page 5.
! Alarm memory for the alarms also when the temperature returns under the
corresponding threshold value. You can select this option when you want to
verify the alarm causes: in fact, in this case the alarm has to be de-activated by
hand using the keys on the frontal panel. This data appears as AUT in page 5.
! Impulse length. It is activated only on the A3 alarm and you have to use it only if
you have a throw coil isolator for the electric unit's unhooking. The relay
corresponding to the A3 alarm (unhooking) will be closed for a number of
seconds equal to the impulse length. If you don't want the relay to close you have
to set this datum equal to zero. This data appears as IMP in page 5.
Figure in the next page shows the significance of the programmable data above
described.
In the figure, on the horizontal axis is represented time and on the vertical one
temperature.
The horizontal lines correspond to the programmable temperature setpoint and this
datum minus the hysteresis (the dashed line). In the bottom of the figure is
represented the alarm situation, which means the corresponding relay's shut down.
9
At time T1 the curve representing temperature exceeds the setpoint, but the alarm
doesn't activate because temperature returns under the setpoint before the set delay
time T2's term. In this way you avoid the corresponding threshold activation when
you have very fast transients.
At time T3 the curve representing temperature exceeds again the setpoint and after
the set delay, at time T4, the output channel is activated.
At time T5 the curve representing temperature goes under the setpoint, but the alarm
delay
setpoint
alarm end
hysteresis
alarm start
Temperature
delay
T1
T2
T3
T4
T5
T6
Time
on
off
alarm status
is de-activated at time T6 when it goes under the value of the setpoint minus
hysteresis.
10