1
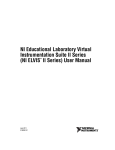
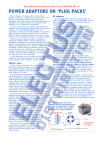
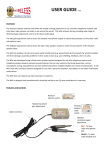
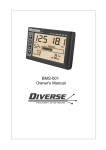
This report is due 2pm, the same day a fortnight after the scheduled day of your lab.
AMME2700: Instrumentation Lab 1
Resistor Circuit Analysis and High Pass Filters
You need to submit these laboratory notes as a group with all questions answered and all
measurements taken down by 2pm, the same day a fortnight after the scheduled day of your lab
(Eg. Monday if your session was on Monday). Please submit your finished version to the
assignment box near the drawing office of the Mechanical building.
Your Lab’s Tutor Name:
Lab Day and Week:
SIDs:
Names:
Introduction
This laboratory is aimed to provide you hands-on experience on building and analyzing basic
electronic circuits. You will:
1. Build a resistive circuit and then measure and verify the voltage across each resistor.
2. Build another resistive circuit and then measure and calculate the current through each
resistor and the power received by them.
3. Build and analyze a typical first order high pass filter circuit.
All of these exercises will be completed using the ELVIS II experimental kit. ELVIS II is a very
powerful general purpose development board containing many useful functionalities. The
functionalities that you will use in the ELVIS KIT include:
1. Digital Multi-meter (DMM)
2. Oscilloscope
3. Function Generator
4. Built in 5V power supply
5. Bode Analyzer
Furthermore, there is a breadboard which has exactly the same functionality as any typical
breadboard that you can purchase from most electronic shops (Eg. Jaycar). Additional information
about the ELVIS II can be found in the user manual: http://www.ni.com/pdf/manuals/374629c.pdf
1
This report is due 2pm, the same day a fortnight after the scheduled day of your lab.
Exercise 1: Voltage Across Resistors (Total 25%)
In this exercise, you will construct a circuit that consists of a number of resistors and then measure
the voltage across each resistor.
Procedure
To measure the resistance and voltage, you need to first connect the multi-meter leads to the
ELVIS kit at the correct ports. Connect the red multi-meter lead to the VΩ and the black lead to
the COM (ground) port, both ports being located on the left side of the ELVIS kit. After this, open
and use the Digital Multi-meter (DMM) software on the computer.
Consider the circuit given in Figure 1. Choose and measure the resistors (Please use resistances
<=1.1KΩ for each resistor to avoid voltage readings from being too small) that you want to use
for this circuit. Please note down the resistor values in Table 1 given below. Now build the resistor
circuit. Turn on the power supply of the ELVIS II kit and connect the built-in 5 Volt power supply
to complete the circuit. Measure the voltage in the direction from the power terminal + to -.
Figure 1: The circuit to be built for exercise 1.
Record your measured values in Table 1. (10% mark for measurements)
Table 1: Your resistor values and voltage measurement results.
Resistor ID
Chosen Resistance
Measured Voltage
Theoretical Voltage
Discrepancy (%)
(Ω)
(V)
(V) (For Q3, p.3)
(For Q3, p.3)
R1
R2
R3
R4
R5
R6
R7
R8
2
This report is due 2pm, the same day a fortnight after the scheduled day of your lab.
After measuring all your resistor values, please answer the following questions:
1. What was noticed about the voltage in R1 and R2 and also in R5 and R6? What theory
explains this observation? Using the same theory, write down all the possible equations
for the voltage across R8 in terms of the voltages across R5, R6 and R7. Verify these
equations by substituting your voltage measurements into these equations.
(2.5%)
2. Sum up your voltage around the main loop of the circuit (ie. Calculate
V2+V3+V4+V5+V7). What should this sum equal to and why?
(2.5%)
3. Please perform (and show) theoretical calculations to recalculate the voltage in all the
resistors based on their resistances and report the results in the “Theoretical Voltage (V)”
column of Table 1. Please also report the discrepancy between your measured and
calculated results as: 𝑒𝑒 =
𝑉𝑉𝑀𝑀𝑀𝑀𝑀𝑀𝑀𝑀𝑀𝑀𝑀𝑀𝑀𝑀𝑀𝑀 −𝑉𝑉𝐶𝐶𝐶𝐶𝐶𝐶𝐶𝐶𝐶𝐶𝐶𝐶𝐶𝐶𝐶𝐶𝐶𝐶𝐶𝐶
𝑉𝑉𝐶𝐶𝐶𝐶𝐶𝐶𝐶𝐶𝐶𝐶𝐶𝐶𝐶𝐶𝐶𝐶𝐶𝐶𝐶𝐶
3
× 100% (10%)
This report is due 2pm, the same day a fortnight after the scheduled day of your lab.
Exercise 2: Current and Power in Resistors (Total 35%)
In this exercise, you will build another resistive circuit but this time, the focus is on measuring
current and power.
Procedure
To measure current, you need to change the red multi-meter lead to the A port (Just below the
COM port). MORE IMPORTANTLY HOWEVER, when measuring current, you MUST
connect the ammeter in SERIES with the resistor of interest! Connecting in parallel will
cause a surge in current on the ammeter and may damage the board!!! Remember that
ammeters themselves have 0 ohm resistance!
Consider the circuit shown in Figure 2. Choose and measure the resistors that you want to use for
this circuit. Once again, please choose resistance sizes <= 1.1KΩ to avoid obtaining current
readings that are too small. Please note that unlike in Exercise 1, you are to use the 15 V power
supply instead for this circuit. Then of course, construct the circuit.
Measure and record the voltage across each resistance as this will be useful later. After this,
reconfigure your multi-meter lead connection and measure the current through each resistor. You
should measure the current in the direction of from the power terminal + to -. Report all your
measurements in Table 2.
(10% mark for measurements)
Figure 2: The circuit to be built for exercise 2.
4
This report is due 2pm, the same day a fortnight after the scheduled day of your lab.
Table 2: Your recorded and calculated results for Exercise 2.
Resistor ID
Chosen
Measured
Measured
Inferred Power
Current by
Theoretical
Resistance (Ω)
Voltage (V)
Current (A)
(W) (For Q3)
Ohm’s Law
Current (A)
(A) (For Q4)
(For Q5)
1
2
3
4
5
6
7
8
After performing all the required measurements, please answer the following questions:
1. How much current is being supplied by the power supply? Justify your answer.
(2.5%)
2. Sum up the currents measured in R2 and R3, then in R5, R6 and R7. What is noticed
about the sum of these currents? What theory explains this observation?
(2.5%)
3. Please state 3 possible equations that can be used to calculate power in each resistor based
on your measured resistance, voltage and current. Use one of these methods to calculate
the power received by each resistor and report the results in the “Inferred Power (W)”
column of Table 2. Please also calculate the power that the ELVIS II kit’s 5V power
supply provided to the circuit based on the current flowing through it. Verify that this
supplied power is correct by summing up the calculated powers in each resistor.
(5%)
4. You may have realized that you can use Ohm’s Law to calculate the current if you have
the measured resistance and voltage of each resistor. Thus, please calculate the current in
each resistor based on their measured resistances and voltages and report the results in the
“Current by Ohm’s Law (A)” column of Table 2. Make a brief comparison of these to
your measured current results.
(5%)
5. Please perform (and show) theoretical calculations to recalculate the expected current in
each resistor based on the known resistances and voltage source only and report your
results in the “Theoretical Current (A)” column of Table 2. Make a brief comparison of
these to your measured current results. (Note that it is not required to report the
theoretically calculated voltage and power) (10%)
5
This report is due 2pm, the same day a fortnight after the scheduled day of your lab.
Blank Page for answers to your questions
6
This report is due 2pm, the same day a fortnight after the scheduled day of your lab.
Exercise 3: High Pass Filters (Total 40%)
Objective
In this exercise, you will learn the concept of an electronic filter. You will study the characteristics
of an electronic filter by obtaining the frequency response of a high pass RC filter.
Theory
The impedance of a capacitor is inversely proportional to frequency. This characteristic can be
used to select certain frequencies of an input signal. This selection of frequencies is called filtering,
and a circuit which does this is called a filter.
Fig 3: A Low-pass filter
Fig 4: A High pass filter
If a filter passes high frequencies and rejects low frequencies then it is a high-pass filter.
Conversely, if it passes low frequencies and rejects high ones then it is a low-pass filter. Filters,
like most other systems, are not perfect. They don’t absolutely pass some frequencies and
absolutely reject others so a clear definition by quantification is required. A frequency is
considered passed if its magnitude response (voltage amplitude) is >= 70% (or
1
) of the peak
√2
input amplitude and is otherwise considered rejected. The frequency which achieves an output of
exactly
1
𝑉𝑉
√2 𝑖𝑖𝑖𝑖𝑖𝑖𝑖𝑖𝑖𝑖
is called the corner frequency, roll-off frequency or half-power frequency.
The corner frequency for a RC filter is given as follows:
For RC filter: fc =
1
2πRC
Hz
A bode plot (Fig. 6) is a graph of magnitude of the output voltage of the filter as a function of the
input signal frequency. It is used to characterize the range of frequencies in which the filter is
designed to operate within. The bode diagram also consists of a phase w.r.t frequency plot where
phase is a measure of the delay angle of the output response with respect to the input. Phase
diagrams, however, are outside the scope of this lab session.
7
This report is due 2pm, the same day a fortnight after the scheduled day of your lab.
Fig 5: The Bode Plot for a typical low pass filter
In this lab, you will also include an Operational Amplifier (Op Amp) in your filter circuit. Op
Amps, as the name suggests, are commonly used for amplifying the input voltage by a constant
factor. In your case, however, it is actually used to stop the back flow of electric current so that
your filter is protected.
Procedure
Fig 6: The 741Op Amp pin layout
Construct the first-order high pass filter circuit shown in Figure 7. The pin layout for the Op Amp
is shown in Fig 6. Please use C1 of capacitance 22nF (Use the DMM software to measure
capacitance) and R1 to be between 8000 to 15000 Ohms. Rf shall have the same resistance as R1
to obtain unity gain. Record the values of these components for future calculations. Use the
Function Generator software and apply a 4 V Peak to Peak sinusoidal wave as an input voltage to
the circuit.
As seen in Figure 7, AI0 is used to measure the output voltage and AI1 is used to measure the
input voltage as a function of time. While the input voltage should be equal to the FGEN input, it
will be measured anyway for verification purposes.
First, you shall use the bode analyzer program (accessible from the instrument launcher) to
analyze the spectral response of your high pass filter. Set AI0 as the response channel and AI1 as
the stimulus channel. Please use a frequency range of 50 Hz to 6 kHz. Then simply hit run.
8
This report is due 2pm, the same day a fortnight after the scheduled day of your lab.
The resulting bode magnitude curve should begin from a negative dB value and then increases
linearly until it reaches the 0 dB point where it levels off. The calculated corner frequency (p. 7)
should have a gain of 3 dB less than the level off point. If these results are not obtained, please
check your circuit connections and that you switched on the ELVIS II kit’s power. Please take a
screenshot and save the magnitude bode plot from the bode analyzer program as you will
need this for the questions on page 10. Attach the printed copy of this plot to the end of these
lab notes when it is ready for submission.
You shall now use the oscilloscope software directly to measure the spectral response. Begin the
experiment with a low frequency (≈100 Hz) and measure the input and output peak to peak
voltage from the scope screen. Now choose a reasonable frequency increment (Eg. 100 Hz),
decide your other input frequencies and make new measurements at those frequencies. Report
your results in Table 3. (20% mark for measurements, including the bode analyzer output)
Figure 7: The circuit to be used for Exercise 3
9
This report is due 2pm, the same day a fortnight after the scheduled day of your lab.
Table 3: Your recorded results for Exercise 3
Measurement No.
Frequency (Hz)
VIn
Vout
G(Vout/Vin)
20 log(G)
1
2
3
4
5
6
7
8
9
10
11
12
13
14
15
After performing all the required measurements, please answer the following questions:
1. Using your measured results, make a bode plot of the filter using the 20 log (G) values for
your y-axis. Compare this with what was found on the bode analyzer program. (5%)
2. Estimate 𝑓𝑓𝑐𝑐 based on your drawn bode plot from part (1). Compare this with the
theoretically calculated 𝑓𝑓𝑐𝑐 and the one estimated from the bode analyzer program.
(5%)
3. The transfer function to relate the voltage output to voltage input in this high pass filter is
given as:
𝑉𝑉𝑂𝑂𝑂𝑂𝑂𝑂
𝑅𝑅1 𝐶𝐶1 𝑠𝑠
=
𝑉𝑉𝐼𝐼𝐼𝐼
𝑅𝑅1 𝐶𝐶1 𝑠𝑠 + 1
Use MATLAB to draw the bode plot for this transfer function (Hint: Type “help bode”,
“help bodemag” and “help tf” on MATLAB). Please print this bode plot and attach it to
the end of these lab notes. Compare this bode plot to both your experimentally derived
one and the one from the bode analyzer program. (10%)
10
This report is due 2pm, the same day a fortnight after the scheduled day of your lab.
Blank Page for answers to your questions
11
This report is due 2pm, the same day a fortnight after the scheduled day of your lab.
Blank Page for answers to your questions
12