1
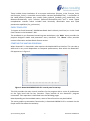
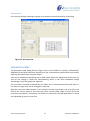
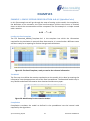
Print preview
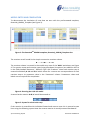
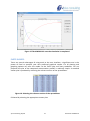
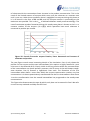
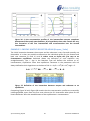
Print preview display allowing the graph to be resized and positioned prior to printing.
Figure 22: Print preview
PARAMETER SLIDERS
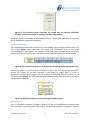
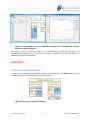
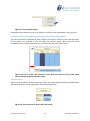
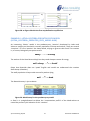
The parameter slider dialog box (see Figure 23) is only available as a feature of ReactLab™
KINSIM PLUS and allows dynamic simulation of the concentration profiles while interactively
adjusting the parameters using the sliders.
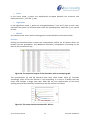
Each rate or equilibrium parameter has a slider which allows the adjustment of the value. As
soon as the change is made the corresponding values in the Excel workbook change
accordingly and all the graphs are updated.
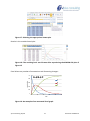
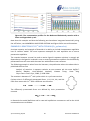
If a new value is entered in the edit box the sliders are re-centred around this new value. In
this way the range span can be changed as required.
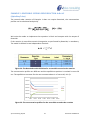
Note the rate value slider position is not centred since the span range is set to be from one
fifth of the current value to five times the value and the slider range is linear (from the
minimum to maximum). Conversely, the sliders are central for the logK parameters as these
are adjustable by plus or minus five.
Jplus Consulting Pty Ltd
15
ReactLab™ KINSIM 1.0