1
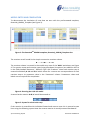
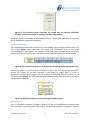
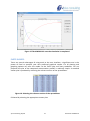
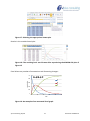
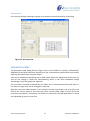
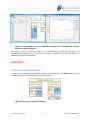
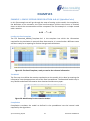
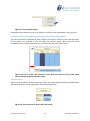
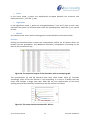
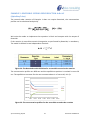
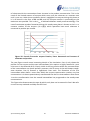
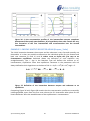
Linear In the linear mode, n_points are equidistantly arranged between the minimum and maximum times, T_min and T_max. Logarithmic In the logarithmic mode, n_points are arranged between T_min and T_max in such a way that each time point is a constant factor times the preceding time. Note that T_min cannot be zero. Manual Any arbitrary time vector with increasing points can be defined in the manual mode. Simulate Clicking the Simulate button creates the concentration profiles for all species which are written into the spreadsheet. Any additional calculation, manipulation or plotting can be done in the normal Excel way. Figure 30: The numerical output of the Simulation with an example graph The concentration [A] and [B] decrease from their initial values while [C] increases accordingly. After 50 sec the reaction is still proceeding, it is easy to re-define the time vector and simulate a longer time span. After 200 sec, the concentration of the minor starting material has essentially reached zero and the reaction is finished. 1.20E-01 1.00E-01 8.00E-02 A 6.00E-02 B C 4.00E-02 2.00E-02 0.00E+00 0.000 50.000 100.000 150.000 200.000 250.000 Figure 31: The same reaction simulated for 200 sec. Jplus Consulting Pty Ltd 21 ReactLab™ KINSIM 1.0