1
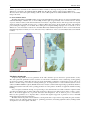
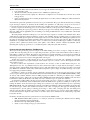
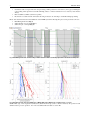
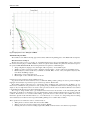
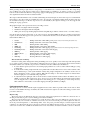
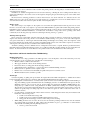
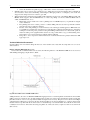
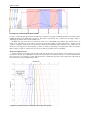
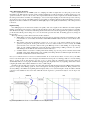
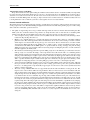
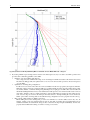
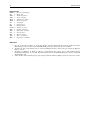
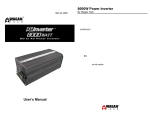
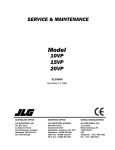
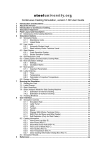
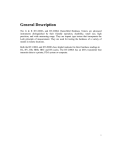
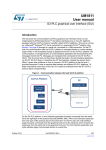
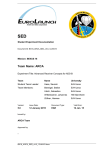
IADC/SPE 128243-PP
Case Study--Field Implementation of Automated Torque-and-Drag
Monitoring for Maari Field Development
M. Niedermayr, J. Pearse, and M. Banks, OMV New Zealand Limited; G. Thonhauser, and P. Zoellner, TDE
Thonhauser Data Engineering GmbH
Copyright 2010, IADC/SPE Drilling Conference and Exhibition
This paper was prepared for presentation at the 2010 IADC/SPE Drilling Conference and Exhibition held in New Orleans, Louisiana, USA, 2–4 February 2010.
This paper was selected for presentation by an IADC/SPE program committee following review of information contained in an abstract submitted by the author(s). Contents of the paper have not
been reviewed by the International Association of Drilling Contractors or the Society of Petroleum Engineers and are subject to correction by the author(s). The material does not necessarily reflect
any position of the International Association of Drilling Contractors or the Society of Petroleum Engineers, its officers, or members. Electronic reproduction, distribution, or storage of any part of this
paper without the written consent of the International Association of Drilling Contractors or the Society of Petroleum Engineers is prohibited. Permission to reproduce in print is restricted to an
abstract of not more than 300 words; illustrations may not be copied. The abstract must contain conspicuous acknowledgment of IADC/SPE copyright.
Abstract
This case study presents a novel approach to capturing torque and drag trends real-time while drilling complex and extended
reach wells. Data processing algorithms automatically process rig sensor data. They recognize current rig operations and log
drill string torque and drag parameters. Data is automatically collected, presented and shared without any exposure to human
error or interpretation in data recording, allowing engineered real-time and longer term decisions to be made with accurate and
consistent data. The tool relies on updated torque and drag models but otherwise works without further input or drilling
process interruptions and it does not require extra personnel on or off-site.
The main purpose of the new system is to confirm hole condition. The system acquires and displays well documented field and
operation specific drag values. On Maari this information has been used to make strategic decisions on mud systems, critical
casing runs, running strings, trajectories, accessible targets and contingency planning.
The paper outlines the monitoring process and system support. It will present actual results and detail how its use has aided
planning, drilling and logistics. Field data will be presented in support of the examples listed below.
•
•
•
•
•
•
minimized back-reaming during drilling connections and overall reduced hole cleaning efforts
real-time decisions on location, need and quantity of HWDPs or DCs in the screen running strings, avoiding rig time
to pick up tubulars from deck
confident decisions to swap from synthetic to water-based mud in hole sections that industry experts have previously
classified as ‘border line casing floatation area’
elimination of synthetic-based mud in intermediate sections, the overall environmental impact of the drilling
campaign has been drastically reduced
planning a new extended reach well based on monitoring results has allowed appraising and future production for a
satellite field otherwise likely stranded
the field application has also proven 24/7 support and maintenance of equipment far off service provider home base
The case study also outlines technical difficulties encountered and how these were addressed during product testing and its
first commercial field application.
Introduction
Maari Field
The Maari oil field was discovered in 1983. PMP 38160 is operated by OMV New Zealand Limited (69%) on behalf of its
joint venture partners Todd Maari Limited (16%), Horizon Oil International Limited (10%), and Cue Taranaki Pty Ltd (5%).
The permit contains the Maari discovery and is located close to another oil discovery, the Manaia field in block PEP 38413.
The initial development drilling campaign called for five production and three injector wells. Sixteen of the sections were
initially planned to be drilled with synthetic-based mud, partly due to the drag concerns in the highly deviated wells. In
2
IADC/SPE 128243
addition, provision was made for the construction of further 4 wells at a later stage in the project life. All these wells can be
drilled from or tied back to the wellhead platform (WHP) ‘Tiro Tiro Moana’, which is equipped with 12 drilling slots.
The waxy nature of the crude requires heating downhole, on the wellhead platform as well as the FPSO ‘Raroa’ to successfully
transport the crude.
Location and Environment
The Maari field within permit PMP 38160 is located in the Taranaki Basin offshore West Coast of the North Island in the
South Taranaki Bight of Tasman Sea, as shown in Fig. 1. Water depth is approximately 101.3 m. This location is directly
exposed to intense weather systems in the Tasman Sea and is subject to high winds and seas. The strongest and most frequent
winds and swells are generally from the west to southwest. Mean wind speed is about 35 km/h in winter; with sustained
periods during the campaign over 110 km/h. Waves during the development drilling campaign were recorded above 14 m.
Winters are cooler and weather conditions more unsettled. Mean daily minimum temperature in June is 5.5°C and mean daily
maximum temperature in January is 21.8°C. The nearest major settlement is on the coast at New Plymouth, around 120 km
northeast.
Fig. 1: Maari field location in offshore New Zealand
T&D Project Introduction
Torque and drag (T&D) are two key parameters in the well construction process that deserve special attention, as they
drive both operational optimization (such as avoidance of ‘train wrecks’, minimization of hole conditioning, avoiding picking
up extra heavy weights or drill collars from the pipe deck) and feasibility optimization of well design concepts (such as rig
selection, whether casings need friction reducing technologies, if casing floatation is needed, which trajectories can be
achieved, if SBM or WBM is required). Reliable friction factor analysis combined with drag trending is particularly critical for
inclined and extended reach wells, where operating parameters are often pushed to the limits of equipment, material and string
buckling.
As a consequence, detailed monitoring of torque and drag is a key element in the successful construction of planned wells,
as well as in modifying plans for future wells. Drag monitoring is already done in many locations and in a variety of ways.
Most of the methods applied rely on personal observation and interpretation, and are therefore prone to inconsistency.
However, these parameters are so important that a consistent and engineered approach is preferred to remove individual
interpretation and associated inconsistencies.
The Maari field development in New Zealand is a development where torque and more importantly drag data would be
critical to success in: achieving planned objectives; optimizing performance; and adding significant value by making feasible
development of some of the upside of the field.
IADC/SPE 128243
3
The factors that made Maari such an ideal candidate for a new approach in T&D monitoring were:
• Long and shallow wells
• Strict environmental constraints (reduction in use of SBM was a significant goal)
• All wells required screened completions to TD (barefoot completions were not feasible due to the risk of loose sands
being produced)
• Upside potential existed, both in extending the planned base case wells as well as in drilling into additional structures
further from the platform
To benefit from operational optimization it was necessary to provide field and office people with an automated way of tracking
torque and drag in real-time. To benefit from the feasibility and optimization of well design concepts it was necessary to
provide just the engineers in the office with an automated way of tracking and recording torque and drag data.
In order to improve the monitoring process, it was essential to make use of the rig sensor data combined with an automated
algorithm, recognizing the ongoing rig operations. This improved approach of tracking T&D in real-time was presented by
Kucs et al. (2008) after its applicability was successfully proven during an OMV field test on two 12,000 ft near vertical wells
in the Vienna basin.
The main principle behind the technique is a hook load and torque comparison of actual versus simulated values. These
actual values are captured in real-time for different operations, such as drilling, tripping or running casing, on a stand per stand
basis and automatically plotted against the measured depth of the bottom of the assembly. The resulting trend quickly shows if
the values are diverging from acceptable boundaries which could cause issues at a later stage in the trip. This early and clear
identification of potential future issues allows action to be taken before problems actually happen. Wellbore conditioning
operations can be optimized in advance based on the quality of the wellbore, which is evaluated automatically without
interfering with ongoing rig operations (i.e.: no dedicated rig time to take pick up and slack off values).
Purpose and Concept of Real-time T&D Monitoring
The torque and drag monitoring system developed for the Maari drilling project had to be kept as simple and usable as
possible. The most important goals were to acquire and present data to prevent lost and reduce hidden lost time as well as to
track wellbore condition in real-time. Presentation of the data had to be simple and intuitive to prevent incorrect assumptions
and misinterpretations due to new visualization techniques. In the beginning of the software development phase, several
different types of plots were assessed for their applicability at the rig-site.
Another clear goal was to totally automate most of the tool’s functions in a way that only a minimum of engineering
intervention and assistance was required during the well construction process as well as to remove all interpretation from the
data acquisition process.
In order to achieve these requirements, several iterations were necessary to find out which method and plot to use.
Although there were a lot of possibilities discussed, such as friction factor (FF) over depth, delta hook load plots, or tension
and torque profiles, field feedback clearly indicated a need to stick with traditional hook load and torque values versus depth
plots. While new visualization methods may enable further interpretation options, display in a familiar format proved to be the
most appropriate presentation technique.
Nevertheless, a simple tool showing only the continuously measured values for hook load and torque plotted over depth
was not an option. It was required to clearly differentiate between the T&D relevant operations RIH, POOH and ROB (rotating
off bottom) with a further distinction between drilling, tripping and wellbore conditioning for different types of tubular
assembly runs. In order to achieve this goal, the Automated Drilling Performance Measurement (ADPM) system, introduced
by Thonhauser (2004) and Thonhauser et al. (2006), was used to detect these types of operations in real-time.
As described by Zöllner (2009), the first step in the development cycle was to design new operations recognition rules
which are able to automatically detect and differentiate between the T&D relevant operations by making use of the rig sensor
readings. In addition, the hook load and torque readings are recorded for every single stand while the rig crew is performing
RIH, POOH or ROB. Out of the available data points the system filters and eliminates outliers and calculates the median value
for each stand of pipe, which is then visualized in real-time on the value over depth plot. This approach of limiting the data
was implemented to prevent getting a confusing plot showing too many values overlaying each other and making trend
analysis nearly impossible. In addition, start and end of BHA or casing runs had to be detected to allow further filtering of
recorded data and trend comparison with a certain set of friction factor curves simulated for the detailed string components
lowered into the hole.
In summary, the following states and operations had to be detected by the ADPM system:
• RIH, POOH and ROB (T&D operations) on a stand per stand basis (considering the difference between drilling,
tripping and running casing/screens/tubing)
• Hook load and torque during T&D operations
• Stands or joints of string moving up or down in the hole
4
IADC/SPE 128243
•
•
•
One filtered value of torque and hook load representing a T&D operation for each stand or joint of pipe (including the
corresponding stand depth and reasonable trimming values to exclude acceleration forces caused by static friction
effects)
Runs of tubular assemblies (start and stop times)
Hook load for a certain amount of time after the string is released out of the slips to track differential pipe sticking
Based of the automated detection and calculations of the ADMP system the following three plots can be presented to the user:
• Runs Management View (Fig. 2)
• Surface Hook Load over Depth (Fig. 3)
• Surface Torque over Depth (Fig. 4)
Fig. 2: Runs Management View – allows tracking of TxD in real-time as well as to manually adjust and create tubular assembly runs
Fig. 3: Drag plots for: left – two 12 ¼” drilling runs on Manaia ERD; right – MR1P7 lower completion run (5 ½” x 6 5/8”)
NOTE: Clear sign of hole degradation (indicated by black line in left plot) but not deemed critical by the operations team
which decided to proceed operations. 12 ¼” hole was drilled without troubles to section TD.
IADC/SPE 128243
5
Fig. 4: Torque plot for a 14 ½” drilling run on MR3P8
T&D Monitoring Workflow
The workflow for the T&D monitoring approach was clearly defined in the planning phase of the Maari field development.
Model Generation and Import
The first step in the process is to model a set of simulated friction factor curves for the BHA that is going to be lowered
into the hole. For this purpose a T&D simulation software is required which calculates the planned hook load and torque for
the operations RIH, POOH and ROB. The following information is required as a minimum input:
• String configuration (weight per foot, OD, length of all components) – Source: BHA reports
• Wellbore geometry (cased and open hole – diameters, measured depths) – Source: well reports and summary sheets
• Planned trajectory and/or actual surveys (inclination, azimuth, MD) – Source: survey and updated trajectory files
from directional drilling company
• Mud weight – Source: daily mud reports
• Block weight – Source: real-time sensor data stream
Generation of hook load reference charts (simulated curves):
To generate modeled hook load reference curves a commercial drilling software package was used to produce multipoint
tripping hook load analysis reports. These reports were then exported into Excel format.
The modeling software requires the user to enter friction factor assumptions and operation modes. At Maari a set of 5
friction factor combinations was generated for each operating mode per default. The friction factor modeling was kept very
simple as only one single friction factor was used for both open and cased hole sections. In addition, all friction was assumed
to be translated from drag into torque when rotating the string.
The concept of using real-time data to get feedback for the friction factor model relies on the understanding that well
friction factors should not be misunderstood as pure material friction but also include feedback from hole geometry and hole
condition. Both needed to be considered when making operational decisions with tortuosity data available from survey
information. Special model refinement features (i.e.: for well tortuosity or for sections of a string having friction reducing
devices attached) were neither used for long term feasibility planning nor for real-time data correlation.
Three operations were modeled for each set of 5 friction factors:
• Sliding in hole to reference slack off hook load values (RIH)
• Sliding out of hole to reference pick up hook load values (POOH)
• Rotating off bottom to reference rotating weight values (ROB) as well as reference for real-time torque analysis
6
IADC/SPE 128243
When generating running weight charts for casing strings, no centralization was considered in the models. The casing strings
used on Maari were mostly rigid type. There was no additional drag per centralizer to be added to produce a good match
between model and field data. Even for casing strings equipped with spring type centralizers the actual recorded data did not
show significant deviations from the modeled trend lines.
The output of the T&D simulator needs to include a table listing the measured depth, hook load and torque for several different
friction factors. Once these values are available they need to be pasted into a predefined template which can then be imported
into the T&D monitoring tool. All these steps need to be done manually by the engineer in charge or the 24/7 support team
tracking the ongoing operations.
The graphical output of the exported data can be seen in Figs. 3 and 4:
• RIH: blue solid (lighter with increasing FF)
• POOH: red solid (lighter with increasing FF)
• ROB: green solid (torque trending: lighter with increasing FF; drag: bold line to indicate centre – zero friction factor)
Once the models are imported and loaded on one of the screens for an imminent BHA run, there is no further user interaction
required, as the actual values appear as the operations are conducted. The list below shows the different operations that can be
tracked with the T&D tool:
•
•
•
•
•
•
•
•
•
•
POOH
POOH Rotate
RIH
RIH Rotate
POOH Trip
POOH Trip Rotate
RIH Trip
RIH Trip Rotate
ROB
ROB Trip
-
‘Pulling Out Of Hole’ while drilling (drilling: distance between hole and bit depth lass than 35 m)
‘Pulling Out Of Hole’ with rotation while drilling
‘Running In Hole’ while drilling
‘Running In Hole’ with rotation while drilling
‘Pulling Out Of Hole’ while tripping (tripping: distance between hole and bit depth larger than 35 m)
‘Pulling Out Of Hole’ with rotation while tripping
‘Running In Hole’ while tripping
‘Running In Hole’ with rotation while tripping
‘Rotating Off Bottom’ while drilling
‘Rotating Off Bottom’ while tripping
Model Calibration and Tuning
Off bottom rotating values during back-reaming and drilling were used to qualify correct model setup with static input data
(i.e.: borehole geometry and trajectory information). During the first part of casing or screen runs the drag model was checked
and calibrated. There were only three steps needed to confirm that a model is sufficiently well calibrated:
1. To ensure that the rig data system bit or shoe tracking depth parameter was set in accordance with the drill pipe, casing
or tubing tally.
2. To check that the running weight trend follows in parallel with a modeled friction factor curve. If the real-time values
follow a different slope, a unit system mismatch or faulty string weight configuration is most likely to be the reason. A
faulty configuration can also occur if couplings, ESP cable and clamps or other added weight is not included in the
effective weight per foot of individual string components.
3. To adjust the block weight input value for the model run to match actual and modeled values in the shallow section of
a BHA or casing run. This variation was never observed to be more than 5 klbs from actual block weight. In many
cases this happened due to additional weight from extra running gear (i.e.: casing fill up tool and casing elevators).
Often a shift in hook load values occurred after slipping and cutting the drill line (see Fig. 7).
Field Implementation Setup
This chapter gives an overview on all the required equipment needed on the offshore rig itself as well as in the onshore offices
in order to run the T&D monitoring tool. Further, the workflow between the engineers as well as the training procedures of the
personnel is addressed.
Rig-site Setup
The rig-site setup for the T&D monitoring approach consists of three data acquisition boxes which are connected to the onsite data provider units (rig sensor system, mud logger and directional driller).
The sensor data acquired for the system had to be exactly the same as that seen by the driller at his console. It was very
important, that only one consistent set of numbers was used by everyone involved in the project. Data acquired also had to be
free from personal interpretation, so that although shifts, crews and project personnel changed, consistent engineered data
continued to be collected. For this purpose, the data set selected for the T&D monitoring was the one of the rig sensor system
as this is the one that is also available for the driller at his console. Nevertheless, the data from all three sources is collected as
IADC/SPE 128243
7
the T&D tool can be run in combination with a real-time data plotting software, allowing analysis of additional data sources if
a diverging trend is detected.
In addition, two database and application servers are located at the rig, collecting the sensor readings from the data boxes,
storing and replicating it to the onshore servers for the engineers and giving the personnel at the rig access to the results via the
T&D screens.
Hook load trends overlaying predictions at various friction factors were shown real-time on a dedicated screen to the
drilling supervisor at the rig-site, but the project team decided not to install such a screen for the driller. Instead ‘do not
exceed’ hook load values were issued as a print-out table on the string tally sheet.
Onshore Setup
The onshore setup is very simple as it only requires one server where the replicated data from the rig-site server is stored.
In order to access the results, every engineer is provided with a T&D installation together with real-time data plotting software.
If installed on a laptop, the operations can be tracked in real-time from all over the world via a secured internet connection. In
addition to all these individual installations, one multi-screen environment is setup in the remote operating center which
continuously shows the drag and torque trend curves allowing monitoring of the rigs’ operations.
Training and People Issues
Prior to being used operationally on the first well, only the office personnel was trained to varying levels as required. One
engineer was selected as the focal point who received full and detailed training over a period of one week. Other engineers
were given an introductory ‘run through’ rather than full training. In hindsight, more training of the other engineers would
have been beneficial. Once all the office personnel were familiar with the system, each of the offshore supervisors was trained
at the rig-site to the extent necessary to benefit from the real-time data plots.
Another key training point was to eliminate the use of interpretive terms such as ‘overpull’, which are prevalent and can be
misleading. Instead of traditional instructions such as ‘do not pull more than 30k overpull’, instructions were issued phrased as
follows: ‘hook load should not exceed 30 klbs above the predicted value on the 0.2 friction factor line at that depth’.
Expectations and Results from Real-time T&D Monitoring
Optimized Operations
On Maari, there was a large potential for the T&D approach to assist in all phases of the well construction process. By
actively using the tool, the expectation was to benefit from several advantages:
• Monitor wellbore condition and hole friction
• Time, apply and monitor effect of hole cleaning measures
• Prevent lost time by avoiding pack-off and stuck pipe situations
• Adjust running string configuration to overcome drag and avoid helical buckling as needed
• Plan trajectories to optimize reach of completion runs
• Pick the most economic and environmentally acceptable mud system for each hole section
• Minimize hidden lost time as much as possible
Well Design
Consistent capturing of quality pick up and slack off weights allowed the Maari well planners to calibrate the modeled
hook load and drag charts in the best possible way. This benefited the Maari field development as follows:
• Original plans considered the use of oil-based mud systems in 16 hole sections. Through engineered understanding of
drag, and a drilling sequence which allowed the most challenging sections to be drilled latest in the project, this was
ultimately reduced to only 5 reservoir sections. Sections which were changed from SBM to WBM included 9 5/8”
casing runs up to 3,000 m at max. 75deg inclination. On Maari synthetic-based cuttings were loaded in skips and
shipped ashore for disposal in a land farm. Being able to revert back to water-based mud systems on large 14 ½” hole
sections has greatly improved cuttings disposal cost and offshore logistics as well as reduced the risk of wait on
weather down time.
• Good knowledge of actual hole friction factors allowed refocus of risk management efforts away from what the team
has labeled ‘excessive drag events’:
Unable to run intermediate casing to TD
Unable to run screens to TD and set ESP in planned tangent sections
String pack-off and stuck pipe events associated with poor hole cleaning
• While drilling the first reservoir section, the reservoir hole exited the producing formation and a low side sidetrack
was required. Pick up and slack off values gathered from the T&D tool gave a good indication of current friction
values and allowed making real-time planning decisions on:
where to position the side track
8
IADC/SPE 128243
•
•
what is the maximum acceptable dog leg to still be able to run the screened liner completion to TD.
Similarly, later reservoir sections were extended by up to 800m and screen runs and running string configurations
were modeled to ensure successful landing of liner hangers. Although possible as a contingency, none of the wire
wrapped screen strings needed to be rotated to get to TD.
Well documented drag information from Maari enabled planning and approval of the Manaia ERD appraisal well
MN1P4, which at approx. 8km and MD/TVD ratio of 4 was a step change over the most ambitious Maari wells of
4.8km, and MD/TVD ratio of 3.7:
Maari friction factor results were used as planning basis for MN1P4 trajectory, in particular its tangent
section inclination.
The planning team was in a better position to evaluate drilling risks and associated operational downtime
caused by hole drag or stuck pipe situations.
Because of the short planning to execution interval, some technologies usually applied on ERD wells were
not available. For example the long lead time for casing floatation equipment prohibited the use of floatation
technique to run the long 9 5/8” production casing. The drilling team decided to move ahead with operations
instead of waiting on the equipment. This decision was only possible with a very good understanding of the
friction factors to be expected and an accordingly designed well path.
Being able to assess expected downtime risks based on well documented data greatly benefited the AFE
approval process.
Technical Difficulties Encountered
Several problems were encountered during the first tests on the real-time sensor data. The most important ones to note are
addressed below.
Pick Up and Slack Off Weight Cross-over
For several wells on which the T&D tool was tested, the following behavior of the POOH and RIH curves was observed
while drilling and tripping at depths below 1,500 m:
Fig. 5: Hook load intersection of POOH and RIH curves
As Fig. 5 indicates, the curves for POOH and RIH while tripping intersect at a certain depth below which the hook load while
pulling out is lower compared to the one while running in hole. As this is in contrast to the physical laws and also because this
phenomenon did not occur on every trip tracked, further investigation was necessary. The plot of sensor data shown in Fig. 6
verified that this problem was not caused by the drag monitoring filters, its hook load calculations or operations detection but
that there must be a problem with the hook load sensor or measurement process itself. It further shows that the hook load was
constantly lower for the two times where the string was pulled out of hole (red section) compared to where it was run in hole
(blue section).
IADC/SPE 128243
9
Fig. 6: Higher hook load while RIH compared to POOH
In order to address this data phenomenon and make trend comparisons possible, an additional parameter was included in the
ADPM algorithm for the T&D related operations. This allows compensating such a phenomenon by simply adding or
subtracting a predefined value from the calculated one.
On Maari, this approach worked very well as the effect was not detrimental in the shallow, near vertical sections. In
deeper, more critical sections it also did not adversely affect the interpretation of results with regards to analysis of hole
condition or matching of friction factor models. In near vertical boreholes with little drag contribution to the overall hook load,
this may become a bigger issue. The main purpose of the tool, namely to track changes in ongoing trends, will not be affected.
However direct comparison of friction factors from various wells / rigs will become more unreliable.
Hook Load Calibration Issue
Another calibration issue which became clearly visible with the drag plot is shown in Fig. 7 below. Whenever a trip was
interrupted to slip and cut the drilling line, the actual hook load values were shifted from the 0.3 to the 0.2 simulated friction
factor trend curves once tripping proceeded. This phenomenon confirmed the approach of monitoring trends with deviations
thereof instead of relying on single absolute values.
Fig. 7: Hook load shift after slip and cut drilling line and change swivel packing
10
IADC/SPE 128243
Source Data Update Frequency
One key requirement for the ADPM system is a sampling rate which is higher than one data point per ten seconds.
Nevertheless, the T&D relevant operations require a higher sampling rate for which a frequency of 1Hz is preferred. As some
operations can last for only 15 to 20 seconds, a more representative amount of data is required for the median calculation of
the stand per stand values. Generally, it is challenging to receive such a high sampling rate from the data providers at the rigsite. As the rig sensor system on the Maari offshore rig was capable of streaming 1 Hz data, it allowed the T&D tool to have a
high amount of values available for the calculations which highly improved the quality and authenticity of the values presented
to the users.
Depth Tracking
One challenging issue encountered was related to the quality of the sensor signals for the channels hole and bit depth. Bit
tracking on standard rig data systems is a derived value from block position. The system uses a hook load trigger to determine
if the block travels empty or if it has the actual string attached. If hook load exceeds the trigger limit, bit position is changed as
per the measured block position change. As soon as hook load drops below that value, bit tracking ignores any changes in
block position.
The torque and drag system is affected adversely in three situations:
a) While pulling out of hole, the string weight drops below the hook load trigger whereupon bit tracking stops. This
is not critical as it occurs usually around 100 to 300m MD with BHA in safe hole and no adverse affects on the
T&D tool.
b) After running casing the last tracked bit position is at or very close to the current well TD. As the next rig
operation is a trip in hole, the bit position needs to be reset to surface. If this is not done correctly, the ADPM
system assumes a bit on bottom condition and logs the BHA trip in hole as slide drilling. As torque and drag
values are only calculated while being off bottom (tripping, reaming during a drilling connection, etc.) and not
while making hole, the T&D model is rendered useless in such cases.
c) A similar situation occurs after a roundtrip when the bit tracking stops at a bit position somewhere between 100
and 300m of hole depth. When running a new assembly, bit tracking will start at a different depth and results in a
mismatch of actual and modeled hook load values.
Case a) is not critical and does not need to be addressed further. To avoid the adverse affects of cases b) and c), the driller
needs to reset the bit depth to zero after a casing has been landed and set bit position to match pipe tally as soon as bit tracking
starts to operate on trip in hole. If this is not done or set to a wrong value, the calculated torque and drag values are
automatically linked to a wrong depth. On Maari, this happened quite frequently in the very beginning, which did not allow
comparing the actual values with the simulated ones due to a shift in depth.
In addition, the hole depth was set back to the same depth as the bit while tripping into the hole (Fig. 8). This caused the
system to wrongly detect drilling operations as the hole depth was increasing together with the bit. These problems were
solved by talking to the drillers and explaining them the impact if they do not set their bit depth correctly. In addition, manual
corrections and recalculations have been made which allowed the engineers to perform their analysis once the trip in was
finished.
Fig. 8: Interrupted RIH curve for a 5 ½” screen run due to incorrect depth tracking
IADC/SPE 128243
11
Automatic Detection of Casing Runs
The problem with the incorrect depth tracking also influenced the automatic detection of tubular assembly runs. Especially
for casing runs where the bit depth channel was not reset prior to the subsequent trip in, the ADPM rule was not always able to
detect the correct start and end of the run. In such cases it was necessary for the users to manually create a run or adjust the
boundaries in the Runs Management View (Fig. 2). Improvements for the automated detection of tubular assembly runs need
to be implemented in order to make the system more robust against errors in sensor data channels.
Lessons Learned and Results
The benefit gained from automated real-time capturing of actual values and comparison with modeled hook load and torque
can be grouped in two areas. The Maari drilling campaign has benefited from both the future planning aspects as well as being
able to make more immediate operations decisions:
1.
The quality of drag trending curves and good match with drag models showed lower friction values than anticipated. The
T&D system also documented effective drag reduction by simple measures such as short intervals of circulating while
running casing. This allowed the drilling team to take a more aggressive approach to well operations and design:
• As a consequence it was possible to switch over from synthetic-based to water-based mud systems, allowing a drastic
reduction in skip and ship effort and cost.
• Manaia 1 was originally planned as a vertical well situated approximately 7km south-west of the Maari wellhead
platform location. The vertical appraisal well was cancelled due to the excessive risk of waiting on weather downtime
which might be encountered while moving the rig to the new location. The low friction factors encountered while
developing the Maari field allowed the drilling team to submit a plan to appraise the Manaia structure with an
extended reach well drilled from the WHP. Queries on operational risk due to drag, stuck pipe and pack-off during
drilling and casing runs were adequately addressed by basing designs and mitigating measures on well documented
field data supplied by the T&D system.
• The extended reach well design pushed the expected drilling torque above the drill string’s recommended connection
make up torque. Good accurate knowledge of the torque friction factors allowed the well to be confidently planned
with a relatively simple torque management approach, rather than the un-engineered, drastic, and costly approach of
changing out the drill string for a higher torque connection. The relatively simple approach taken was the use of high
friction dope which allowed the drilling team to increase the recommended make up torque and therefore be able to
drill to a possible maximum depth of 8,500 m. This depth was nominated by the geologists as the ultimate possible
well length. As a mitigating measure, non-rotating drill pipe protectors were run to counter high torque risks.
• As lesson learned from Manaia, the highest torque observed was while drilling out the cement in the casing. Although
the torque was below the rated operating torque as well as rotating speed for the top drive, this operation resulted in
the motor to be damaged. The torque drastically dropped again once the rust was removed and synthetic-based mud
cuttings coated the casing wall.
• The 9 5/8” casing on Manaia ERD was set at approximately 6,340 m with an inclination of 88deg at the shoe. The
tangent section of the well was drilled at 77deg inclination. Based on friction factors seen for the Maari wells, this
angle would just allow casing running. Any higher inclination than this would have resulted in gradual loss in running
weight. If drag increased, the drilling crew was supposed to circulate through the fill up and circulation tool (FACtool) which had been shown to drastically drop the drag values in Maari wells. The lower part of the well trajectory
had increased hole angles of 85deg in the geological landing tangent and built to horizontal in the reservoir. Overall
the casing run was executed as per plan with increased drag only observed in the lower build and hold section which
required setting almost all casing weight down. The string was tensioned with 100 klbs overpull followed by bumping
the string down which established movement (black circle in Fig. 9). If the inclination in the tangent section had been
larger, all the running weight would have been lost prior to reaching TD, whereas a smaller angle would have resulted
in excessive drag in the lower section. The T&D tool captured this significant difference between start up friction
versus recorded slack off friction. Fig. 9 below shows the actual values for RIH Trip (average hook load value for
each joint) and RIH Trip Min (minimum value recorded over a joint) compared to the simulated curves for this 9 5/8”
casing run.
12
IADC/SPE 128243
Fig. 9: Actual values for RIH Trip and RIH Trip Min over simulated curves for Manaia ERD 9 5/8” casing run
2.
By creating reliable torque and drag reference charts for the field supervisors, they were able to streamline operations and
give clear hole conditioning guidelines to the driller:
• Definition of hook load limits while tripping:
Once a drag trend was established for a trip, a hook load margin of 30 klbs was added to this friction factor trend
line. Then the drill pipe tally was updated with ‘do not exceed’ hook load values per stand connection and passed
on to the driller.
• Optimization of running string configurations:
For all screens to be lowered into the hole, hook load simulation models were prepared by the engineers. Then the
limit friction factor trend curve causing the drill pipe to buckle helically anywhere along the running string profile
was defined. Further, a stiffened running string including heavy-weight pipe and drill collars was remodeled. If
the helical buckling limit friction factor was identified, the field supervisors were informed with a basic hook load
drag chart to identify as early as possible if and when to pick up additional heavy-weight pipe and collars. In cases
were excessive drag was observed, the field personnel was advised to interrupt running the screens and discuss
further options with town. Drag charts for the stiffened string configuration were also prepared and sent to the rig.
• Improvement of back-reaming on drilling connections:
While drilling ahead, hole cleaning time per stand was minimized to ream the drilled section only once. In
addition, reaming cycles were initiated when the pick up and slack off weights diverged significantly from an
established trend line. Towards TD the string was also rotated into the slips if required. Ultimately, the hole was
properly cleaned while back-reaming out of hole for casing or screen runs.
IADC/SPE 128243
13
The figure below (Fig. 10) shows the improvements made on drilling connections for the Maari field
development. It plots the average time that was spent on treating the borehole (reaming, washing, circulating)
while making a drilling connection for the Maari well sequence.
Fig. 10: Average wellbore treatment time (reaming, washing, circulating) while making a drilling connection for the Maari wells
Conclusions
The following conclusion can be summarized:
• Utilizing this concept a total of 43.5km (142,700 ft) of hole were drilled without stuck pipe or pack-offs, although a
total of 11 hole sections where switched from a SBM to a WBM system.
• Based on the concept discussed in this paper, significant drilling efficiency improvements were achieved, which
could be quantified.
• It was possible to develop a software tool to support the drilling crew with automated torque and drag monitoring
information in real-time. A key element for the success was the early inclusion of feedback from rig personnel in the
development and the extensive field testing of the system prior to its use for this project.
• New workflows for the rig crew, as well as the supporting engineers, had to be developed to utilize the new tool to its
maximum potential. The traditional way of using hook load overpull as alarm value was replaced by a concept using
‘overpull not exceeding 30 klbs above predicted value on the 0.2 friction factor line’.
• Training played a key role in changing and adopting the workflows of the team.
• Based on the experience gained, a number of future improvements will further enhance the tools and workflows
developed, such as user interface improvements and optimization of system setup.
• Future enhancements are also expected from an improved way of displaying relevant data.
Acknowledgments
The authors would like to thank:
• OMV and TDE for the permission to publish this paper and would like to recognize Mr. Hermann Spörker and Mr.
Richard Kucs, both OMV, for their valuable input and support for this work, particularly in the development and
testing phase of the system.
• ENSCO 107 management and crew for their support during rig up and system configuration as well as
implementation.
• MD-Totco technical support in enabling a 1Hz data update link from the rig data system.
• BHI and Halliburton Sperry for providing an uplink of critical down-hole data.
• OMV offshore supervisors for providing useful feedback and their open-minded acceptance of some trial and error
experiments in optimizing the system in the best possible way.
14
IADC/SPE 128243
Nomenclature
HWDP = Heavy-weight drill pipe
DC
= Drill collar
WHP = Wellhead platform
T&D = Torque and drag
SBM = Synthetic-based mud
WBM = Water-based mud
TD
= Total depth
FF
= Friction factor
RIH
= Running in hole
POOH = Pulling out of hole
ROB = Rotating off bottom
BHA = Bottom hole assembly
OD
= Outer diameter
MD
= Measured depth
TVD = True vertical depth
ERD = Extended reach drilling
References
1.
2.
3.
4.
Kucs, R., Spörker, H.F., Thonhauser, G., and Zoellner, P. 2008. Automated Real Time Hookload and Torque Monitoring. Paper
SPE 112565 prepared for presentation at the IADC/SPE Drilling Conference, Orlando, Florida, USA, 4-6 March.
Thonhauser G. 2004. Using Real-time Data for Automated Drilling Performance Analysis. European Oil and Gas Magazine,
Edition 4: 170-173.
Thonhauser, G., Wallnoefer, G., Mathis, W. 2006. Use of Real-Time Rig Sensor Data to Improve Daily Drilling Reporting,
Benchmarking and Planning - A Case Study. Paper SPE 99880 presented at the SPE Intelligent Energy Conference, Amsterdam.
The Netherlands, April.
Zöllner, P. 2009. Automated Monitoring of Torque and Drag in Real-time. MS thesis, Mining University Leoben, Leoben, Austria.