1
8.2 – Positioning the marker on the diagram
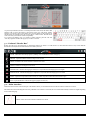
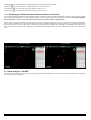
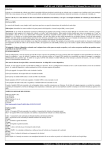
The marker can be placed on the diagram in two ways:
Selecting a point on the diagram: in this case the marker will be white, as well as the box indicating the time/space at the bottom of the screen, and
the cursor will appear on the map on the right (or more than one cursor if more laps are selected, as in this case) on the point the marker on the diagram
refers to.
Selecting a point on the map: in this case, the cursors on the map will be placed on the selected point, the marker (or markers if more laps are
selected) will be placed on the point the cursor on the diagram refers to and will be of the same colour as the lap, as well as the time/space box at the
bottom (if there are more laps there will be more than one box).
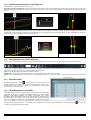
8.3 – Changing the base of the diagrams
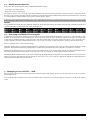
You can choose to view the diagrams based on space or time through the drop-down list on the Header Bar when entering the CHARTS section:
You can choose to view the diagrams based on space or time through the drop-down list on the Header Bar when entering the DIAGRAMS section:
By clicking on the drop-down list you can select one of the following options:
Time: to view the diagrams based on the time which has passed
Speed GPS: views the diagrams based on the distance covered measured by the GPS (always available)
Speed 1: views the diagrams based on the distance covered measured by Speed 1 (it is necessary to have a speed signal connected to the Box Expander
2)
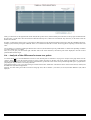
8.4 – Min/Max table
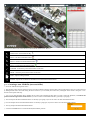
By clicking the “Min-Max” button
on the “Header Bar” you can access the table
that show all the minimum and maximum values detected during the entire session.
The table allows you to detect at a glance any abnormalities as a high engine
temperature or too high engine revs.
8.5 – Stoichiometric ratio table
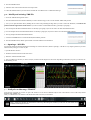
The stoichiometric ratio table (air/fuel ratio) is an important tool for the optimal
carburation of the vehicle. Through this configurable table it is possible to input
different engine RPM (revolutions per minute) and throttle valve opening
thresholds, thereby obtaining the exact air/fuel ratio detected in a specific range by
the lambda probe. ECU (engine control unit) management software applications
often work with different ranges, that’s why being able to set different values on the
X and Y axis enables you to have a table comparable to the one in your engine
management software and, therefore, to be quicker in the modifications. You can access the stoichiometric table by pressing the
“Header Bar”. The following table will appear:
button on the
PZRacing Via de Gasperi 5 – 61032 Fano (PU) Italy - Tel: +39 0721 820434 – Email: [email protected]