1
Chapter 7: Plotting: The Basics
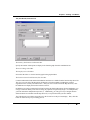
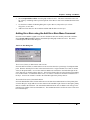
To complete the editing process, click the Apply or OK button.
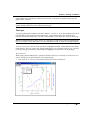
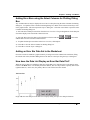
Plotting a Function into a Function Graph Window
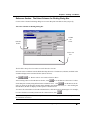
To plot a function into a graph window with added function controls, click the New Function button
on the Standard toolbar. This action opens a Functionn graph window as well as the Function tab of the
Plot Details dialog box. For information on defining your function in the (Plot Details) Function tab, see
"Plotting a Function into a Graph Window" on page 170.
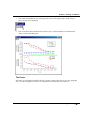
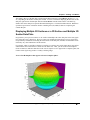
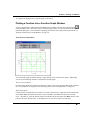
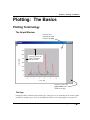
The Function Graph Window
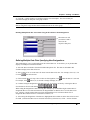
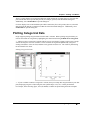
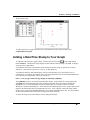
You can edit this graph by double-clicking or right-clicking on any elements in the graph. Additionally,
you can use the following controls to customize the function graph.
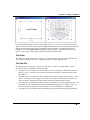
The New Function Button
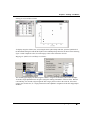
Click this button to add a new function graph to the window. This action opens the (Plot Details) Function
tab. For information on using this tab, see "Plotting a Function into a Graph Window" on page 170.
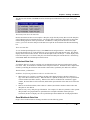
The Rename Button
Click this button to rename the active function. To make a function active, right-click on the function and
select Set as Active from the shortcut menu. If the command is unavailable, the function is currently
active. Alternatively, select the desired function from the data list at the bottom of the Data menu or at the
bottom of the layer shortcut menu. A check displays next to the active function (or data plot).
Plotting Functions • 172