1
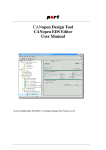
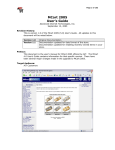
USER MANUAL OF LPLW.EXE Tony Hürlimann [email protected] Version 6.30 1 Starting LPLW lplw can be started just by clicking on its icon ( lplw.exe). By default the model alloy.lpl is opened. An alternative to open lplw is to drag and drop an LPL-modelfile on to the executable lplw.exe in which case the corresponding LPL model is loaded. In Figure 1 the model alloy.lpl was opened by lplw.exe). Figure 1: Model alloy.lpl is opened Exercice 1: Open lplw.exe with model alloy.lpl : On the file explorer drag the file alloy.lpl to the file lplw.exe then drop it. The menu item <File/New Model> also generates an empty LPL desktop; a model can also be opened through the menu item <File/Open Model>. Exercice 2: Open alloy.lpl from the Open menu item: In the menu click <File/New Model> (an empty model is opened). Now click <File/Open Model> and open alloy.lpl. 2 Main Structure The LPL desktop consists of 2 (1) The quick access button bar at the top (all functions are found in the menus too). This toolbar can be dragged off from the top: (2) The Inspector (the left part of the window): lists the model entities in a tree view and the files in a list box, (3) The Browser (the right part of the window (displays various views of the model elements). The slider in the middle can be moved to the right and to the left. Exercice 1: Click repeatedly on : The Inspector is alternatively hidden and shown, while the Browser is alternatively expanded and shrunk. The Inspector contains the three tabs: (1) Tree : It displays all (selected) entities of the model in a hierachical way. (2) List : It displays all entities of the model in a linear list and alphabethically sorted. (3) Files : It lists all files involved in the model. Opening a model directly generates a Tree-view of all entities defined in the model in the Tree tab. The same list of entities is found in Tab List. The Tab Files shows a list of all files involved in the model specification (actually there are two entries: alloy.lpl and cfglpl.lpl). At the top of the Inspector, a list of buttons ( selects/unselects various entities shown in the tree. …… ) is placed. These buttons Exercice 2: Click repeatedly on in the Inspector: The Tree view collapses/expands. Now click repeatedly on : the Tree expands/collapses with the Set entities. Repeat this with the other buttons. The Browser contains a variable number of tabs depending of how many files are open for editing. The first permanent tabs are : (1) ENTITY: It displays the information (found in the model source code) of a specific entity of the model. (2) TABLE: It displays the values of a (multi-dimensional) entity in tabular (grid) form, as a pivot table. (3) GRAPH: It displays a graphcal view of the relations between the model entities (not shown in the Free Package). (4) INSTANCE: It displays a graphical view of the relations between single model objects (not shown in the Free Package). 3 (5) DRAW: It displays the results of the models in a picture form (not shown in the Free Package). (6) SerachFiles: It displays all occurrences of an identifier in all source files. (7) LOG: It lists the messages and diagnostic text after a model run. (8) alloy.lpl : It shows the main source code file of the model which is editable (here the alloy.lpl file). (9) … More Tabs: They display more editable files if opened. Exercice 3: Double-click the entry AMOUNT (X) within the Tab Tree (on the left): The cursor in the editor Tab alloy.lpl jumps to the definition of AMOUNT in the source file. Double-click on various Entries in the Tree: each time the cursor jumps in the source code to the specific definition. Exercice 4: Click on the Tab Files in the Inspector, then click the file entry lplcfg.lpl: The file lplcfg.lpl is open in a new tab in the Browser (right part with new tab lplcfg.lpl). Exercice 5: Click on at the top on the Inspector (make sure that the six parameters of the model are listed in the Tree). Now click on 0 bound, and finally click the TABLE tab. Figure 1a appears. You will see the 6 values of the parameter called bound. Compare these values with the values defined within the model source on switching back and forth between the TABLE and the alloy.lpl tab. Figure 1a: The table for bound The Tab TABLE on the right is automatically oppened and the table bound appears. 3 Running the model Till now, we have done just some browsing manipulations. We now want to run the model. Click the Run button . The results of the run are written by default to a new file alloy.nom which is opened on a new tab in the Browser automatically after running. 4 Exercice 1: Run the model by clicking in the Toolbar at the top: The model is run and solved (if the solver has been configured correctly), a new tab open in the Browser (alloy.nom) which displays the solution. The resulting LPL window after the previous exercise is shown in Figure 2. If the resulting screen is not as shown in Figure 2, then something went wrong with the solver. In this case go to the lplcfg.lpl tab, which will open the lplcfg.lpl file in an editor, go at the end of the editor by scrolling down until the end of the file. Now make sure that the line OPTION solver := lplSol; --this is the solver which is active now is the last active instruction. (All lines following it, must be comments, that means, they begin with two dashes. If it is not the case, add them. This makes LPL’s internal linear solver active.) Then run the model again by clicking again. LPL will ask you to save the lplcfg.lpl file first, since you have modified it. Click OK to save. Figure 2: After a model run 4 Viewing the Tables Besides of the model results in tab alloy.nom which only reflects the WRITE instructions within the model source, one can see all data and variables in tabular form. Clicking in the tree view on different items (Ordered, Robots, etc. displays the corresponding table. Exercice 1: Click on the TABLE tab, now click the Tree tab, then click in the list on the entry 0 bound once again: You should see the Window as shown in Figure 3. Figure 3: Open the Table “bound” 5 The first line (see Figure 4 on the left) in the grid table displays the index over which bound is defined: it is “o” (ores). The next cell is the name of the entity “bound”. The second line displays the list of all elements of the set ores (“ore1”, “ore2”, … , “ore6”). Right below in the second line the corresponding values are displayed. Figure 4: Open the Table “bound” Exercice 2: Within the table “bound” click on the cell bound: You should see the Figure 4 (on the right). Click again on bound. The table switches from a horizontal to a vertical view and vice versa. Clicking on the cell “bound” within the table displays the vector vertically. You can switch between horizontally and vertically display by clicking repeatedly on the same cell. One-dimensional tables are simple: They only can be displayed as a horizontal or vertical vector list. Let us see what happens with higher dimensional tables. Exercice 3: click on the entry 0 obtain: You will see one of the three layouts in Figure 5. Clicking on the cell obtain will generate these three layouts one after the other. In the first layout both indexes (“ores” and “metals”) are listed vertically, clicking once on the cell obtain will switch the last index m (“metals”) horizontally and we get a matrix view. Another click on cell obtain switches the first index o (“ores”) also in a horizontal view. And we can go through these steps repeatedly. Clicking on the cell obtain and dragging the mouse left will go through these steps in an inverse way. 6 Figure 5: Three different layouts of the table “obtain” Note that the table are layout on a sparsity mode, that is, if a column or a row has no data (or all are zero) then these columns/rows are eliminated form the view. To see the complete data table, right click the mouse within the table and popup menu opened where one can Format the table in many respects. By default, the repeated elements of the indexes are not shown. The check box “Index” is to switch all elements to be displayed (this is important, if the table must be exported to an Excel worksheet for example, see below.) Another option in the table is to define the sequence of the indexes. Figure 6: Switching indexes This can be done by the following exercise. Exercice 4: Click on the cell m (metals) and drag it to the cell o (ores): The effect is that the two indexes are exchanged and the whole table is transposed (columns become row and vice versa). Of course, this can be combined with the previous layouts by clicking repeatedly on the cell obtain. For two-dimensional table, these manipulations generate 6 different layouts of the table. If the tables are of higher dimensions then one can generate even more layouts. Any permutation of the indexes combined with any number of vertical/horizontal layout is possible. (This gives 24*4=96 layouts for a 4-dimensional table, for example.) 7 Another possibility is to “project on” one or several indexes: Click on the cell metals and drag it up outside of the table. The result is shown in Figure 7: The index metals is dimmed and the projection is done on metals, that is, all numbers are summed up over the index metals. To remove the projection just click the projected index and drag it down to the next line in the table. Figure 7: Projection on metals Exercice 5: Click on the cell metals and drag it up outside the table, then click again on the dimmed cell metals and drag it down to the next line within the table. The effect is that the dimension metals disappears and reappears again. Another layout is to show vertical and horizontal “aggregates” on each index. Open the context menu by right clicking the mouse within the table (popup menu). Figure 8: Context menu of the table Click on “Aggreg. Operator” and choose “SUM” the result is shown in Figure 9. Figure 9: Added SUM aggregates to the table One can conbine all these operations to obtain various layouts of the table. Using the “Format…” menu item, one can customize the table with colors and fonts. 8 One can also export a table to Excel: Exercice 6: Export a table layout to Excel: Right-click the mouse within in the table. A popup menu appears: choose “Save Table to clipboard”. Then open Excel and paste the table in a Worksheet in Excel. The two other popup entries generate a file on disk: grid.txt: a tabulated text grid and grid.tex: a table in LaTeX format. Another option is to select elements from a set list. Exercice 7: Selection: Left-click the mouse on top left-most cell ores. A popup menu appears with the list of elements of ores (Figure 10). Click the checkbox ore1 then click the check box SELECT INVERSE. Then click outside the pop-up. A sub-table of obtain opens as shown in Figure 11. Figure 10: Added SUM aggregates to the table Figure 11: A subtabe of table obtain 9 5 Searching and Selecting Views LPLW contains several ways of searching entities, jumping around in the model and selecting different parts of the model. In the Tree tab, one can select or deselect different types of entities as we have seen already. Clicking on will show/hide the parameter entities, clicking on will hide/show the constraint entities, clicking on will show/hide all declaration entities. By default, at the beginning all declaration entities are shown. If the name of an entity is searched, the user enters the name in the Find/Search-box within the Toolbar and types the name. Then pressing the key <return>, the cursor jumps to the entity within the Tree. An Alias-name defined for an entity is also found in this way. Exercice 1: Searching “AMOUNT” Click the TABLE tab. Then click the Find/Search box, and type “AMOUNT” (The cursor jumps to the AMOUNT table. Double clicking the entry AMOUNT (X) lets the cursor jump to the definition in the source code as we have seen already. Another way to find all occurrences of “AMOUNT” in the all source files is to use the button or clicking on or the menu <Search>. Exercice 2: Searching “AMOUNT” in all source files: Click the Find/Search box, and type “AMOUNT”, then click the button cursor open the tab SearchFiles (Figure 12). . The In the list of the SearchFiles tab all occurrences of AMOUNT are shown, line by line. Clicking once on a line let’s the cursor jump to the line in the source code. Closed files are automatically opened in a new tab in the Browser. The search is a substring search. And in the menu Search, one can choose of whether only whole words are search or whether case sensitivity matters or not. Figure 12: Search “AMOUNT” in all source files Figure 12 shows that “AMOUNT” (or “X”) is found 5 times in the source code all in file alloy.lpl. This searching capability is of particular interest when the model is large and complex and built on many files. Another way to search and replace strings in a single file is to activate the popup menu within an editor by right clicking the mouse in the source file editor (Figure 13). 10 The menu allows the user to search/replace text within a particular file. It also allows the user to open / close / save / etc. a edited text or to select the font and other options for the editor. If a user works with another editor, then the “Reload”-menu item can be used to reload the file from disk. Here is also the menu item to encrypt or decrypt the lpl source code. After clicking the en/decrypt item, the user must enter a password and the file is immediately en/decrypted. All entries in the popup menu are also found in the different main menus. Exercice 3: Searching “AMOUNT” in file “alloy.lpl”: Click the alloy.lpl tab to display the source code, and right-click the mouse within the editor, choose the popup menu item Find. A find dialog opens where the string “AMOUNT” is to be entered, then click ok. The cursor jumps to the next occurrence within this single file. Figure 13: Popup menu in the editor by right clicking the mouse Another way to select and display entities in the Tree tab can be obtained by the popup menu within the Tree itself. Right clicking the mouse in the Tree will open it, where the user can expand / shrink the tree (see Figure 14). This feature is interesting if the model is complex and consists of several hierachical levels of models and submodels. 11 Figure 14: Popup menu in the Tree by right clicking the mouse “Save To file” generates a file tree.txt consisting of the tree entries. 6 Options Options and parameters can be entered by the “LPL Options” window (Figure 15). 12 Figure 15: The Option dialog The option dialog is open by using the menu item <Tools/Options>. The dialog has five tabs: Compiler where the compiler options can be chosen, Environment, Solvers, Format, and Snapshots. The different compiler options correspond to the compiler options described in the reference manual. The user enters a string consisting of all chosen options. For example, if one wants to run the model without solving it, but nevertheless creating a MPS-file, one could use “cm” as option. At the bottom, APL parameters can be added, they are effective for the next run. The tab Environment actually just shows the directory list. This list is used in all file search routines by LPL. A file lookup traverses this list until it finds an entry on the disk. Another useful option is to choose how the Database has to be created (only in the Enterprise Package). The tab Solvers is reserved for future use and has no function in the present version. The tab Format is for formatting tables as explained above. The tab Snapshots is useful when loading various snapshots (even multiple once). 7 Advanced functions (not in the Free Package) Depemding on the package, several tabs and menu items are not available. In the Enterprise Package all buttons are visible and accessible. Clicking the GRAPH tab opens a graphical view of the model. It shows the dependences of the different entities (Figure 16). Moving the mouse over a box displays the dependencies of that particular entity. 13 Figure 18: The Dependencies of “AMOUNT” The graph shows that “AMOUNT” depends on “bound” and ”ores” (nodes on the left), but on thze other hand other entities depend on “AMOUNT” (the nodes on the right). Exercice 1: “GRAPH”: Click on tab GRAPH. Within the Tree click on entry AMOUNT (X). The graph as displayed in Figure 18 appears. Move the mouse pointer over the box “metreq”. Now the dependencies of “metreq” appear. Click on this box “metreq”. The focus is now “metreq” (see Figure 19). Figure 19: The Dependencies of “metreq” 14 The graph can also be copied to the clipboard by right-clicking the mouse. The graph can also be moved by drag and drop just press down the left mouse button and drag. The different checkboxes on the top of the graph can be used to select various dependencies. The fourth tab is INSTANCE. A model instance must exist before anything can be shown, that is, the model must have been run. The INSTANCE tab shows the graphical dependencies between the variables and the constraints in the same way as the GRAPH, but on an instantiated level (Figure 20). Figure 20: The Dependencies of “AMOUNT[ore1]” Figure 20, for example, shows the variable [AMOUNT[ore1], the first instance of “AMOUNT”, and displays the constraints in which this variable occurs. The variable box displays also four values: the upper and lower bound of the variable (on the left), the value and the dual value (on the right). Furthermore a larger line above or below shows that the value of the variable is on the upper or on the lower bound. The constraint boxes also display four values: the right.hand side and the left-hand side value of the constraint (on the left), the relational operator and the reduced price (on the right). Moving the mouse over a constraint box (p.e. metreq[D]) displays their dependencies and displays all variables that occur in this constraint. Clicking on the constaint box makes it the focus (Figure 21). 15 Figure 21: The Dependencies of “metreq[D]” Figure 21 shows the variable that occur in the constraint instance metreq[D], but only the variable with a nonzero value. (Uncheck “Sparse” if you want to see all variables). It also shows that the values of the two variables “Amount[ore3]” and “AMOUNT[ore4]” are at their upper bound. Exercice 2: INSTANCE dependencies: Run the model then click on tab INSTANCE. Move the mouse over the box “metreq[D] and click it. The result is shown in Figure 21. The tab DRAW shows the result of the drawing instructions in an LPL model (see Reference Manual 10.8). 16 Figure 22: The optimal solution of a 200-city TSP problem You can draw with LPL. For example, the instructions in LPL (where i is a set of 200 elements, xi,yi are vector of (x,y)-coordinates in a two-dimensional space, and Xi,j is a binary variable of a TSP problem: FOR{i} DO Ellipse(x-.1,y-.1,x+.1,y+.1,0) ; END; FOR{i} DO TextOut(i&' ',x-.3,y-.3,0); END; FOR{i,j|X} DO Line(x[i],y[i],x[j],y[j],3); END; will generate the picture of Figure 22 shown in tab DRAW. 8 Other advanced menu items (not in the Free Package) Menu <File / Save Snapshot> saves a data (inclusive variable values) in a file called snapshot. Exercice 1: Save Snapshot: Run the model then click on menu item <File / Save Snapshot>. Then enter the name ‘1.sps’ in the filename dialog. Click Save. A file is generated. (Note that snapshot filenames must have extensions ‘.sps’ in order to be read again by LPL.) After you have saved the snapshot, we want to modify just one data and save a second snapshot. Exercice 2: Save another Snapshot: Double click on bound (in the Tree). Then change the second entry (3000) to 1000. Then run the model. Now save a new snapshot with the filename ‘2.sps’. The file ‘2.sps’ is almost identical with the first snapshot file with the exception of the 1000. We want to load the first snapshot now. Exercice 3: Load a snapshot: Click menu item <file / Load Snapshot> and at the filename dialog enter ‘1.sps’. Click OK. If you look now at the bound table, you see that the first value is restored to 3000. This was just an exercise. You can store various snapshots at various moments. Loading one will restore the LPL data store to that particular state. Various snapshots can be compared in this way. If the snapshot files are called : ‘1.sps’, ‘2.sps’, ‘3.sns’, etc. then can be shown in a list by opening <Files/Load all snapShots>. Select 1.sps and 2.sps, then click Load selected. They can be loaded at once using the menu item <File / Load All SnapShots>. Exercice 4: Load all snapshots: Click menu item <file / Load All Snapshots> and then open the table bound. The result is shown in Figure 23 (left). The table is now a two-dimensional table with a further index _SNAP_. The table can be transposed as other two-dimensional tables (see Figure 23 (right)). 17 Figure 23: Two snapshots tables bound compared The two tables differ only in the first value (1000 against 3000), corresponding to the two snapshots. Click on menu item <Run / Parse Model> now to restore the initial state of the model. Run the model again by clicking the menu item <Run / Run Model>. Then we will generate a database. Exercice 5: Generate a SQL-File: Click on menu item <Tools / Create SQL-file. The browser opens two new tabs: alloy.sql and alloy.sq2. The function has created two files. The first of which is a complete SQL-script for the model data. It is as shown in Figure 24. CREATE DATABASE alloy; CREATE TABLE metalsTable ( metals VARCHAR(30) NOT NULL, alloy DOUBLE, metreq DOUBLE, CONSTRAINT Pkey PRIMARY KEY (metals)); COMMIT; INSERT INTO metalsTable VALUES ('A',0.18,0); INSERT INTO metalsTable VALUES ('B',-0.3,0); INSERT INTO metalsTable VALUES ('C1',-0.4,0); INSERT INTO metalsTable VALUES ('C2',0.6,0); INSERT INTO metalsTable VALUES ('D',0.02,0); COMMIT; CREATE TABLE oresTable ( ores VARCHAR(30) NOT NULL, bound DOUBLE, price DOUBLE, purity DOUBLE, AMOUNT DOUBLE, CONSTRAINT Pkey PRIMARY KEY (ores)); COMMIT; INSERT INTO oresTable VALUES ('ore1',1000,25,0.8,800); INSERT INTO oresTable VALUES ('ore2',3000,10,0.4,1200); INSERT INTO oresTable VALUES ('ore3',2000,20,0.7,2000); 18 INSERT INTO oresTable VALUES ('ore4',800,18,0.6,800); INSERT INTO oresTable VALUES ('ore5',2600,22,0.7,0); INSERT INTO oresTable VALUES ('ore6',1700,12,0.4,0); COMMIT; CREATE TABLE obtainTable ( ores VARCHAR(30) NOT NULL, metals VARCHAR(30) NOT NULL, obtain DOUBLE, CONSTRAINT R1 FOREIGN KEY (ores) REFERENCES oresTable (ores), CONSTRAINT R2 FOREIGN KEY (metals) REFERENCES metalsTable (metals)); COMMIT; INSERT INTO obtainTable VALUES ('ore1','A',0.2); INSERT INTO obtainTable VALUES ('ore1','B',-0.2); INSERT INTO obtainTable VALUES ('ore1','C1',-0.4); INSERT INTO obtainTable VALUES ('ore1','C2',0.4); INSERT INTO obtainTable VALUES ('ore2','A',0.15); INSERT INTO obtainTable VALUES ('ore2','C1',-0.2); INSERT INTO obtainTable VALUES ('ore2','C2',0.2); INSERT INTO obtainTable VALUES ('ore2','D',0.05); INSERT INTO obtainTable VALUES ('ore3','B',-0.4); INSERT INTO obtainTable VALUES ('ore3','C1',-0.3); INSERT INTO obtainTable VALUES ('ore3','C2',0.3); INSERT INTO obtainTable VALUES ('ore4','A',0.1); INSERT INTO obtainTable VALUES ('ore4','B',-0.2); INSERT INTO obtainTable VALUES ('ore4','C1',-0.3); INSERT INTO obtainTable VALUES ('ore4','C2',0.3); INSERT INTO obtainTable VALUES ('ore5','A',0.1); INSERT INTO obtainTable VALUES ('ore5','B',-0.25); INSERT INTO obtainTable VALUES ('ore5','C1',-0.25); INSERT INTO obtainTable VALUES ('ore5','C2',0.25); INSERT INTO obtainTable VALUES ('ore5','D',0.1); INSERT INTO obtainTable VALUES ('ore6','A',0.05); INSERT INTO obtainTable VALUES ('ore6','B',-0.08); INSERT INTO obtainTable VALUES ('ore6','C1',-0.17); INSERT INTO obtainTable VALUES ('ore6','C2',0.17); INSERT INTO obtainTable VALUES ('ore6','D',0.1); COMMIT; CREATE TABLE quantityTable ( quantity DOUBLE, quareq DOUBLE); COMMIT; INSERT INTO quantityTable VALUES (3000,0); COMMIT; Figure 24: The first SQL-file If you are a database expert, you can see that the file can be executed by any SQL-Server to generate a database. This can be done with the menu item <Tools / Access DB> do generate automatically a Microsoft Access database named alloy.mdb. Opening the database using Microsoft Access will show you the tables and the relationships created (see Figure 25). Figure 25: The Reationships of the created database 19 The second file created (alloy.sq2) is a complete submodel in LPL syntax which can read/write the data/variables now from/to this database (see Figure 26). This can be integrated within your model now. MODEL data; STRING PARAMETER db:='alloy.mdb'; READ {metals} FROM 'db,metalsTable' : metals='metals', alloy='alloy', READ {ores} FROM 'db,oresTable' : ores='ores', bound='bound', price='price', purity='purity', WRITE {ores} TO 'db,oresTable' : 'ores'=ores, 'AMOUNT'=AMOUNT; READ {ores,metals} FROM 'db,obtainTable' : ores='ores', metals='metals', obtain='obtain'; READ FROM 'db,quantityTable' : quantity='quantity', END Figure 26: Submodel in LPL for reading the data from the DB LPL can just be used to generate databases ! The context menu of the editor (tab alloy.lpl) also contains an entry that allows you to encrypt the model source file, so nobody except the LPL compiler itself can read it. Exercice 6: Encrypt the model: Click on menu item <Encrypt File> in the popup menu of the editor. Enter a (secret) key (a password), that you should remember for decrypting. Click ok. The source code has disappeared. 20