1
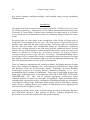
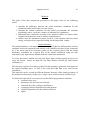
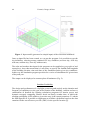
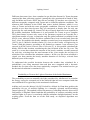
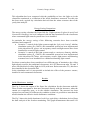
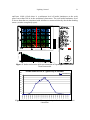
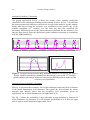
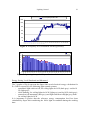
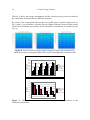
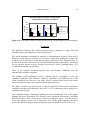
Int. Journal for Housing Science, Vol.33, No.1 pp. 45-56, 2009
Published in the United States
AUTOMATION SYSTEM FOR LIGHTING CONTROL: COMPARISON
BETWEEN DATA RECORDED AND SIMULATION MODEL
A. Frattari
Architecture and Civil Engineering, University of Trento
Trento, Italy
M. Chiogn
Department of Environmental and Civil Engineering,University of Trento
Trento, Italy
J. de Boer
Fraunhofer Institut für Bauphysik
Stuttgard, Germany
ABSTRACT
Control and improvement of the energy demand in buildings is more and more
importance because of many factors such as new. The best use of electricity for the
lighting systems will also be an important goal in the European energy saving laws
(PrEN 15193). For this reason the right use of natural light and the installation of
automatic control system to regulate the artificial light is considered a significant tool.
The investigation aims to define a new methodology for the design of lighting
systems to achieve both the standard comfort conditions and the low electricity
demand. This paper deals in particular with the results of specific case study: three
class rooms in the Faculty of Engineering in Trento where different automation
systems for the light control have been installed.
The results refer in particular about the energy saving calculated with the software
Adeline and the data monitored for the different implemented scenarios during the
first winter semester of monitoring.
0146-6518/01/ 45-56, 2009
Copyright©2009 IAHS
46
Frattari, Chiogn, de Boer
Key words: Lighting, intelligent building, visual comfort, energy saving, daylighting
simulation tool.
Introduction
This paper deals with a research activity carried out at the CUnEdI (University Center
for Intelligent Building) - Department of Civil and Environmental Engineering of the
University of Trento (Italy), with the aim to quantify how much energy it is possible
to save using an on/off automation system or a dimming lighting system in lecture
rooms.
For this purpose six class rooms at the second floor of the Faculty of Engineering of
Trento have been monitored for one year. The cross layout is characterized by two
parallel wings, both with the same south exposure. The lecture halls are symmetrical
and have the same shape. This configuration allows the simultaneous comparison
between the existing situation in the east wing (with the traditional electric system)
and the new one with automation system designed and realized in the west wing ((see
Frattari A., Albatici R., Chiogna M. “Intervention strategies on lighting system in
existing building towards energy efficiency and saving”, Sustainable Building 2007).
In this paper will be compared the energy consumption carried out from the recorded
data analysis with that ones obtained using a specific day lighting simulation tool. The
data refer about the winter semester of the year monitored.
There are numerous simulation tools currently available for lighting analysis (Lumen
Micro from Lighting Technologies Inc. www.lighting-echnologies.com; Super light
and Radiance from the Environmental Energy Technology Division, Building
Technologies Program at Lawrence Berkeley National Laboratory e t d . lbl .
govandradsite.lbl.gov/radiance/ HOME.html; Light scape Visualization System from
Light scape Technologies, Inc. www.lightscape.com DOE-2, DELIGHT, LITESTAR,
LIGHTESCAPE, etc.). They aim to generate appropriate architectural and/or
technical solutions to achieve an enjoyable and productive built environment while
simultaneously reducing the energy consumption of buildings through the substitution
of daylight for electric light. Simulation based design aid tools that address lighting
issues require a lighting analysis tool capable of determining interior lighting levels
and some measure of lighting comfort.
Among these software tools, in the research activity presented in this paper has been
used ADELINE (Advanced Day lighting & Electric Lighting Integrated New
Environment) to create the model of the class rooms analyzed.
Lighting Control
47
Methods
The goals of the data comparison presented in this paper focus on the following
issues:
1- calculate the difference between the inside luminance conditions for the
simulation model and for the real class rooms;
2- calculate the outside conditions for the model (in particular the sunshine
probability) and to verify the variance of statistical sky conditions;
3- understand how much the recorded users behavior differs in lecture halls,
compared with that one used in Adeline simulation tool
4- analyze how the automated systems work in a real situation and how much
energy saving has been expected looking for the Super-link output.
Inside luminance
The inside luminance, calculated with Adeline (Super light) for different time and sky
condition, has been compared both with the real condition measured in the classroom
by a lux meter placed in reference points on the working places and the inside
luminance calculated for a typical day of the month considered using the data
measured by the light sensors installed into the classrooms monitored.
To create the model, Adeline uses the tool Super light, which typically involves two
steps: the former creates an input file, the latter defines selected sky and location
conditions [1].
The first step consists of creating an input file that contains a geometric description of
the subject building space, as well as the solar and light data to be used for the
simulation.
The input file can be created in different formats. Because of the simple geometry of
the monitored classrooms, in this case a simple input model has been created (Fig.1).
To define the input file it is necessary to set the following parameters and data:
• geometric base case
• parameters for the base case selected
• materials for walls, ceiling(s) and floor(s)
• openings technical characteristics and position
• outside obstructions for the windows defined
• lights
48
Frattari, Chiogn, de Boer
Figure 1 Input model (generated as simple input) of the classroom monitored.
Once an input file has been created, we can run the program. It is possible to type the
sky definition, selecting among standard CIE sky condition (overcast sky, clear sky
with sun, uniform sky, clear sky without sun).
The solar and weather data input for the program can be supplied as geographical and
atmospheric data, that means that it is necessary to specify the latitude and longitude
of the building location, time and date of the simulation under given sky conditions.
In this way the simulation program provides for a series of simulations for given times
of day and year.
The output can be displayed as contour plots of luminance (Fig. 2).
Sunshine Probability
The design and performance of a daylight system depends strictly on the duration and
frequency of sunshine over the year at the location of the building. Adeline tool uses a
combination of detailed day lighting calculation programs for interior spaces and
dynamic energetic computing routines based on hourly weather data, in which the
sunshine probability (SSP) within a given time step is the central parameter. To obtain
the SSP input file it is possible to implement an Adeline calculation based on the data
contained in the test reference year file (TRY) for the specific location [2].
Lighting Control
49
Different data source have been consulted to get this data format for Trento but none
contained the data collection required. Among the cities monitored in North of Italy,
only for Milan and Venice IWEC data file are available [3] but these two cities have a
different orography compared with Trento and so different radiation conditions. The
wheatear data contained in the IGDG data source include Bolzano, which is very
close to Trento and with the some geographic conditions. However it has been not
possible to use these data because they are structured as hourly data for only one
typical day for each month [4], instead 365 days of hourly data have been required for
the Adeline simulation. Furthermore it is not possible for Trento to get a complete
TRY data format, because only some of the parameter required are recorded for a
significant number of years, in particular only the global radiation is available for the
last 20 years, whereas diffuse and direct radiation have been recorded only from the
last 5 years. Nevertheless the hourly sunshine seconds have been monitored from the
1983 by the S. Michele whether station [4], close to the Faculty of Engineering in
Trento. With this dataset, according to the method to compute a test reference year
exposed in IGDG Italian Climatic data Collection [5], it was possible calculated the
hourly SSP for this location, considering the data recorded in the last 20 years. The
result is a vector that contains the amount of the hourly sunshine seconds measured
for each day, selecting from the total amount of the years sample the real days for
which has been calculated the minimum variance. In this way has been calculated a
virtual year that contains the hourly sunshine duration of real days, selected from
different years of the sample.
To understand the possible deviation between the weather data calculated for a
probabilistic year using measured data and that ones computed with a theoretic
method, the two data series has been statistically compared. The method used to get
the theoretical radiation is contained in [6].
Probability to Turn on the Light as Function of the Inside Illuminance
The probability to turn on manually the light considered by Adeline tool to calculate
the energy saving for a manual use of the artificial light has been compared with that
one calculated for a typical day in the monitored classrooms.
Adeline tool uses the Manual On/Off Probability defined by Hunt that predicts the
probability for use of artificial lighting in a manually operated on/off-switching
control system [4]. The method is based on patterns of switching behavior observed in
field studies in England. Hunt found that the probability of someone switching on the
artificial lights in a space is correlated with the minimum daylight luminance on the
working plane. From the data set of the field study, an empirical algorithm was
defined.
50
Frattari, Chiogn, de Boer
This algorithm has been compared with the probability to have the light on in the
classrooms monitored as a function of the inside luminance measured. For this aim
has been used a typical day calculation derived from the winter semester data of the
yearly data analysis.
Energy Saving Comparison
The energy saving calculated by Super-link for 2 light systems (Lightswith on/off and
Continuous Dimming) has been compared with the data monitored in the classrooms
where automated light control systems have been installed.
In particular the energy saving of the following scenarios have been recorded,
simulated and compared:
• Scenario 1: control of the light system trough the light switch on/off Adeline
simulation option (Em>300 lx); this automated system has been implemented
in the classroom 2P, where one occupancy sensor and light sensors have been
installed for an on/off light control.
• Scenario 2: control of the light system trough a continuous dimming Adeline
simulation option (Em>300 lx); this automated system has been implemented
in the classroom 2N, where one occupancy sensor, light sensors and dimming
actuators have been installed for a continuous dimming light control.
For these scenarios have been considered two different type of luminaries: the ceiling
light already used for the traditional classrooms, 4x18 W (fluorescent tube T8) and a
more efficient kind of ceiling light 4x14 W (with new fluorescent tubes T5), that have
been installed in the classroom 2M.
In the simulation tool it is not possible to include the effect of the presence sensors,
installed in each automated classrooms.
Results
Inside Illuminance Analysis
The Fig. 2 shows the output of the Super lite calculation for the classroom modeled.
These results correspond to that ones measured directly with the luxmeter, when the
curtain are completely open, as in the Adeline simulation. The measure has been
repeated several times for different sky condition so that it is possible to attest that the
model simulate the effective inside luminance conditions.
The Fig.3 shows the inside luminance level for a typical day calculation, derived from
the data analysis of the October monitoring. This graph demonstrates that until 9.30
Lighting Control
51
and later 16.00 o’clock there is a minimum level of inside luminance at the work
place lower than 300 lx in the traditional classrooms. The real inside luminance level
is lower than that one simulated with Adeline or measured directly check that shading
status (curtains completely open).
1.67
1.43
1.19
0.95
0.72
0.48
0.24
0.00
Illuminance [klx
Illum.[klx]
diffuse daylight
Projection against Y axis
Figure 2 Isolux and section plot representation of Super light results for the
classroom model.
lx
Inside iluminace for a Typical day in October
inside illuminance
900
800
700
600
500
400
300
200
100
21:24:00
20:42:00
20:00:00
19:18:00
18:36:00
17:54:00
17:12:00
16:30:00
15:48:00
15:06:00
14:24:00
13:42:00
13:00:00
12:18:00
11:36:00
10:54:00
10:12:00
09:30:00
08:48:00
08:06:00
07:24:00
06:42:00
06:00:00
0
Figure 3 Inside luminance level for a typical day in October for a traditional
classroom.
52
Frattari, Chiogn, de Boer
Sunshine Probability Calculation
The graphs represented in Fig. 4 shows the results of the sunshine probability
calculated for the monitored building location during October. In Fig. 5 in particular
has been presented the difference between an averaged data analysis and the statistic
hourly data derived from the reference year calculated for the specific day of the
Adeline simulation (15th October). For the same day has been calculated the
percentage difference between the global radiation calculated for the reference year
and the data derived from the theoretical global radiation calculated in conformity
with the SERI method [6].
1,00
0,90
0,80
0,70
0,60
0,50
0,40
0,30
0,20
0,10
2 3 :0 0
2 1 :0 0
1 9 :0 0
1 7 :0 0
1 5 :0 0
1 3 :0 0
1 1 :0 0
0 9 :0 0
0 7 :0 0
0 5 :0 0
0 3 :0 0
0 1 :0 0
2 3 :0 0
2 1 :0 0
1 9 :0 0
1 7 :0 0
1 5 :0 0
1 3 :0 0
1 1 :0 0
0 9 :0 0
0 7 :0 0
0 5 :0 0
0 3 :0 0
0 1 :0 0
2 3 :0 0
2 1 :0 0
1 9 :0 0
1 7 :0 0
1 5 :0 0
1 3 :0 0
1 1 :0 0
0 9 :0 0
0 7 :0 0
0 5 :0 0
0 3 :0 0
0 1 :0 0
2 3 :0 0
2 1 :0 0
1 9 :0 0
1 7 :0 0
1 5 :0 0
1 3 :0 0
1 1 :0 0
0 9 :0 0
0 7 :0 0
0 5 :0 0
0 3 :0 0
0 1 :0 0
2 3 :0 0
2 1 :0 0
1 9 :0 0
1 7 :0 0
1 5 :0 0
1 3 :0 0
1 1 :0 0
0 9 :0 0
0 7 :0 0
0 5 :0 0
0 3 :0 0
0 1 :0 0
2 3 :0 0
2 1 :0 0
1 9 :0 0
1 7 :0 0
1 5 :0 0
1 3 :0 0
1 1 :0 0
0 9 :0 0
0 7 :0 0
0 5 :0 0
0 3 :0 0
0 1 :0 0
2 3 :0 0
2 1 :0 0
1 9 :0 0
1 7 :0 0
1 5 :0 0
1 3 :0 0
1 1 :0 0
0 9 :0 0
0 7 :0 0
0 5 :0 0
0 3 :0 0
0 1 :0 0
0,00
Figure 4 Sunshine probability calculation for the October reference year month.
1,00
120
0,90
0,80
100
0,70
80
0,60
0,50
60
0,40
40
0,30
0,20
20
0,10
22:00
20:00
18:00
16:00
14:00
12:00
10:00
08:00
06:00
04:00
02:00
22:00
20:00
18:00
16:00
14:00
12:00
10:00
08:00
06:00
04:00
02:00
24:00
24:00
0
0,00
Figure 5 Comparison between the daily insulation amount as average for the data set
and the sunshine probability calculated for the reference year on the 15th October;
global radiation percentage difference between the SERI theoretical model and the
reference year calculation.
Operating Time Probability Calculation
The Fig. 6 represents the occupancy level in the traditional classroom 2B as a function
of the inside illumination level measured. The typical day derived from the winter
semester data analysis shows that the occupancy level probability grows up
significantly for an inside luminance level higher than 40 lx.
The Fig. 7 shows the probability to have the light system operating as function of
inside luminance. In particular it is still possible (probability>0,3) to have the light
turn on with an inside luminance higher than 500 lx.
Lighting Control
53
(%) occupancy level in 2B
120
100
80
60
40
20
910
865
844
768
711
654
600
438
368
289
177
105
63,3
56,4
40,7
23,1
12,3
6,49
5,73
3,02
2,25
0,08
0,05
0
Figure 6 Occupancy level calculation for the typical day.
Serie1
0,9
0,8
0,7
0,6
0,5
0,4
0,3
0,2
0,1
778
764
757
747
740
728
695
659
647
627
591
559
498
428
356
261
207
184
152
125
99,2
73,6
55,5
54,6
53,3
39
45,6
0
Figure 7 Operating time probability as function of the inside luminance.
Energy Saving Level Simulated and Measured
The 3 graphs of Fig.8 represent the Super link saved electrical energy calculation for
Em=300 lx respectively for following light control systems:
- automated light witch on/off, for ceiling lights 4x14 W (dark grey) and 4x18
W (light grey);
- ideal dimming, for ceiling lights 4x14 W (light grey) and 4x18 W (dark grey);
- manual on/off automated (dark grey) and light switch on/off(light grey) both
for ceiling lights 4x14 W
It is important to precise that the reference energy consumption level has been
calculated by Super link considering the 100% light on condition during the working
time.
54
Frattari, Chiogn, de Boer
The Fig. 9 shows the energy consumption and the electrical energy saved recorded in
the classrooms monitored for the different scenarios.
By mean of the comparison between the two graphs series reported respectively in
Fig. 8 and 9, it is possible to calculate the percentage difference between light switch
on/off, ideal dimming and manual on/off simulated or monitored, as reported in the
Fig. 10.
Figure 8 Saved electrical energy graphic outputs of Super link simulation for
different scenarios (automated light switch on/off, ideal dimming, manual on/off)
Energy Consumption in class rooms monitored
200,0
180,0
kWh/month
160,0
140,0
dimming
120,0
lightsw itch on/off
100,0
maual on/off
80,0
reference level
60,0
40,0
20,0
0,0
September
October
November
December
Saved Electrical Energy in class rooms monitored
120,0
100,0
kWh/month
80,0
60,0
dimming
lightsw itch on/off
40,0
maual on/off
20,0
0,0
September
October
November
December
-20,0
-40,0
Figure 9 Energy consumption and saved electrical energy measured in the
classrooms monitored.
Lighting Control
55
Percentage difference between energy saved
monitored and calculated with Adeline
100,0
percentage
80,0
manual on/off
60,0
lightswitch on/off
40,0
dimming
reference level
20,0
0,0
September
October
November
December
Figure 10 Percentage difference between the energy saving monitored and estimated.
Conclusion
The difference between the saved electrical energy estimated by Super link and
recorded can be amenable to the factors that follow.
The inside luminance simulated by Adeline is underestimated, because of the user’s
behavior positioning the curtains. It has been verified that during the lessons the
windows can be partially covered (because they could have been forgotten close by
the previous lesson, because the lesson could include partially projections, sometimes
for any specific reason) so that it would be necessary to select a shading factor = 0,5
to simulate better the real situation.
There is an intrinsic deviation between the real weather conditions and the
probabilistic condition estimated.
The manual on/off probability used by Adeline doesn’t correspond to the real
condition monitored. The difference could be explained by the different use of the
room considered: the first one is an office, where a person works alone; the second
one is a classroom where more persons should attend a lesson.
The future research step will include a critical comparison between the classrooms
conditions and that one required by the prEN 15193, in particular with reference to a
shading system design.
The residential energy demand for lighting has been estimated the 28% of the global
lighting electricity generation. The energy saving calculated for housing is included
between 40-60%, using smart devices and new luminaries types. For the services
sector the lighting energy use is about the 48% of the global lighting electricity
generation and the energy saving potential has been estimated between 25-40% [8].
56
Frattari, Chiogn, de Boer
References
1. International Energy Agency, 2000, Superlite User’s Manual and Technical
Manual, Documentation of the Software Package ADELINE, Version 3
2. International Energy Agency, 2000, Superlink/Radlink User’s Manual and
Technical Manual, Documentation of the Software Package ADELINE,
Version 3
3. ASHRAE, 2001. International Weather for Energy calculations (IWEC
Weather Files) Users Manual and CD-ROM, Atlanta
4. Servizio Metereologico del Trentino, Istituto Agrario di S.Michele A.Adige,
Rete
Agrometeorologica
IASMA,
http://217.222.71.209/meteo/datimeteo/ricercadati.php
5. U.S. Department of Energy, Energy Efficiency and Renewable Energy,
Weather
Data,
available
in:http://eere.energ.gov/buildings/energyplus/weatherdata_sources.html#IGD
G
6. Richard E. Bird, Roland L.Hulstro, 1981, A Simplified Clear Sky Model for
Direct and Diffuse Insulation on Horizontal Surfaces, SERI
7. Chiogna M., Frattari A., 2006, Visual comfort and low energy consumption:
lighting strategies in university lecture halls, Proceeding XXXIV IAHS
World Housing Congress, Luciano Editore, Napoli.
8. Mills E., May 2002, The $230-billion Global Lighting Energy Bill,
Proceedings of the 5th International Conference on Energy-Efficient Lighting,
Nice, France