1
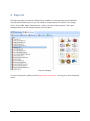
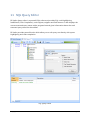
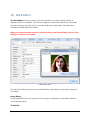
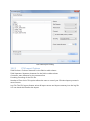
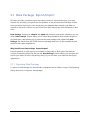
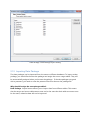
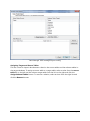
8 Charts
A Chart picture is worth a 1,000 words... This adage rings especially true when it comes to
charting. Charts summarize and illuminate patterns in data in a way that long tables of
numbers simply cannot. BI Studio Charting is a feature reach Microsoft Charting library.
BI Studio are an encompassing set of charts for business intelligence projects or applications.
The Chart Controls suite offers a wide array of chart types and charting features. The Chart
Controls offer all of the standard chart types: line charts, bar charts, pie charts, column
charts, stack charts and so forth - as well as more specialized ones, like pyramid and bubble
charts.
The Chart Controls suite offers a comprehensive set of charting features, including support
for multiple series, customizable legends, trend lines, and labels. And the Chart Controls
makes it easy to sort, search, filter, group, and export the chart data.
8.1
Chart Designer
There is a wizard to guide you through customizing the chart's look and feel and specifying
its data source. The Chart Designer allows you to add new data series, Labels, Titles and
allows you to customize the chart look and feel.
The Charting documentation is not written here . For more information, please read the
Charting User Manual. You can get it from download center.
Copyright © Nucleon Software
Page 12