1
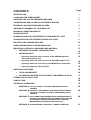
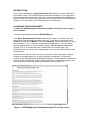
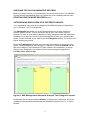
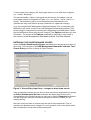
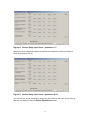
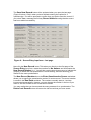
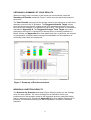
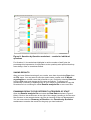
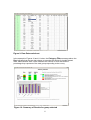
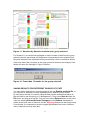
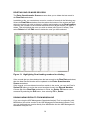
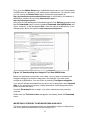
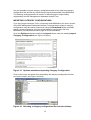
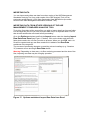
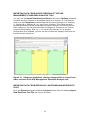
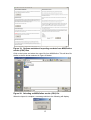
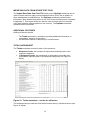
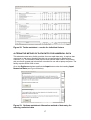
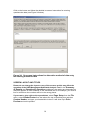
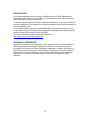
HSE
MANAGEMENT STANDARDS
ANALYSIS TOOL
USER MANUAL
Page
CONTENTS
INTRODUCTION
1
LAUNCHING THE SPREADSHEET
1
CHECKING FOR OLD OR UNWANTED RECORDS
2
CATEGORISING EMPLOYEES INTO DIFFERENT GROUPS
2
ENTERING YOUR QUESTIONNAIRE SCORES
3
OBTAINING A SUMMARY OF YOUR RESULTS
6
INDIVIDUAL QUESTION RESULTS
6
SAVING RESULTS
7
EXAMINING RESULTS FOR DIFFERENT CATEGORIES OF STAFF
7
SAVING RESULTS FOR DIFFERENT GROUPS OF STAFF
9
DELETING ONE OR MORE RECORDS
10
DOWNLOADING RESULTS FROM MSQONLINE
11
IMPORTING CATEGORY CONFIGURATIONS AND DATA
11
•
IMPORTING CATEGORY CONFIGURATIONS
12
•
IMPORTING DATA
13
o
Importing data from other versions of the HSE Management
Standards Analysis Tool
13
o
Importing data from older versions of the HSE Analysis Tool
14
o
Importing data from previously saved MSQOnline results files
14
o
Importing data from other text files
16
ADDITIONAL FEATURES
16
•
TOTALS WORKSHEET
16
•
ALTERNATIVE METHOD OF DATA ENTRY FOR NUMERICAL DATA
17
SCREEN LAYOUT AND TITLES
18
CONTACT HSE
19
TECHNICAL APPENDICES
19
APPENDIX A: CALCULATION OF CURRENT PERFORMANCE AND
20
TARGETS
APPENDIX B: TECHNICAL INFORMATION AND PROCEDURES USED IN
22
THE CALCULATION OF CURRENT PERFORMANCE AND
TARGETS
APPENDIX C: CSV FORMAT REQUIREMENTS FOR USERS WISHING TO
28
EXPORT DATA FROM OTHER SOFTWARE APPLICATIONS
IN A FORMAT SUITABLE FOR IMPORT INTO THE HSE
MANAGEMENT STANDARDS ANALYSIS TOOL
APPENDIX D: KNOWN ISSUES / FREQUENTLY ASKED QUESTIONS
31
INTRODUCTION
There is one spreadsheet, msanalysistool15x.xls designed for users of Microsoft
Excel 2000 or later. The HSE Management Standards Analysis Tool is designed to
accommodate manual data entry of records, records downloaded from MSQOnline,
import of electronic records from other versions of the Analysis Tool (including earlier
versions), or a combination of these different forms of data entry.
LAUNCHING THE SPREADSHEET
To make the HSE Management Standards Analysis Tool work, save a copy to
your computer.
Launch the spreadsheet and select Enable Macros.
If the Enter Questionnaire Scores worksheet is empty, you should verify that
your security settings will allow macros to be run. To do this you should go to the
Tools menu and select Macro. Then select Security. Ensure that security is set to
either ‘Medium’ or ‘Low’ (‘Medium’ is the recommended option). You can restore
security settings when you have finished using the HSE Management Standards
Analysis Tool. You should close and reopen Excel if it is already open. We
recommend that you restore the original setting as soon as you have finished using
the application.
At the bottom of the first screen you will see a series of tabs (see Figure 1 below).
Clicking on the tabs allows you to move to different worksheets. The following
sections of the HSE Management Standards Analysis Tool User Manual describe the
content of these worksheets in more detail. Please do not change the names of any
of the worksheets as this will affect the operation of the Analysis Tool.
Figure 1: HSE Management Standards Analysis Tool first screen
1
CHECKING FOR OLD OR UNWANTED RECORDS
Before you begin to enter your questionnaire scores for the first time, it is advisable
to check that the spreadsheet does not contain any old or unwanted records (see
DELETING ONE OR MORE RECORDS below).
CATEGORISING EMPLOYEES INTO DIFFERENT GROUPS
Your organisation may have been categorised into different groups of employees,
e.g. by ‘location’, ‘role’ or ‘Department’.
The Categories tab allows you to set up the analysis tool to enter results for
different groups of staff. You can use this to set up your own choice of group
identifiers in each of up to twelve categories. Listing categories here will make them
available to you when you move to the next worksheet to enter your questionnaire
scores. Please note that, if you wish to use the Categories facility, you must do this
before entering any results.
Select the Categories worksheet from the tabs at the bottom of the screen (see
Figure 2 below). Beginning with Category A, replace the identifier Untitled with the
title of the category. In the example in Figure 2 below, the coordinator, or person
setting up the categories, has chosen to enter results using the categories of
Location, Role, Sex and Age.
Figure 2: HSE Management Standards Analysis Tool Categories screen
Please note that a category entitled Untitled, or whose title is left blank, will not be
considered configured by the Management Standards Analysis Tool, i.e., it will be
ignored.
2
To enter items in the category list, simply type them in as you wish them to appear,
e.g., ‘Cardiff’, ‘Edinburgh’.
The special identifier <None> must appear as the first item in a category list and
must appear exactly as it appears in Figure 2 (i.e., as ‘<None>’, not as ‘<none>’ or
‘None’). This allows the user to record instances when respondents to the
questionnaire may have failed to provide a selection for a particular category.
If you are using the HSE Management Standards Analysis Tool in conjunction with
MSQOnline (the online version of the HSE Management Standards Indicator Tool),
please configure categories by importing the configuration from MSQOnline. Please
see the MSQOnline Admin page and the Analysis Tool Options worksheet for more
information. The content of the Options worksheet is described in more detail in
later sections of the Management Standards Analysis Tool User Manual.
ENTERING YOUR QUESTIONNAIRE SCORES
Select the Enter Questionnaire Scores worksheet from the tabs at the bottom of
the screen. The first page of the HSE Management Standards Indicator Tool Scores Entry input form is shown in Figure 3 below.
Figure 3: Scores Entry input form – categories drop down menus
If the questionnaire results you are about to enter have been categorised into groups,
the Enter Questionnaire Scores worksheet will display drop down menus
corresponding to the Categories that you have set up on the Categories worksheet.
Use the drop down menus to indicate the group(s) to which the results you are
entering belong.
Now click on the > button to continue with the rest of the questionnaire. The 35
questions are distributed over 5 pages. For each question, click on the option button
that corresponds to the answer in the questionnaire.
3
Figure 4: Scores Entry input form – questions 1-7
When you have entered the replies to the first five questions, click the > button to
move to questions 8 to 14.
Figure 5: Scores Entry input form – questions 8-14
You can use the > and < buttons to step from one screen to the next. Or you can go
directly to a page by using the Select Questions buttons.
4
The Save New Record button will be activated when you open the last page
(Figure 6 below). Click it when you have finished entering the replies for a
questionnaire. You will be prompted to confirm that you wish to save the record. If
you select Yes, a message box will say Record Added showing that the record
has been added successfully.
Figure 6: Scores Entry input form – last page
Now click the New Record button. This takes you directly to the first page of the
Scores Entry input form, resets the questions to No Answer and increments the
New Record Number by 1. You can then use the drop down menus to indicate the
group(s) to which the next questionnaire’s results belong, and start entering your
results for the next questionnaire.
The New Record Number box on the Enter Questionnaire Scores worksheet
allows you to specify the questionnaire number for a new record. The record number
is stored in the Raw Data worksheet. The numbers normally start at 1 and are
incremented automatically. However, you can change the number in the box if you
want to, and this number is the one that will be saved.
You may realise that you have entered the wrong answers for a questionnaire. The
Delete Last Record button will remove the last record that you have saved.
5
OBTAINING A SUMMARY OF YOUR RESULTS
When you want to see a summary of the results you have entered, select the
Summary of Results worksheet (Figure 7 below) from the tabs at the bottom of
the screen.
The Your Results column gives the average value for the responses to each of the
stressors covered in the 35 questions. The Suggested Interim Target column
gives the target score that we suggest would be a reasonable target for you to aim
for next time (for example, in 6 months to a year’s time). The way this is calculated is
described in Appendix A. The Suggested Longer Term Target is the value
achieved by the top 20% of workers in a national survey of working conditions in
Britain. Please see Appendix A for more details and note, in particular, the caveats
on interpretation of results and the strong recommendation on the importance of
confirming results with your employees.
Figure 7: Summary of Results worksheet
INDIVIDUAL QUESTION RESULTS
The Question by Question worksheet (Figure 8 below) shows you the average
score for each question. The colour coding gives an indication of how your
performance for that question relates to the responses given by employees taking
part in a national survey. Please see Appendix A for more details. Please note, in
particular, the caveats concerning use and interpretation of results for individual
questions.
6
Figure 8: Question by Question worksheet – results for individual
questions
For Question 21, the worksheet highlights in red the number of staff (plus the
percentage this respresents of respondents to the question) who reported that they
were always, often or sometimes bullied.
SAVING RESULTS
After you have finished entering all your results, save them by selecting Save from
the File menu. You may want to save the results under a name such as Whole
organisation or another name that is familiar to you. Do this by selecting Save As
from the File menu and change the file name accordingly. To prevent you
accidentally overwriting or deleting some of your results, it is advisable to copy this
file and save it as a working file called Results analysis file or some such title.
EXAMINING RESULTS FOR DIFFERENT CATEGORIES OF STAFF
Open the Results analysis file and select the Raw Data worksheet (Figure 9
below). Click on the small button to the right of the category heading to use the auto
filter function. In the example below, the user is choosing to filter on ‘Management’.
You can now select the Summary of Results or the Question by Question
worksheets to examine the results for the group you have selected.
7
Figure 9: Raw Data worksheet
In the example in Figures 10 and 11 below, the Category Filter message above the
Key indicates that the user has chosen to examine the results for London-based,
male, administrative staff. It also indicates the number of such staff and the
percentage they represent of the total group responding to the survey.
Figure 10: Summary of Results for group selected
8
Figure 11: Question by Question worksheet for group selected
For Question 21, the worksheet highlights in red the number of staff from the group
selected (plus the percentage this respresents of respondents to the question from
the group selected) who reported that they were always, often or sometimes bullied.
If there are fewer than 10 people in the group you have selected, the Category Filter
facility will return the message in Figure 12 below:
Figure 12: Fewer than 10 results for the group selected
SAVING RESULTS FOR DIFFERENT GROUPS OF STAFF
You may wish to keep all your results together in the one Results analysis file, or
you may wish to split data to create separate files for different groups of staff.
An easy way to do this is to start by using the filter function as described above to
filter the data for the first group (e.g. ‘Management’). Then select Save As from the
File menu and save as a new file. You can now use the Extract button (to be found
under the heading Extract Selected Category on the Options worksheet) to
delete all the other rows of data from this file. Warning! Please note that this process
is irreversible, it is important to save the original spreadsheet first under a different
name, otherwise you may lose data.
9
DELETING ONE OR MORE RECORDS
The Enter Questionnaire Scores screens allow you to delete the last record in
the Raw Data worksheet.
In addition to this, you can delete a record or a series of records in the following way.
Select the Raw Data worksheet from the tabs at the bottom of the screen and then
select the records you wish to delete by clicking and dragging on the Row heading
numbers (the numbers in the extreme left hand column) of the records you wish to
delete. This will highlight the rows you wish to delete (see Figure 13 below). Then
select Delete from the Edit menu to delete the rows you have selected.
Figure 13: Highlighting Row Heading numbers for deleting
If the records that you have deleted are the last records in the Raw Data worksheet,
then the New Record Number will be updated on the Enter Questionnaire
Scores worksheet.
If the records you have deleted come from earlier in the series, you can use Excel’s
Series Fill feature to revise the record numbers found in the Record Number
Column (A) of the Raw Data worksheet. In Excel, the Series Fill feature can be
accessed by selecting the Edit menu, then selecting Fill >, Series.
DOWNLOADING RESULTS FROM MSQONLINE
If you are using the HSE Management Standards Analysis Tool in conjunction with
MSQOnline (the online version of the HSE Management Standards Indicator Tool),
you can download your results directly from MSQOnline into the HSE Management
Standards Analysis Tool.
10
First, go to the Admin Home page of MSQOnline and make a note of the address
of MSQOnline as it appears in your web browser’s address bar. For example, when
you are viewing the Admin Home page, the address might appear as
http://myintranet/msqonline/admin/admin.aspx. In this instance, the address of
MSQOnline (obtained by removing /admin/admin.aspx) is
http://myintranet/msqonline.
Now go to the HSE Management Standards Analysis Tool Options worksheet and
find the Download button under the heading Download from MSQOnline (see
Figure 14 below). In the field labelled URL, enter the address of MSQOnline; in the
example given above this would be http://myintranet/msqonline.
Figure 14: Downloading into Analysis Tool from MSQOnline
Before you download and populate survey data, you may wish to download and
configure categories so that the categories in the Analysis Tool match those
configured in MSQOnline. You can do this by selecting Configure categories.
If you wish to add the downloaded survey data to any existing data, select Append
data. If you would like to clear any existing data before downloading takes place,
please uncheck this option.
Press the Download button to begin. You will be notified when the process is
complete.
Please note the Technical notes that appear immediately below the Download
button.
IMPORTING CATEGORY CONFIGURATIONS AND DATA
The above method is the simplest method of downloading category configurations
and survey data from MSQOnline into the Analysis Tool.
11
It is also possible to import category configurations and survey data from category
configuration files and survey results files previously downloaded from MSQOnline.
The following sections describe a number of different types of import facility
supported by the HSE Management Standards Analysis Tool.
IMPORTING CATEGORY CONFIGURATIONS
If you are using the Analysis Tool in conjunction with MSQOnline (the online version
of the HSE Management Standards Indicator Tool) and wish to import a category
configuration using this facility (rather than using the Download facility described
above), please ensure that you have downloaded the configuration file from
MSQOnline (see MSQOnline Admin page for more information).
Go to the Options worksheet and find the Import button under the heading Import
Category Configuration (see Figure 15 below).
Figure 15: Options worksheet: Importing Category Configuration
Click on the button and select from the desktop the category configuration file that
you wish to import (see Figure 16 below).
Figure 16: Selecting a category configuration file from the desktop
12
IMPORTING DATA
You can import and collate raw data from other copies of the HSE Management
Standards Analysis Tool, from older copies of the HSE Analysis Tool or from
previously saved ‘Results’ (CSV) files downloaded from MSQOnline (the online
version of the HSE Management Standards Indicator Tool).
IMPORTING DATA FROM OTHER VERSIONS OF THE HSE
MANAGEMENT STANDARDS ANALYSIS TOOL
To do this, first collect all the source files you wish to import data from into one folder.
Put the target file (the one you wish to import data into) in a separate folder. Ensure
that all other workbooks are closed before proceeding.
Go to the Options worksheet and find the Import button under the heading Import
Raw Data from Excel (see Figure 17 below). Click on the button and select the
folder that contains the .xls files you wish to process. When you click OK, each .xls
file will be opened and any raw data contained in it added to the Raw Data
worksheet of the target file.
The success of processing depends on matching column headings (e.g. ‘Question
35’) between source and target Raw Data sheets.
Warning! Depending on how many .xls files are being processed and the size of the
files, importing raw data may be a lengthy operation.
Figure 17: Options worksheet: Import Raw Data from Excel
13
IMPORTING DATA FROM OLDER VERSIONS OF THE HSE
MANAGEMENT STANDARDS ANALYSIS TOOL
You may use the Import Raw Data from Excel facility on the Options worksheet
to import data from versions of the analysis tool prior to version 1.4. To do this you
must go to the Categories worksheet and alter the title of Category A to ‘Category
A’, Category B to ‘Category B’, etc. (see Figure 18 below). Then follow the same
procedures described in the section above to import raw data. Once the import has
been carried out, you can restore the titles of Category A, Category B, etc. to their
previous titles (Location, Role, etc.). You can do this manually or, if a category
configuration file is available, you can use this to restore the category titles once the
import has been carried out.
Figure 18: Categories worksheet: altering category titles to import from
older versions of the HSE Management Standards Analysis tool
IMPORTING DATA FROM PREVIOUSLY SAVED MSQONLINE RESULTS
FILES
Go to the Options worksheet and find the Import button under the heading Import
Raw Data from Text File (see Figure 19 below).
14
Figure 19: Options worksheet: Importing raw data from MSQOnline
results (CSV) files
Click on the button and select the output file from MSQOnline. This will be a file
similar to the file shown selected in Figure 20 below.
Figure 20: Selecting an MSQOnline results (CSV) file
When the import is complete, a message similar to the following will display.
15
IMPORTING DATA FROM OTHER TEXT FILES
The Import Raw Data from Text File facility on the Options worksheet can be
used to import data from other comma separated value (CSV) files in addition to
those downloaded from MSQOnline. The Options worksheet provides further
information. More detailed information on the CSV format requirements is contained
in Appendix C. This import facility can also be used to import data from text files
using other delimiter settings apart from 44 (comma). The Options worksheet
provides further information.
ADDITIONAL FEATURES
Additional features include:
o
o
The Totals worksheet: a worksheet providing additional information on
respondents’ patterns of responses;
An alternative method of data entry for numerical data.
TOTALS WORKSHEET
The Totals worksheet records for each of the questions:
•
•
Response Counts: the numbers of respondents selecting each of the
response categories;
% Response Counts: the percentage of respondents (excluding nonrespondents) selecting each of the response categories (see Figure 21
below).
Figure 21: Totals worksheet – results for all factors
The worksheet also provides this information broken down by individual factors (see
Figure 22 below).
16
Figure 22: Totals worksheet – results for individual factors
ALTERNATIVE METHOD OF DATA ENTRY FOR NUMERICAL DATA
This alternative data entry facility provides for more rapid data entry. It requires that
responses on the paper questionnaire that you are processing be labelled with
numbers (1-5). The method of data input is most efficient when used in conjunction
with a numeric keypad and is therefore not suited for use with a laptop computer. The
facility requires Excel 2000 or later.
Go to the Options worksheet and find the Input button under the heading Input
Numerical Data (see Figure 23 below).
Figure 23: Options worksheet: Alternative method of data entry for
entering numerical data
17
Click on the button and follow the detailed on-screen instructions for entering
questionnaire data (see Figure 24 below).
Figure 24: On-screen instructions for alternative method of data entry
for entering numerical data
SCREEN LAYOUT AND TITLES
Please do not change the layout on any of the screens as this may affect the
operation of the HSE Management Standards Analysis Tool. In the Summary
of Results and Question by Question worksheets, the graphs are dependent on
data that appears in fixed locations on the worksheet and if, for example, you insert a
line for a title then the numbers will be in the wrong places.
If you want to give a title to the spreadsheet, select Page Setup from the File
menu, select Header/Footer from the tabs at the top of the dialog box and then
Custom Header, and type your header/title in there. It will show up in Print
Preview and on the printout.
18
CONTACT HSE
If you need assistance with any aspect of MSQOnline or the HSE Management
Standards Analysis Tool, or if you wish to provide feedback about your experience
using these tools, please contact HSE.
To obtain technical support for issues relating to MSQOnline, or to provide HSE with
welcome feedback of your experience using this software, please send a message to
[email protected].
For technical support relating to the HSE Management Standards Analysis Tool or
for any other query concerning HSE’s Management Standards and supporting tools,
please call the HSE Infoline on 0845 345 0055.
For more information please visit the HSE web site at
http://www.hse.gov.uk/contact/index.htm.
TECHNICAL APPENDICES
Appendix A contains a brief explanation of the approach taken to the calculation of
current performance and targets. Appendix B contains more detailed technical
information on the basis for these calculations. Appendix C contains information on
the CSV format requirements for users wishing to export data from other software
applications in a format suitable for import into the HSE Management Standards
Analysis Tool. Appendix D contains some known issues or frequently asked
questions.
19
APPENDIX A
CALCULATION OF CURRENT PERFORMANCE AND TARGETS
‘SUMMARY OF RESULTS’ SCREEN
Each of the 35 questions in the HSE Indicator Tool relates to one of the seven
stressors, which, in turn, relate to the respective Management Standards (Demands,
Control, Managerial Support, Peer Support, Relationships, Role and Change). The
items are based on the best available evidence linking work design to health
outcomes.
The scores provided by the HSE Indicator Tool are based on employee responses to
the questionnaire. They indicate how you are performing against each of the
Management Standards. The scores range from 1 to 5. A lower score indicates poor
performance, or a potential problem area. See HSE Indicator Tool User Manual for
information on use of the HSE Indicator Tool and interpretation of results.
The Your Results column on the Summary of Results worksheet gives the
average score for your responses to the questions that relate to each of the
stressors.
The colour coding allows you to assess how you are currently performing when
compared with the top 20%, average and bottom 20% of the scores of employees
responding to the same questions as part of a nationwide survey of psychosocial
working conditions1.
Suggested Interim Target
The Suggested Interim Target column gives the target score that we suggest that
you aim for in the short term (for example, the next 6 to 12 months) when you next
measure your performance using the Indicator Tool. It is calculated using a ‘rule of
thumb’ formula that relates your scores to the scores from the national survey. The
formula suggests that proportionately larger improvement ‘steps’ are required the
lower your initial scores (compared with the national survey scores) and
proportionately smaller improvement ‘steps’ are required the higher your initial
scores.
Suggested Longer Term Target
The Suggested Longer Term Target represents the score for each of the
stressors recorded by the top 20% of the national survey respondents. If you have
reached this target score, we suggest that you continue to set your own targets for
continuous improvement.
‘QUESTION BY QUESTION’ SCREEN
In addition to the information on the Summary of Results screen, the Question
by Question screen allows you to obtain a more detailed picture. It enables you to
see how the average scores of those responding to each question in the Indicator
Tool compare with the average responses of the national survey respondents to the
respective questions. It is suggested that this may prove helpful as a prompt to
1
Health and Safety Executive (2004). Psychosocial Working Conditions in Great Britain in 2004. This was a
nationally representative household survey of approximately 1800 current workers conducted in March and April of
2004. The survey included the 35 question items representing the 6 Stress Management Standards areas. The full
survey report is available on the HSE website at www.hse.gov.uk/statistics/causdis/pwc2004.pdf.
20
discussions within focus groups but should not be interpreted as a definitive
assessment of your performance.
IMPORTANCE OF CONFIRMING RESULTS WITH YOUR EMPLOYEES
As suggested at ‘Step 3’ of the Stress Management Standards Website (‘Evaluate
the risks and take action’), we recommend that you confirm all your survey results
with your employees (for example, in focus groups) to assess whether the results
highlight a potential problem area for your organisation. This is particularly important
when you are considering responses to individual questions. The comparisons of
such responses with the national survey results should be interpreted as ‘suggestive’
or as a ‘prompt for discussion’ only.
APPLYING THE CATEGORY FILTER TO RESULTS FOR SMALL
NUMBERS OF EMPLOYEES
If you use the Category Filter facility and there are fewer than 10 people in the group
you have selected, the Category Filter facility will return the message ‘The filter
returned too few results to analyse. Your filter selection has been cancelled’. To
protect the anonymity of respondents when reporting results, the filter does not allow
for analysis of results for fewer than 10 participants. However, it is possible to access
such information using the Raw Data worksheet of the HSE Management Standards
Analysis Tool. It is recommended that survey coordinators within organisations
exercise discretion in providing wider access to the Raw Data worksheet.
Appendix B describes the technical information and procedures used in the
calculation of current performance and targets.
21
APPENDIX B
TECHNICAL INFORMATION AND PROCEDURES USED IN THE
CALCULATION OF CURRENT PERFORMANCE AND TARGETS
‘SUMMARY OF RESULTS’ WORKSHEET
Table 1 contains data from the HSE survey Psychosocial Working Conditions in
Great Britain 2004. Table 1 shows the scores by cumulative percentiles of the score
distributions for Demands, Control, Managerial Support, Peer Support, Relationships,
Role and Change. (Please note that the order of these factors differs from the order
given in Table 5 of the above survey report, in that Relationships appears before
Role in Table 1).
Your Results
Table 2 shows the rules governing the colour coding cut-offs used in presenting the
results in the Your Results column of the Summary of Results worksheet.
These rules are derived from the data in Table 1.
Note:
•
•
•
The survey results for the Role stress factor indicate that a very large
proportion of the people responding to the national survey scored 5 on the
questions relating to Role.
One consequence of this is that an organisation may achieve what appears to
be a fairly high score on Role (e.g. 4.2) and yet find that they fall below the
20th percentile for that factor when compared with the national survey results.
As noted in Annex A, it is important to confirm your organisation’s survey
results with your employees. This is particularly strongly recommended for
results for the Role stress factor, where the national survey results are so
heavily skewed.
Suggested Interim Target
The procedure for working out the Suggested Interim Target for any given
stressor is a pragmatic ‘rule of thumb’ procedure. The procedure is described below.
•
•
•
•
•
The percentiles, from 5 to 80, at intervals of 5, and their associated values are
stored in an array – these are derived from the data in Table 1.
The average score for the results entered to date (the figure in the Your
Results column of the Summary of Results worksheet) is compared with
the percentile values and the nearest value is selected (the highest value is
selected in the case of ties).
The percentile associated with that value is subtracted from 100, the
difference divided by 5;
The value obtained is added to the original percentile: that value is then
rounded to the nearest 5;
The value associated with the resulting percentile is the Suggested Interim
Target.
22
Note:
•
•
The procedure ensures that scores that fall below the 20th percentile are
always set a Suggested Interim Target at least equivalent to the 25th
percentile score.
If an organisation scores at or above the 80th percentile on one of the stress
factors, the procedure returns a message suggesting that they set their own
interim and longer-term targets for continuous improvement.
Suggested Longer Term Target
The Suggested Longer Term Target scores are derived from the 80th percentile
figures in Table 1.
‘QUESTION BY QUESTION’ WORKSHEET
Table 3 shows the scores by cumulative percentiles of the score distributions for
each of the individual questions grouped together under the factors Demands,
Control, Managerial Support, Peer Support, Relationships, Role and Change. This
data is taken from the HSE survey Psychosocial Working Conditions in Great Britain
2004.
Table 4 shows the rules governing the colour coding cut-offs used in presenting the
results in the Question by Question worksheet. These rules are derived from the
data in Table 3.
Note:
•
•
•
•
Please note the caveats in Appendix A on use and interpretation of the
results, particularly the results for individual questions.
For many questions it was not possible to set precise cut-offs: those provided
should be interpreted as rough approximations.
For many of the questions (including all of the Role questions and most of the
Peer Support and Relationships questions) it was not possible to set any cutoffs for the 50th-80th percentile range.
For Question 21 I am subject to bullying at work:
o a score of anything less than 5 triggers a red colour-coding, since this
falls below the 20th percentile of the scores recorded by the
respondents to the 2004 national representative household survey
(see footnote 1 Appendix A);
o Please note the strong recommendation in Appendix A on the
importance of confirming your survey results with your employees.
Please note, in particular, the caveat regarding interpretation of results
for individual questions;
o Appendix A recommends that comparisons of such responses with the
national survey results should be interpreted as ‘suggestive’ or as a
‘prompt for discussion’ only;
o If any members of staff score 1, 2 or 3 on question 21, the worksheet
returns a message highlighted in red to the effect that “* x (number
plus percentage of respondents) of your staff report that they are
always, often or sometimes bullied.”
o This above feature of the HSE Management Standards Analysis Tool
is included in response to comments received during the Management
Standards Pilots and in the course of consultations with various
23
stakeholders. Many people considered that any level of bullying was
unacceptable and that any reported bullying should be highlighted as
an issue that might warrant further exploration, for example, during
focus groups.
24
Table 1. Psychosocial Working Conditions in Great Britain 2004 Report - Percentile Figures for Each Standard
Percentiles
1
Demands
Control
Management
Support
Peer Support
5
10
15
20
25
30
35
40
45
1.397 2.125
2.5
2.75 2.875
3
3.125 3.25 3.375
3.5
095
1.254 1.8333 2.1666 2.3333 2.6666 2.8333
3
3.1666 3.1666 3.3333
992
33
67
33
67
33
67
67
33
1.4
2
2.4
2.75
3
3
3.2361 3.4
3.6
3.6
81
1.75
Relationships
Role
Change
2.5
2.75
3.25
2
3
3.25
3.2
3.8
4
1 1.6666
67
3.3333
33
3.5
3.75
3.5
3.75
3.75
4
50
55
60
65
70
75
80
85
90
95
99
3.5
3.625
3.75
3.875
4
4.125
4.25
4.375
4.5
4.75
5
3.5
3.6666 3.8333 3.8333
67
33
33
4
4
4.2
4
4.1666 4.3333
67
33
4.4
4.6
3.8
4
4
4.25
3.75
4
4
4
4.25
4.25
4.6
4.6
4.8
4.8
5
5
2 2.3333 2.6666 2.6666
33
67
67
3
4.2
4.4
4.25
4.25
4.2
4.5
4.5
4.75
4.5
4.6666 4.8333
67
33
4.8
5
4.6
4.75
5
5
5
5
5
4.25 4.2642
14
5
5
4.5
4.5
4.5
4.75
4.75
5
5
5
5
5
5
5
5
5
5
5
3 3.3333 3.3333 3.6666 3.6666 3.6666
33
33
67
67
67
4
4
4
4 4.3333 4.6666 4.6666
33
67
67
5
Table 2: ‘Summary of Results’ Worksheet - Rules Governing Colour Coding Cut-offs for Each Standard
Red
Factor
th
< 20 percentile
Yellow
th
Aqua
th
>= 20 & < 50
percentile
th
Green
th
>= 50 & < 80
percentile
>= 80th percentile
Demands
< 2.875
>= 2.875 & < 3.5
>= 3.5 & < 4.25
>= 4.25
Control
Managers’ support
Peer support
Relationship
Role
Change
< 2.666667
<3
< 3.333333
< 3.75
< 4.4
< 2.666667
>= 2.666667 & < 3.5
>= 3 & < 3.8
>= 3.333333 & < 4
>= 3.75 & < 4.25
>= 4.4 & <5
>= 2.666667 & < 3.666667
>= 3.5 & < 4.333333
>= 3.8 & < 4.6
>= 4 & < 4.75
>= 4.25 & < 4.75
No aqua
>= 3.666667 & < 4
>= 4. 333333
>= 4. 6
>= 4. 75
>= 4.75
=5
>= 4
25
Table 3: Percentile Figures for Each Question – Grouped by Standard
Percentiles
3
6
9
12
16
18
20
22
Demands
1
5
10
15
20
25
30
35
40
45
50
55
60
65
70
75
80
85
90
95
99
Different groups at work demand things from me
that are hard to combine
I have unachievable deadlines
I have to work very intensively
I have to neglect some tasks because I have too
much to do
I am unable to take sufficient breaks
I am pressured to work long hours
I have to work very fast
I have unrealistic time pressures
1
2
2
2
3
3
3
3
3
3
4
4
4
4
4
4
5
5
5
5
5
1
1
1
2
1
1
2
1
2
3
1
2
3
2
2.09
3
2
3
3
2
3
3
2
3
3
2
3
4
2
3
4
3
3
4
3
3
4
3
3
4
3
4
5
3
4
5
3
4
5
3
4
5
3
4
5
4
5
5
5
5
5
5
5
1
1
1
1
1
2
1
1
2
5
2
2
1
2
10
3
2
2
2
15
3
2
2
3
20
3
3
2
3
25
3
3
2
3
30
4
3
3
3
35
4
3
3
3
40
4
3
3
3
45
4
4
3
4
50
4
4
3
4
55
4
4
3
4
60
5
4.7
3
4
65
5
5
3
4
70
5
5
3
4
75
5
5
4
5
80
5
5
4
5
85
5
5
5
5
90
5
5
5
5
95
5
5
5
5
99
1
1
1
1
1
1
1
1
2
1
2
2
1
5
1
2
1
3
3
1
10
2
3
1
3
3
2
15
3
3
2
3
4
2
20
3
3
2
3
4
2
25
3
3
3
3
4
3
30
4
3
3
4
4
4
35
4
3.08
3
4
4
4
40
4
4
3
4
4
4
45
5
4
3
4
4
4
50
5
4
3
4
4
4
55
5
4
4
4
4
4
60
5
4
4
4
5
4
65
5
5
4
5
5
5
70
5
5
4
5
5
5
75
5
5
5
5
5
5
80
5
5
5
5
5
5
85
5
5
5
5
5
5
90
5
5
5
5
5
5
95
5
5
5
5
5
5
99
1
1
1
1
2
2
2
2
2
2
3
3
3
3
3
3
3
3
3
4
3
4
4
4
4
4
4
4
4
5
4
5
5
5
5
5
5
5
5
5
5
5
1
2
3
3
3
4
4
4
4
4
4
4
5
5
5
5
5
5
5
5
5
1
2
2
3
3
3
3
3
4
4
4
4
4
4
4
4
5
5
5
5
5
1
1
2
5
2
10
2
15
3
20
3
25
3
30
4
35
4
40
4
45
4
50
4
55
4
60
4
65
5
70
5
75
5
80
5
85
5
90
5
95
5
99
If work gets difficult, my colleagues will help me
I get help and support I need from colleagues
I receive the respect at work I deserve from my
colleagues
My colleagues are willing to listen to my workrelated problems
1
1
1
1
2
2
2
3
3
3
3
3
3
4
4
3
4
4
3
4
4
3
4
4
4
4
4
4
4
4
4
4
4
4
4
4
4
4
4
4
4
4
5
5
5
5
5
5
5
5
5
5
5
5
5
5
5
5
5
5
5
5
5
2
2
3
3
4
4
4
4
4
4
4
4
4
4
5
5
5
5
5
5
5
Relationships
1
5
10
15
20
25
30
35
40
45
50
55
60
65
70
75
80
85
90
95
99
I am subject to personal harassment in the form
of unkind words or behaviour
There is friction or anger between colleagues
I am subject to bullying at work
Relationships at work are strained
2
3
3
4
4
4
4
4
5
5
5
5
5
5
5
5
5
5
5
5
5
1.2999
2
1
2
4
2
2
4
2
3
5
2
3
5
2.0926
3
5
3
3
5
3
3
5
4
3
5
4
3
5
4
3
5
4
4
5
4
4
5
4
4
5
4
4
5
4
4
5
4
4
5
4.9074
5
5
5
5
5
5
5
5
5
5
5
5
Role
1
5
10
15
20
25
30
35
40
45
50
55
60
65
70
75
80
85
90
95
99
I am clear what is expected of me at work
I know how to go about getting my job done
I am clear what my duties and responsibilities are
I am clear about the goals and objectives for my
department
I understand how my work fits into the overall aim
of the organisation
3
3
3
2
4
4
4
3
4
4
4
4
4
4
4
4
4
4
4
4
5
4.25
5
4
5
5
5
5
5
5
5
5
5
5
5
5
5
5
5
5
5
5
5
5
5
5
5
5
5
5
5
5
5
5
5
5
5
5
5
5
5
5
5
5
5
5
5
5
5
5
5
5
5
5
5
5
5
5
5
5
5
5
5
5
2
3
4
4
4
4
5
5
5
5
5
5
5
5
5
5
5
5
5
5
5
Change
1
5
10
15
20
25
30
35
40
45
50
55
60
65
70
75
80
85
90
95
99
I have sufficient opportunities to question
managers about change at work
Staff are always consulted about change at work
When changes are made at work, I am clear how
they will work out in practice
1
1
2
2
2
3
3
4
4
4
4
4
4
4
4
4
5
5
5
5
5
1
1
1
2
2
2
2
2
2
2
2
3
2
3
3
3
3
3
3
3
4
4
4
4
4
4
4
4
4
4
4
4
4
4
4
4
5
5
5
5
5
5
Control
2
10
15
19
25
30
I can decide when to take a break
I have a say in my own work speed
I have a choice in deciding how I do my work
I have a choice in deciding what I do at work
I have some say over the way I work
My working time can be flexible
Managers’ Support
8
23
29
33
35
I am given supportive feedback on the work I do
I can rely on my line manager to help me out with
a work problem
I can talk to my line manager about something
that has upset or annoyed me about work
I am supported through emotionally demanding
work
My line manager encourages me at work
Peer Support
7
24
27
31
5
14
21
34
1
4
11
13
17
26
28
32
26
Table 4: Question by Question Worksheet - Rules Governing Colour Coding Cut-offs for Each Question
Aqua
Green
< 20 Percentile
Red
>= 20 & < 50 Percentile
>= 50 & < 80 Percentile
>= 80 Percentile
Different groups at work demand things from me
that are hard to combine
I have unachievable deadlines
<3
>= 3 & < 4
>= 4 & < 4.95
>= 4.95
<3
>= 3 & < 4
>= 4 & < 4.95
>= 4.95
I have to work very intensively
I have to neglect some tasks because I have too
much to do
I am unable to take sufficient breaks
I am pressured to work long hours
I have to work very fast
I have unrealistic time pressures
<2
< 2.09
>= 2 & < 3
>= 2.09 & < 3
None
>= 3 & < 4
>= 3
>= 4
<3
<2
<2
<3
>= 3 & < 4
>= 2 & < 4
>= 2 & < 3
>= 3 & < 4
>= 4 & < 4.95
>= 4 & < 4.95
>= 3 & < 4
>= 4 & < 4.95
>= 4.95
>= 4.95
>= 4
>= 4.95
Approx.
Approx.
Approx.
<3
<3
<2
<3
<4
<2
>= 3 & < 4.95
>= 3 & < 4
>= 2 & < 3
>= 3 & < 4
>= 4 & < 4.95
>= 2 & < 4
None
>= 4 & < 4.95
>= 3 & < 4.95
>= 4 & < 4.95
None
>= 4 & < 4.95
>= 4.95
>= 4.95
>= 4.95
>= 4.95
>= 4.95
>= 4.95
Not possible to set cut-offs for the 50th-80th percentile range
Approx.
Approx.
Approx.
Not possible to set cut-offs for the 50th-80th percentile range
Approx.
<2
<2
>= 2 & < 3
>= 2 & < 4
>= 3 & < 4.95
>= 4 & < 4.95
>= 4.95
>= 4.95
<3
>= 3 & < 4
>= 4 & < 4.95
>= 4.95
<3
>= 3 & < 4
>= 4 & < 4.95
>= 4.95
<3
>= 3 & < 4
>= 4 & < 4.95
>= 4.95
<3
<4
<4
>= 3 & < 4
>= 4 & < 4.95
>= 4 & < 4.95
>= 4 & < 4.95
None
None
>= 4.95
>= 4.95
>= 4.95
Not possible to set cut-offs for the 50th-80th percentile range
Not possible to set cut-offs for the 50th-80th percentile range
<4
>= 4 & < 4.95
None
>= 4.95
Not possible to set cut-offs for the 50th-80th percentile range
<4
>= 4 & < 4.95
None
>= 4.95
Not possible to set cut-offs for the 50th-80th percentile range
<3
<5
< 2.09
>= 3 & < 4
None
>= 2.09 & < 4
None
None
>= 4 & < 4.91
>= 4
5
>= 4.91
Not possible to set cut-offs for the 50th-80th percentile range
Anything < 5 falls below 20th percentile
<4
<4
<4
<4
>= 4 & < 4.95
>= 4 & < 4.95
>= 4 & < 4.95
>= 4 & < 4.95
None
None
None
None
>= 4.95
>= 4.95
>= 4.95
>= 4.95
Not possible to set cut-offs for the 50th-80th percentile range
Not possible to set cut-offs for the 50th-80th percentile range
Not possible to set cut-offs for the 50th-80th percentile range
Not possible to set cut-offs for the 50th-80th percentile range
<4
>= 4 & < 4.95
None
>= 4.95
Not possible to set cut-offs for the 50th-80th percentile range
<2
>= 2 & < 4
>= 4 & < 4.95
>= 4.95
<2
<2
>= 2 & < 4
>= 2 & < 4
>= 4 & < 4.95
>= 4 & < 4.95
>= 4.95
>= 4.95
th
th
Yellow
th
th
th
th
Comments
Demands
3
6
9
12
16
18
20
22
Not possible to set cut-offs for the 50th-80th percentile range
Approx.
Control
2
10
15
19
25
30
I can decide when to take a break
I have a say in my own work speed
I have a choice in deciding how I do my work
I have a choice in deciding what I do at work
I have some say over the way I work
My working time can be flexible
Managers’ Support
8
23
29
33
35
I am given supportive feedback on the work I do
I can rely on my line manager to help me out with a
work problem
I can talk to my line manager about something that
has upset or annoyed me about work
I am supported through emotionally demanding
work
My line manager encourages me at work
Peer Support
7
24
27
31
If work gets difficult, my colleagues will help me
I get help and support I need from colleagues
I receive the respect at work I deserve from my
colleagues
My colleagues are willing to listen to my workrelated problems
Relationships
5
14
21
34
I am subject to personal harassment in the form of
unkind words or behaviour
There is friction or anger between colleagues
I am subject to bullying at work
Relationships at work are strained
Role
1
4
11
13
17
I am clear what is expected of me at work
I know how to go about getting my job done
I am clear what my duties and responsibilities are
I am clear about the goals and objectives for my
department
I understand how my work fits into the overall aim of
the organisation
Change
26
28
32
I have sufficient opportunities to question managers
about change at work
Staff are always consulted about change at work
When changes are made at work, I am clear how
they will work out in practice
27
Approx.
Approx.
APPENDIX C
CSV FORMAT REQUIREMENTS FOR USERS WISHING TO EXPORT
DATA FROM OTHER SOFTWARE APPLICATIONS IN A FORMAT
SUITABLE FOR IMPORT INTO THE HSE MANAGEMENT STANDARDS
ANALYSIS TOOL
INTRODUCTION
This is a note for users of online data gathering software that has been used to
emulate the HSE Management Standards Indicator Tool questionnaire.
Where there is a requirement to process and analyse questionnaire data using the
HSE Management Standards Analysis Tool, users of the software will be required to
export data from their application in a format suitable for import into the HSE
Management Standards Analysis Tool. As the tool takes the form of a Microsoft
Excel spreadsheet, the most suitable export format is CSV.
The HSE Management Standards Analysis Tool includes a facility for importing and
processing CSV data. The processing includes validation of inputs and conversion of
category indices.
FORMAT
The facility expects one or more rows in the CSV file. The first row (which is ignored)
typically looks like this:
Record No,Category A,Category B,Category C,Category D,Category E,Category
F,Category G,Category H,Category I,Category J,Category K,Category L,Question
1,Question 2,Question 3,Question 4,Question 5,Question 6,Question 7,Question
8,Question 9,Question 10,Question 11,Question 12,Question 13,Question
14,Question 15,Question 16,Question 17,Question 18,Question 19,Question
20,Question 21,Question 22,Question 23,Question 24,Question 25,Question
26,Question 27,Question 28,Question 29,Question 30,Question 31,Question
32,Question 33,Question 34,Question 35
Each subsequent row is ordered as follows:
<ord>, <cat 1>, <cat 2>, ...<cat n>, <resp 1>, <resp 2>, …<resp m>
where:
ord is simply a counter, usually starting with 1.
cat is an integer that refers to an option in a set for a given category.
resp is an integer equivalent to a response number for an Indicator Tool question.
For versions of the HSE Management Standards Analysis Tool up to and including
1.3, n (the number of categories) is 4. For later versions, n is currently 12. m (the
number of questions) is 35.
28
EXAMPLE
There follows an example of a typical category set-up, completed questionnaire, and
resulting CSV row.
The survey coordinator requires the ability to filter data according to participants’
location and pay grade. A participant can optionally not specify their location, but
must specify their pay grade. In the HSE Management Standards Analysis Tool,
categories would be set up like this:
Category A
<None>
London
Cardiff
Belfast
Edinburgh
Category B
Band 1
Band 2
Band 3
A participant completes the questionnaire online using the following responses:
Belfast
Band 1
Never
Seldom
Sometimes
Often
Always
Never
Seldom
Sometimes
Often
Always
Never
Seldom
Sometimes
Often
Always
Never
Seldom
Sometimes
Often
Always
Never
Seldom
Sometimes
Often
Always
Never
Seldom
Sometimes
Agree
Strongly agree
Strongly disagree
Disagree
Neutral
Agree
29
Strongly agree
Strongly disagree
Disagree
Neutral
Agree
Strongly agree
If using version 1.4 or later of the HSE Management Standards Analysis Tool, the
CSV row will be this:
1,3,1,0,0,0,0,0,0,0,0,0,0,1,2,3,4,1,5,2,3,2,5,1,4,3,2,5,5,2,3,4,1,5,4,3,4,5,1,2,3,4,5,1,2,
3,2,5
The first digit (1) is the ordinal and could be any positive number in a sequence.
The next 12 digits (3,1,0,0,0,0,0,0,0,0,0,0) are indices into the survey coordinators
category configuration. So 3 is the third item in the location category (A), 1 is the first
item in the pay grade category (B). Note that the option <None> is always identified
with zero (0), as is an unused category.
The final 35 digits are question response numbers. Refer to the HSE Indicator Tool to
view how these numbers equate to actual responses (the HSE Indicator Tool is
available as a download at http://www.hse.gov.uk/stress/standards/downloads.htm).
Any of these digits may be replaced by a zero (0); this would indicate that the
participant did not answer the question.
Finally, note that the digits are separated using commas. Another separator may be
used provided it can be represented with an ASCII code.
30
APPENDIX D
KNOWN ISSUES / FREQUENTLY ASKED QUESTIONS
Limitation on numbers of records
The HSE Management Standards Analysis Tool is not designed to cope with more
than 40 thousand records. If you need to analyse more than 40 thousand records,
then you must split the records into separate batches and analyse each batch using
a separate version of the HSE Management Standards Analysis Tool.
Time taken to analyse records when using the Category Filter facility
If you use the Category Filter facility to analyse large numbers of records and then
select the Summary of Results or Question by Question worksheets, there will
be a short delay while the HSE Management Standards Analysis Tool processes the
data and updates the figures in the worksheets.
31