1
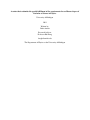
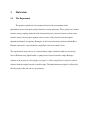
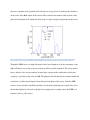
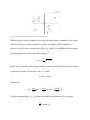
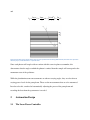
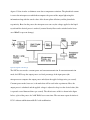
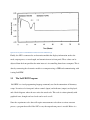
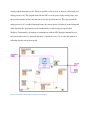
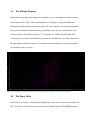
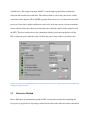
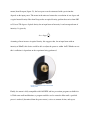
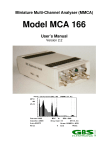
Automation of
Photoluminescence
Measurements of Polaritons
Drake Austin
2011-04-26
Methods of automating experiments that involve the variation of laser power are discussed. In
particular, the automation of photoluminescence measurements of polaritons is examined
through the use of various programs and devices such as a laser power controller and a
spectrometer. Additionally, the theory behind the experiment and the laser power controller is
briefly discussed.
A senior thesis submitted in partial fulfillment of the requirements for an Honors degree of
Bachelor of Science in Physics
University of Michigan
2011
Written by:
Drake Austin
Research Advisor:
Professor Hui Deng
[email protected]
The Department of Physics at the University of Michigan
Acknowledgements
I would like to thank Professor Hui Deng for accepting me as her student and allowing me to
gain research experience in her lab since the beginning of the summer of 2010. The experience
and knowledge I’ve gained has been an extremely important aspect of my undergraduate career
and will no doubt prove useful in graduate school. I’d also like to thank her graduate students
Paul Bierdz, Bo Zhang, and Lei Zhang. Their willingness to help me throughout my time in the
lab has been tremendously useful and has encouraged me to continue my studies in physics. In
particular, I’d like to thank Paul for his constant guidance and mentorship, which contributed
significantly to my development as a physicist and as a person.
Contents
1
2
Motivation
1.1
The Experiment ….………………………………………………………………..5
1.2
Theory …………………………………………………………………………….6
Automation Design
2.1
The Laser Power Controller ………………………………………………………9
2.2
The LabVIEW Program …………………………………………………………14
2.3
The WinSpec Program …………………………………………………………..16
2.4
The Power Meter ……………………………………………………………...…16
2.2
Alternative Method ……………………………………………………………...17
3
Conclusions
4
References
1
Motivation
1.1
The Experiment
The primary experiment to be automated involves the measurement of the
photoluminescence from quasi-particles known as exciton-polaritons. These particles are formed
from the strong coupling of photons with electron-hole pairs (excitons). Interest in them stems
from the study of macroscopic quantum states-systems on the classical scale that require
quantum mechanical descriptions. Examples of such states other than polaritons include BoseEinstein condensates, superconductors, superfluids, and, most notably, lasers.
The experimental setup consists of a semiconductor sample contained within a cryostat kept
below 10 Kelvin using liquid helium. A pump beam is focused onto the sample through a
window in the cryostat at a fixed angle (see figure 1). A fiber-coupled lens is placed at a fixed
distance from the sample but with a variable angle. The photoluminescent signal is collected by
this fiber-optic cable and sent to a spectrometer.
Figure 1: Experimental setup for photoluminescence measurements [1]
1.2
Theory
It is this signal that is of interest here: it consists of photons emitted from the decay of polaritons
within the semiconductor. The wavelength of this signal will correspond to the energy of the
polaritons while, less obviously, the collection angle will correspond to their momentum state.
To develop a qualitative understanding of why this is, it is first necessary to examine what is
happening within the semiconductor. The sample itself consists of a cavity layer with index of
refraction sandwiched between two distributed Bragg reflectors (DBRs). A DBR is a structure
formed by alternating layers of material with different indices of refraction, resulting in very
high reflectivity for a range of wavelengths. This occurs due to the constructive interference of
many partially reflected waves whose wavelengths are roughly four times the optical thickness
of the layers. Since the DBR material has a wider bandgap than the semiconductor material in
between, a quantum well (potential well with discrete energy levels) is formed with a thickness
on the order of the Bohr radius of the exciton. This constricts the motion of the excitons to the
plane of the quantum well, which will allow them to couple strongly with photons in the cavity.
Figure 2: Reflection spectrum of a DBR with alternating indices of refraction of 3.47 and 2.97 and a central wavelength
of =767.3nm. There are N layers with a refractive index of 2.97 and N+1 layers with a refractive index of 3.47 [1].
Though the DBRs have very high reflectance for the wavelengths used in the experiment, some
light will find its way to the cavity layer where it will be partially contained. The cavity quality
factor, defined as the average number of round trips a photon makes within the cavity before
escaping, is typically on the order of 1000. The photon field will therefore be confined within the
z-direction (as defined in the figure below) but not in the plane of the cavity. Since the DBR
consists of two materials with different indices of refraction alternating, the overall effect is for
the incident light to be refracted as though it were going from a vacuum (above the DBR) to a
refractive index (the cavity):
Figure 3: Effective refraction of incident light that reaches the cavity.
While the light is confined within the cavity, photons with in-plane wavenumber will couple
with electron-hole pairs that have the same in-plane wavenumber. The wavenumber ,
however, will be fixed at a constant value of 2
/ where is the DBR central wavelength.
The energy dispersion of the cavity will be given by[1]
.
By the same reasoning as before, light leaving the sample from the cavity will effectively follow
a path shown in figure 4. From Snell’s law, we see that
sin sin and therefore
2
2
tan tan !" # #.
Using the approximation $ and the small angle approximation for , we find that
tan θ & θ
and
&
2
2
2
θ
!" # &
.
Figure 4: Illustration of the sample where the gray areas represent the alternating DBR materials, the white area represents
the cavity layer, and the black line is a quantum well.
Since each photon will couple with an exciton with this same in-plane wavenumber, this
demonstrates that the angle at which the photon is emitted from the sample will correspond to the
momentum state of the polaritons.
While the photoluminescence measurements are taken at varying angles, they are also taken at
varying power levels for the pump beam. These are the measurements that are to be automated.
In order to do this, a method of automatically adjusting the power of the pump beam and
recording the data from the spectrometer is needed.
2
Automation Design
2.1
The Laser Power Controller
The power will be varied throughout the experiments with the use of a laser power
controller (LPC) from Brockton Electro-Optics Corp. One of the primary components of the LPC
is a liquid crystal modulator, pictured below. A liquid crystal is composed of elongated organic
molecules that may flow but also possess an orientational order. There are various types of liquid
crystals but only what are known as nematic liquid crystals will be discussed here. The
molecules of such liquid crystals are oriented along the same direction but their positions are
completely random. Light polarized parallel to the orientation of these molecules sees a higher
index of refraction than light polarized perpendicular to them. Additionally, the orientation of the
molecules can be rotated by the application of an electric field. Electric dipoles are induced and
the electric forces exert torques on the molecules, minimizing the electrostatic energy. It is these
properties that make liquid crystals useful in optical devices.
Figure 5: Liquid crystals with different applied voltages [3]
A nematic liquid crystal can be twisted by placing it between two glass plates and rubbing it so
that orientation of the molecules rotates about the normal to the plates. The figure below shows
this twist by taking cross sections of the material perpendicular to the axis of the twist.
Figure 6: Twisted nematic crystal
If the angle at which the orientation of the molecules is rotated varies linearly with z such that
'(,
then the phase-retardation per unit length will be given by
* +, - . /0
where ' is known as the twist coefficient, , is the extraordinary index of refraction (along the
optical axis), . is the ordinary index of refraction, and 0 is the wavenumber of the incident
light in a vacuum. If * 1 ' (so that the phase is retarded through many cycles before changes
significantly), then the Jones matrix of such an optical device of width 2 will be given by[4]
*2
exp 9:
0
2
3 4+-'2/ 5
<.
*2
0
exp 9
:
2
In other words, if the incident light is linearly polarized along the x-direction, then the device
will act as a polarization rotator with rotation angle '2. By applying an electric field along the
axis of twist, it is possible to impose an additional twist to the nematic liquid crystal. If the field
is sufficiently strong, it can become completely untwisted. With the addition of a polarizer at the
end, it can be used as a voltage controlled intensity modulator:
Figure 7: a) No electric field present, light is fully transmitted. b) Sufficiently strong electric fields can effectively undo the
twist of the nematic liquid crystal so that almost no light is transmitted. At intermediate rotations, the light is partially
transmitted [4].
When the electric field is removed, the molecules realign themselves to their original position
due to the orientation of the layers near the surface (which do not lose their twisted structure).
The liquid crystal effectively has a “memory,” allowing it to be reused consistently.
This is the method through which the LPC modulates incident laser light. As seen in the diagram
below, vertically polarized light is sent through the liquid crystal modulator (the optional input
polarizer is used if the beam is not vertically polarized) and the output polarizer, modulating the
light by a factor that depends on the voltage applied to the liquid crystal. The beam-splitter
transmits 98% of the incident light (which then passes through the output aperture) and reflects
2% toward a precision photodiode. The temperature of this diode is kept constant at 33±0.05
degrees Celsius in order to eliminate error due to temperature variations. The photodiode current
is sent to the microprocessor which then computes the power of the output light using this
information along with the stored values of the beam-splitter efficiency and the photodiode
responsivity. Based on the power, the microprocessor can vary the voltage applied to the liquid
crystal until the desired power is reached (a neutral density filter can be switched on for lasers
over 200mW to prevent damage).
Figure 8: Diagram of the LPC [2].
The LPC has two modes: constant power and constant transmission. In constant transmission
mode, the LPC keeps the output power at a fixed percentage of the input power (the
microprocessor computes the output power and adjusts the applied voltage twice per second).
Constant power mode, however, is the mode that will be used in the experiments. Here, the
output power is calculated and the applied voltage is adjusted to keep it at the desired value (this
is repeated several thousand times per second). The effectiveness of this is shown in the figure
below, a plot of the power of a 2mW HeNe laser versus time. The root mean square deviation is
0.79% without stabilization and 0.02% with stabilization.
Figure 9: Plot of power of 2mW HeNe laser before and after stabilization [2]
Finally, the LPC is connected to an electronics module that displays information such as the
mode, output power, set wavelength, and transmission on its front panel. These values can be
adjusted from the front panel but the main interest is in controlling them from a computer. This is
done by connecting the electronics module to a computer using a GPIB and communicating with
it using LabVIEW.
2.2
The LabVIEW Program
LabVIEW is a visual programming language commonly used in the automation of laboratory
setups. It consists of a front panel, where controls (input) and indicators (output) are displayed,
and a block diagram, where the user writes the actual code. This code is written primarily with
graphical icons, though text based code can be used as well.
Since the experiments to be done will require measurements to be taken at various constant
powers, a program that will tell the LPC to vary the output beam power is needed. Below is a
simple program that achieves this. The user specifies a time to wait, an interval, and starting and
ending power levels. The program then tells the LPC to set the power to the starting value, wait
the specified amount of time, and then lower it by the specified interval. This repeats until the
ending power level is reached. During this time, the current power is displayed on the front panel
while data from the spectrometer can be automatically recorded using a program called
WinSpec. Unfortunately, all attempts to communicate with the LPC through computer have so
far been unsuccessful (it’s suspected that there’s a hardware issue). As a result, this method of
collecting data has not yet been tested.
Figure 10: Screenshot of block diagram for power control program.
2.3
The WinSpec Program
Data from the spectrometer including plots of intensity versus wavelength need to be recorded at
various power levels. This is achieved through the use of WinSpec, a program by Princeton
Instruments designed for the spectrometer made by the same company. One feature of particular
interest in the automation of measurements is the ability to take and save measurements over a
set period of time, demonstrated in figure 11. Ten spectra of a 765nm were taken with a 0.5
second exposure. A file for each individual spectrum was automatically saved. This would allow
the photoluminescent measurements to be automatically taken while the power control program
goes through a range of powers.
Figure 11: Ten spectra of a 765nm laser (intensity vs. wavelength), demonstrating the use of WinSpec in automation.
2.4
The Power Meter
It will also be necessary to ensure that the output beam power is truly at the level specified by the
LPC. To do this, we make use of a power meter from Thorlabs along with LabVIEW programs
available for it. The output beam from the LPC is sent through a partial mirror with known
reflection and transmission coefficients. The reflected beam is sent to the power meter, which
sends data to the computer. The LabVIEW program allows the user to read the current recorded
power level and, with a simple modification to the code, the beam power used in measurements
can be calculated from the reflection and transmission coefficient (similar to the method used in
the LPC). This data can then be used in conjunction with the power meter program to tell the
LPC to adjust the power until the value read from the power meter reaches a specified value.
Figure 12: Front panel of the LabVIEW program used with the power meter. Here, it’s reading a power of about 0.63mW due
to background light in the room.
2.5
Alternative Method
Due to difficulties in communicating with the LPC, an alternative method for controlling the
laser power is proposed here. By using a neutral density filter with a universal rotator (motorized
mount) from Newport (figure 13), the laser power can be attenuated with a precision that
depends on the input power. The motor in the universal rotator has a resolution of one degree and
a typical neutral density filter from Newport has an optical density gradient that varies from 0.05
to 2.0 over 270 degrees. Optical density for an input beam of intensity =0 and an output beam of
intensity = is given by
=0
>? log"0 9 : .
=
Assuming a linear increase in optical density, this suggests that, for an input beam with an
intensity of 50mW, this device would be able to adjust the power to within 1mW. Whether or not
this is sufficient is dependent on the experiment being performed.
Figure 13: Universal rotator with neutral
density filter.
Finally, the motor is fully compatible with LabVIEW and has pre-written programs available for
it. With some small modifications, a program could be used to rotate the filter until a specified
power is reached (determined from the power meter), wait a set amount of time, and repeat.
3
Conclusion
Though the LPC itself has been successful at adjusting the power of the input beam when
controlled through the front panel, further work is needed to successfully communicate with the
LPC so that it can be controlled by a computer. Slight alterations to the circuitry can be made to
allow for communication through an RS-232 cable. If such attempts also prove unsuccessful,
then it may be necessary to return it to the manufacturer to have it checked. If this problem can
be fixed, then a test of the methods to automatically take measurements can be done and any
necessary adjustments can be made. Additionally, the programs used could be modified to allow
for measurements in other experiments where a varying power level is needed.
4
References
[1] H. Deng, Dynamic condensation of semiconductor microcavity polaritons, thesis (Ph.D.),
Stanford University. (2006)
[2] Laser Power Controller User’s Manual, Brockton Electro-Optics Corp (2006)
[3] Bass. 2009. Handbook of Optics. 3rd Edition. McGraw-Hill Professional
[4] Saleh, Bahaa E. A., and Malvin Carl. Teich. Fundamentals of Photonics. Hoboken, WileyInterscience, 2007.