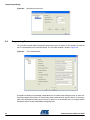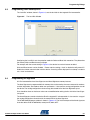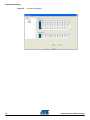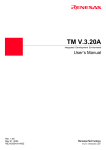
1
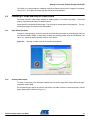
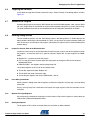
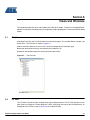
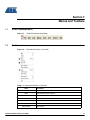
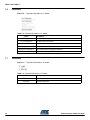
AT89LP Developer Studio .................................................................................................................... User Guide 3711B–MICRO–04/10 Table of Contents Section 1 1.1 About AT89LP Developer Studio ....................................................................................... 1-1 Section 2 2.1 2.2 2.3 Installing AT89LP Developer Studio .................................................................................. 2-1 2.1.1 System Requirements ......................................................................................... 2-1 2.1.2 Software Installation ............................................................................................ 2-1 Issues and Special Considerations.................................................................................... 2-2 2.2.1 .NET .................................................................................................................... 2-2 2.2.2 Java Runtime Environment.................................................................................. 2-2 Contact Information............................................................................................................ 2-3 Section 3 3.1 General Information ........................................................................................................... 3-1 3.2 Main Elements of LP Studio............................................................................................... 3-1 3.3 3.2.1 Solution View ....................................................................................................... 3-2 3.2.2 Output View ......................................................................................................... 3-2 3.2.3 Watch List ............................................................................................................ 3-2 Launching LP Studio and using the Project Wizard........................................................... 3-3 3.3.1 Open Existing Projects ........................................................................................ 3-3 3.3.2 Creating New Projects ......................................................................................... 3-3 Section 4 4.1 Terminology ....................................................................................................................... 4-1 4.2 Control Signals................................................................................................................... 4-1 4.3 Breakpoints ........................................................................................................................ 4-1 4.4 Debug Example ................................................................................................................. 4-2 4.5 Loading the Project ............................................................................................................ 4-2 4.6 Targeting the Simulator...................................................................................................... 4-3 4.7 Assemble the Program ..................................................................................................... 4-3 4.8 Entering Debug Session .................................................................................................... 4-3 4.8.1 Inspect the Internal State of the Microcontroller .................................................. 4-3 4.8.2 Issue Debug commands ...................................................................................... 4-3 4.8.3 Monitor the Target Registers ............................................................................... 4-3 4.8.4 Setting Breakpoints ............................................................................................. 4-3 4.8.5 Execute the Code and Halt on Breakpoint........................................................... 4-4 4.8.6 Single Step .......................................................................................................... 4-4 4.8.7 Execute the Code ................................................................................................ 4-4 AT89LP Developer Studio User Guide i 3711B–MICRO–04/10 Table of Contents (Continued) 4.8.8 Exit Debug ........................................................................................................... 4-4 Section 5 5.1 File View ............................................................................................................................ 5-1 5.2 I/O View ............................................................................................................................. 5-1 5.3 Info View ............................................................................................................................ 5-2 5.4 Project Configuration View................................................................................................. 5-3 5.5 Build View .......................................................................................................................... 5-3 5.6 Debug View........................................................................................................................ 5-4 5.7 Watch List .......................................................................................................................... 5-4 5.8 Static Memory View ........................................................................................................... 5-5 5.9 Editor Window.................................................................................................................... 5-5 5.10 Calculator Window ............................................................................................................. 5-5 5.11 Disassembly View.............................................................................................................. 5-8 5.12 Breakpoints ........................................................................................................................ 5-8 5.12.1 Types of Breakpoints ........................................................................................... 5-8 5.12.2 Range Breakpoints .............................................................................................. 5-9 5.12.3 Data Breakpoints ................................................................................................. 5-9 5.12.4 Link Breakpoints .................................................................................................. 5-9 5.12.5 Setting Breakpoints in the LP Studio User Interface............................................ 5-9 5.12.6 Adding Breakpoints .......................................................................................... 5-10 5.12.7 Removing Breakpoints....................................................................................... 5-10 5.12.8 Debugging with Breakpoints and Advanced Breakpoints .................................. 5-11 Section 6 6.1 Assembler and Compiler.................................................................................................... 6-1 Section 7 7.1 AT89LP Developer Menu................................................................................................... 7-1 7.2 File Menu ........................................................................................................................... 7-1 7.3 Edit Menu........................................................................................................................... 7-2 7.4 Debug Menu ...................................................................................................................... 7-3 7.5 Tools Menu ........................................................................................................................ 7-3 7.6 Chip Menu.......................................................................................................................... 7-4 7.7 View Menu ......................................................................................................................... 7-4 7.8 Window Menu .................................................................................................................... 7-5 7.9 Help Menu.......................................................................................................................... 7-5 7.10 Standard Toolbar ............................................................................................................... 7-6 7.11 Edit Toolbar........................................................................................................................ 7-6 7.12 Debug Toolbar ................................................................................................................... 7-6 7.13 Flow Control Toolbar.......................................................................................................... 7-6 ii 3711B–MICRO–04/10 AT89LP Developer Studio User Guide Table of Contents (Continued) Section 8 8.1 Port and Link Configuration ............................................................................................... 8-1 8.2 Programming Fuses........................................................................................................... 8-2 8.3 Programming Flash Security/Lock ..................................................................................... 8-3 8.4 Programming the Signature ............................................................................................... 8-3 Section 9 9.1 Revision History ................................................................................................................. 9-1 AT89LP Developer Studio User Guide iii 3711B–MICRO–04/10 Section 1 Introduction 1.1 About AT89LP Developer Studio Welcome to AT89LP Developer Studio from Atmel® Corporation. The AT89LP Developer Studio (“LP Studio”) is an Integrated Development Environment (IDE) for Atmel’s innovative family of LP (Low Power) single-cycle 8051 microcontrollers. LP Studio is designed for Microsoft Windows® 2000/Microsoft Windows XP/Microsoft Windows Vista®. LP Studio IDE allows project management, code-entry text editing, cycle-accurate simulation, In-CircuitEmulation, and On-Chip-Debug. LP Studio allows for developing application code either in Assembly Code or C-Programming languages. The advanced cycle-accurate LP Studio simulator enables designers to minimize the system frequency while still meeting the throughput requirements of the application. This is especially beneficial for designing low-power, battery-operated systems. LP Studio is a powerful development tool for LP applications. It can be downloaded for free by visiting Atmel’s website at www.atmel.com. Thank you for choosing Atmel AT89LP. AT89LP Developer Studio User Guide 1-1 3711B–MICRO–04/10 Section 2 Installation AT89LP Developer Studio supports all LP devices: AT89LP213/214/216 AT89LP428/828 AT89LP6440 2.1 Installing AT89LP Developer Studio 2.1.1 System Requirements The minimum hardware and software requirements are: 2.1.2 486 processor (Pentium® is recommended) 16MB RAM 12 MB free hard disk space Windows 2000/XP/Vista. Administrator privileges in your account 115200 Baud RS-232 port (COM port) 9-15V power supply, 500 mA minimum. Java® Runtime Environment (JRE), version 1.6.0 or later. Microsoft® .Net Framework, version 2.0 or later. Software Installation Download LP Studio from the Atmel website at www.atmel.com. Start the installation process by double-clicking on the installation file ‘AT89LP Developer Studio.msi’. The installation process will query a target folder. The default location for the folder is ‘C:\Program Files\Atmel\AT89LP Developer Studio\'. It is recommended to use the default location. The installation procedure will create an application shortcut on the Desktop and also under the ‘Start’ menu in ‘Programs->Atmel-> AT89LP Developer Studio’. The LP Studio installer will create a default project folder under ‘My Documents\ AT89LP Developer Studio\’ with a set of sample projects. AT89LP Developer Studio User Guide 2-1 3711B–MICRO–04/10 Installation 2.2 Issues and Special Considerations 2.2.1 .NET Microsoft .Net Framework must be installed on the computer in order to successfully install LP Studio. The minimum requirement is version 2.0. The easiest way to check the version of the .Net Framework installed on the computer is to query the ‘User Agent String’ of Internet Explorer web browser. Copy and paste “javascript:alert(navigator.userAgent)” into the address field of IE. A message box similar to the one shown in Figure 2-1 will appear showing the .NET version. Figure 2-1. Checking the version of Microsoft .Net Framework in IE. Another way to check the version of the .Net Framework installed on your computer is to open the registry editor (Start > Run > type "regedit" and press OK), browse to the folder ‘HKEY_LOCAL_MACHINE\SOFTWARE\Microsoft\NET Framework Setup\NDP’ and see if the version of the installed .Net Framework is 2.0 or later. The display should be similar to the one shown in Figure 2-2. Figure 2-2. 2.2.2 Checking the version of Microsoft .Net Framework in the registry editor. Java Runtime Environment Java Runtime Environment (JRE) must be installed on the computer in order to run the LP simulator platform in LP Studio. The minimum JRE version requirement is 1.6.0. To download the latest version of Java Runtime Environment, go to http://www.java.com/en/download/manual.jsp . To check the current version of JRE installed on the computer, open the registry editor (Start > Run > type "regedit" and press OK), browse to the folder ‘HKEY_LOCAL_MACHINE\SOFTWARE\JavaSoft\Java Runtime Environment’ and check if the version is 1.6.0 or later. Upon startup, LP Studio automatically runs a sequence of checks on the Java installation. If LP Studio encounters any problems with the Java installation, it will report error messages in the ‘Project Configuration’ tab of the ‘Output View’ (see section 3.2.2 ). There are two modes in LP Studio: simulate and 2-2 3711B–MICRO–04/10 AT89LP Developer Studio User Guide Installation device debug mode. If Java is improperly installed, “device debug” mode will still be able to excecute but “simulate” mode will be disabled. The Java Installation error messages are as follows: 1. "Unable to load Java Virtual Machine. Simulate mode is now disabled". – LP Studio detected an old version of JRE. Download the latest JRE version at http://www.java.com/en/download/manual.jsp to resolve the problem. 2.3 Contact Information Please report all problems or bugs to [email protected]. . Please include the LP Studio version number, a description of the problem and how it was triggered, and a test case, if possible. For LP Studio help, please call the microcontroller hotline at (408)487-2560. We also encourage the user to submit ideas for improving the LP Studio so we can enhance the user’s overall experience when using the tool. AT89LP Developer Studio User Guide 2-3 3711B–MICRO–04/10 Section 3 Getting To Know the AT89LP Devloper Studio IDE Experienced users of microcontrollers and Integrated Development Environments may skip this section. LP Studio is an Integrated Development Environment (IDE) for developing applications targeting Atmel’s innovative LP (Low Power) single-cycle family of microcontrollers. 3.1 General Information IDE environments provide source code editing, build automation, and debug support. The goal of bundling these elements together into one application is to increase developer productivity. This makes the IDE a complex tool. As a result, there is a steep learning curve which must be followed in order for the developer to gain maximum benefit from the tool. 3.2 Main Elements of LP Studio This section will familiarize the user with the main elements of LP Studio and the function that each element provides. Users familiar with IDEs for either computer or microcontroller applications will recognize many of the elements in the user interface. Even though LP Studio offers complex chip configuration options, once the basic elements of the frontend user interface are learned, it is easy to begin running basic simulations and debugging the code. Figure 3-1. Basic components in the LP Studio User Interface AT89LP Developer Studio User Guide 3-1 3711B–MICRO–04/10 Getting To Know the AT89LP Devloper Studio IDE The main LP Studio elements are identified in Figure 3-1. Left is ‘The Solution View’, bottom-left is ‘The Output View’, and bottom-right is ‘The Watch List’. 3.2.1 Solution View The ‘Solution View’ contains three tabbed windows: 3.2.2 ‘File View’- Contains a list of all the source files that make up the project. ‘IO View’ (shown)- Contains a list of all the registers of the specific LP microcontroller targeted by the design. ‘Info View’- Contains useful information needed often about the targeted microcontroller. Output View The ‘Output View’ contains three tabbed windows: 3.2.3 ‘Project Configuration View’- provides information about the project and the debug environment. The window shows the status of device drivers and the simulator. ‘Build View’ (shown) - shows the build status of the project. It displays source code warnings and errors when the code is assembled or compiled. It also reports the amount of LP target device memory occupied by the application once the source code builds without error. ‘Debug View’- records the debug actions performed on the target. For example, Run, Reset, and Step actions are logged in this window. Watch List The ‘Watch List’ provides functionality similar to the ‘IO View’. Registers and memory locations can be added to the ‘Watch List’ and monitored. This eliminates the need to constantly navigate through the ‘IO View’ to check the status of registers and memory locations of particular interest. 3-2 3711B–MICRO–04/10 AT89LP Developer Studio User Guide Getting To Know the AT89LP Devloper Studio IDE The ‘Watch List’ also provides the additional capability of allowing write access to registers and memories in the list. This allows full control over the state of the microcontroller. 3.3 Launching LP Studio and using the Project Wizard The Project Wizard is used to open existing LP Studio projects, or to create new projects. The wizard displays automatically whenever LP Studio launches. Project Wizard is comprised of three pages. The first page is used to open existing projects. The second and third pages are used to create new projects. 3.3.1 Open Existing Projects To open an existing project, on the first page of the Project Wizard, choose an existing project from the list of Recent Projects (MRU), or alternately, navigate to an existing project using the File Browser, see Figure 3-2. Select the project and then click the ‘Load’ button. Figure 3-2. 3.3.2 Opening a project using the LP Studio Project Wizard. Creating New Projects To create a new project, click the button labeled ‘Next’ on the first page of the Project Wizard and proceed to the second page. On the second page, specify the name of the project, the folder in which to create the project, and the type of project to be created, see Figure 3-3. AT89LP Developer Studio User Guide 3-3 3711B–MICRO–04/10 Getting To Know the AT89LP Devloper Studio IDE Figure 3-3. Creating a new project in the LP Studio project wizard. Project Name - The name of the project is specified in the text field labeled ‘Project Name’. Project Location - The project location is specified by opening the file browser. Project Wizard creates a subfolder to store the project files. The subfolder name will be the same name as the project. Project Template - The project type is specified to be either Assembly or C. Once the information has been entered, click ‘Next’ and go to page 3 to specify the target LP device for the project. Figure 3-4. Selecting your target device in the LP Studio project wizard. All the LP devices supported by LP Studio will be displayed on page 3, see Figure 3-4. As each device is clicked and highlighted, a short summary of the device specification will display in the ‘Features’ window at the right. Select a target device, and then click the “Load’ button. The Project Wizard will close and your new LP Studio project will open. 3-4 3711B–MICRO–04/10 AT89LP Developer Studio User Guide Section 4 Debugging Your First LP Application This section demonstrates the debug features available in LP Studio. The debug controls are ‘Run’, ‘Break’, ‘Step Over’ and ‘Reset’. In addition, Breakpoints can be specified. With these, the LP Studio environment allows full program flow control during a debug session. These capabilities will be demonstrated by debugging one of the sample programs that comes with LP Studio. 4.1 Terminology ‘Execution mode’ and ‘Debug mode’ are the terms describing the state of the microcontroller. 4.2 4.3 Execution Mode - The state of the microcontroller when it is running freely and executing instructions without interruption. Debug Mode - The state of the microcontroller when it is halted and instruction flow is controlled by debug commands. Control Signals Run - places the microcontroller into Execution Mode. Break - places the microcontroller into Debug Mode and is the only command available when the microcontroller is in Execution Mode. Step Over - In Debug Mode, allows the microcontroller to execute the next instruction and then halt (single step). Reset - resets the application and halts the microcontroller at the first instruction of the instruction code. Breakpoints Breakpoints are powerful tools for debugging code. Breakpoints can be configured to halt the microcontroller prior to execution of specific instructions. This allows the microcontroller to be placed into Debug Mode from Execution Mode at any desired place in the code. There are two types of Breakpoints: 1. Program Address breakpoints – are simple breakpoints that halt execution at a specified address. 2. Advanced breakpoints - halt execution for a range of addresses as well as for data. See section ‘Views and Windows’ for more details on Advanced Breakpoints. AT89LP Developer Studio User Guide 4-1 3711B–MICRO–04/10 Debugging Your First LP Application 4.4 Debug Example With a basic understanding of flow control and program address breakpoint, we are ready to debug a program. The program will use the ‘ProgressBar’ program located at ‘My Documents\AT89LP Developer Studio\ProgressBar’. This program performs left shifts on a byte value and inserts 1’s in the vacated bit position. It emulates the look of a Windows progress bar. Before proceeding, please familiarize yourself with the source code in order to understand how the program is intended to work. 4.5 Loading the Project 1. Launch LP Studio. Page 1 of the Project Wizard will appear. 2. Search the MRU list for ProjectBar. If it exists, left-click to highlight the file. Next, click the ‘Load’ button at the bottom of the wizard to open the project. 3. If ProgressBar is not listed in the MRU list, open the folder browser and navigate to the directory ‘ProgressBar’ in your LP Studio default directory. Click to highlight the file named ‘ProgressBar.ncp’ and press ‘Open’ in the folder browser. The file path to ‘ProgressBar.ncp’ will display in the Project Wizard. Next, click the ‘Load’ button at the bottom of the wizard to open the project. . 4. The LP Studio IDE will look like Figure 4-1. Figure 4-1. 4-2 3711B–MICRO–04/10 Debugging the LP application. AT89LP Developer Studio User Guide Debugging Your First LP Application 4.6 Targeting the Simulator In this demo we target the simulator instead of the chip. Select ‘Simulate’ in the debug toolbar, circled in Figure 4-1. 4.7 Assemble the Program Assemble the program by clicking the ‘Build’ button on the left of the Debug toolbar. Next, view the ‘Build’ tab in the ‘Output View’ to see whether or not the build succeeded, along with any errors and warnings. The build should be successful for the unmodified version of ProgramBar provided by LP Studio. 4.8 Entering Debug Session To start the debug session, click the ‘Start Debug’ button in the Debug toolbar. LP Studio displays the debug window containing the disassembled file (.dsm). It then places the target into debug mode and halts on the very first instruction of the program, indicated by the yellow marker in the disassembled file window display. 4.8.1 Inspect the Internal State of the Microcontroller Inspect the internal state of the microcontroller by observing the values of the device registers used by the program: accumulator (ACC or A), general purposes register R4, and port registers P0, P0M0, P0M1. Register R4 - is used to store the shift pattern. P0 - is a copy of R4 and is used to output the shift pattern for driving the LEDs on the Hardware Development Board. P0M0 and P0M1 - are registers used to configure port P0. Locate these registers in the ‘IO tab’ of the ‘Solution View’. 4.8.2 To view R4, expand the nodes ‘Register 0-7’ To view ACC, look under ‘Processor’ node To view the port registers, look under ‘AT89LP6440 -> Port 0’. Issue Debug commands With the device in debug mode and the registers available for inspection, the next step is to issue debug commands. Start by issuing ‘Step Over’ commands and inspect the target registers after the execution of each instruction. 4.8.3 Monitor the Target Registers We are especially interested in observing the values written to P0, since this pattern is used to drive the LEDs on the Hardware Development Board. 4.8.4 Setting Breakpoints The bit pattern in R4 is written to the port P0 by the instruction at address 0x0014. AT89LP Developer Studio User Guide 4-3 3711B–MICRO–04/10 Debugging Your First LP Application Set a Program Address Breakpoint at this address. Place the mouse cursor on this line in the .dsm display and toggle a breakpoint by typing key (F10). 4.8.5 Execute the Code and Halt on Breakpoint Put the device in execution mode by typing key (F5). The device runs to address 0x0014 and then halts at the breakpoint and returns to debug mode. 4.8.6 Single Step Issue a ‘Step Over’ single-step command over the next instruction and observe the value in R4 being copied to P0. 4.8.7 Execute the Code Issue a Run command to put the device back into execution mode. Observe once again that it returns to debug mode at the instruction where we inserted our breakpoint. Repeat this a few times and observe the bit patterns in R4 and P0 emulating a progress bar. 4.8.8 Exit Debug After convincing yourself that the program works, exit the debug session by clicking the ‘Stop Debug’ button in the debug toolbar. 4-4 3711B–MICRO–04/10 AT89LP Developer Studio User Guide Section 5 Views and Windows This section describes the views and windows that make up LP Studio. They form an Integrated Development Environment, providing project management, project development, and microcontroller debug control. 5.1 File View Contained in the ‘File View’ are all the files that make up the project. This includes Source, Header, and Output Files. The ‘File View’ is shown in Figure 5-1. Code is entered in either the .asm or in the .c source file, depending on the project type. Declaration of constants and array are entered in the header file (.h). Assembler and compiler output files are placed under Output Files. Figure 5-1. 5.2 The File View I/O View The ‘I/O View’ is one of the most valuable resources for debug sessions. The ‘I/O View’ presents a complete view of the Special Function Registers (SFR), displaying the state of the microcontroller. An example of the ‘I/O View’ is seen in Figure 5-2 on the left hand side. AT89LP Developer Studio User Guide 5-1 3711B–MICRO–04/10 Views and Windows The values of the SFR registers can be inspected in the ‘I/O View’ to verify that the code executes as intended. In the expanded “Processor” I/O view, the user can view the cycle-accurate counter when simulating the device. CYC_LP is the number of cycles that have elapsed using the AT89LP single-cycle core. CYC_C51 is the number of cycles that have elapsed using the “classic” 8051 6-12 cycle core. This gives the user an easy way to see the performance gain of the AT89LP single-cycle core versus a “classic” 8051 core. An example of the cycle counter in the ‘I/O View’ is seen in Figure 5-2 on the right hand side. Figure 5-2. 5.3 The I/O View Info View The Info View provides frequently accessed device specific information of the microcontroller targeted by the current project. The Info View is shown in Figure 5-3. This includes a table of interrupt vectors, pin configurations, and a complete list of the Special Function Registers of the LP device. 5-2 3711B–MICRO–04/10 AT89LP Developer Studio User Guide Views and Windows Figure 5-3. 5.4 The Info View Project Configuration View The ‘Project Configuration’ View displays information regarding the loading of the project and its dependencies. The status of a successfully loaded project is shown in Figure 5-4. In order to open a project successfully, LP Studio must parse multiple system files, load device drivers, and start a Java VM for the simulator. If any one of these operations fails, LP Studio gives notification by printing error messages in this window. Figure 5-4. 5.5 The Project Configuration View Build View The ‘Build View’ is where LP Studio logs output from the assembler and compiler. The ‘Build View’ is shown in Figure 5-5. The build tool reports possible errors and warnings in this window. Figure 5-5. The Build View AT89LP Developer Studio User Guide 5-3 3711B–MICRO–04/10 Views and Windows 5.6 Debug View The ‘Debug View’ is where LP Studio displays debug actions performed during debug. The ‘Debug View’ is shown in Figure 5-6. Debug actions are flow control commands such as ‘Single-step’, ‘Run’, ‘Break’, and ‘Reset’. Breakpoint insertion and removal are also logged here. Figure 5-6. 5.7 The Debug View Watch List The ‘IO view’ does not always provide the best solution for observing register values. If the registers to be monitored are in different nodes of the register tree, the user may have to constantly navigate the tree to view the values. Monitoring a handful of registers can be tedious, especially if it requires the expanding and collapsing of tree nodes The ‘Watch List’ simplifies the monitoring of registers by allowing the user to add frequently monitored registers to the Watch List display, see Figure 5-7. Figure 5-7. The Watch List In addition, unlike the ‘IO View’, the ‘Watch List’ provides read and write access to the registers. This gives the user full control of the state of the chip. Registers can be arranged in any order in the Watch List. Another benefit of the ‘Watch List’ is that memory locations can also be observed in addition to the SFR registers. The two ways to add entries to the ‘Watch List’ are by name or by array. Memory locations, general purpose registers and Special Function Registers can be added by name. Memory locations can also be added array-style, with the name of the memory and its address in brackets. 5-4 3711B–MICRO–04/10 AT89LP Developer Studio User Guide Views and Windows 5.8 Static Memory View The ‘Static Memory View” provides a view of the microcontroller’s code and data memory. The ‘Static Memory View’ is shown in Figure 5-8. This is a static view and reflects the state of the memories right after the part has been programmed. Figure 5-8. 5.9 The Static Memory View Editor Window LP Studio implements a basic editor for code entry. Its functionality is similar to NotePad in Windows. 5.10 Calculator Window LP Studio has an interactive Calculator Tool which automatically generates the initialization values for the baud rate generator, pulse width modulator, and timeout calculator. The Calculator window shows the three different types of peripheral calulators; baud rate(Figure 5-9), pulse width modulator(Figure 5-10), and timeout(Figure 5-11). The user inputs the requires criteria (i.e. frequency, clock divider, duty cycle), then clicks the ‘Calculate’ button. The calculator generates the correct initialization values for use in the source code. AT89LP Developer Studio User Guide 5-5 3711B–MICRO–04/10 Views and Windows Figure 5-9. The Baud Rate Calculator Figure 5-10. The Pulse Width Modulation Calculator 5-6 3711B–MICRO–04/10 AT89LP Developer Studio User Guide Views and Windows Figure 5-11. The Timeout Calculator AT89LP Developer Studio User Guide 5-7 3711B–MICRO–04/10 Views and Windows 5.11 Disassembly View Derived from the ‘Editor Window', the ‘Disassembly View’ is where code is debugged. The ‘Disassembly View’ is shown in Figure 5-12. As the name implies, this view displays the disassembled .dsm file showing the instructions that make up the program and the addresses of each instruction. LP Studio paints the line of the next instruction to be executed in yellow. Figure 5-12. The Disassembly View 5.12 Breakpoints Breakpoints provide a powerful tool when debugging code. A breakpoint tells the microcontroller to halt execution at a specified address in program memory. This is useful for inspecting the state of the microcontroller at a certain address in the code. 5.12.1 Types of Breakpoints Atmel’s LP microcontrollers offer 3 types of breakpoints: Program Address, Range, and Data breakpoints. Program address breakpoints Range breakpoints Data breakpoints Program Address Breakpoints break on a given address. Range and Data breakpoints require a more detailed description, see next. 5-8 3711B–MICRO–04/10 AT89LP Developer Studio User Guide Views and Windows 5.12.2 Range Breakpoints Range breakpoints are set using a base Program Address and an address mask value. The microcontroller masks the supplied base Program Address with the mask value and breaks whenever the Program Address matches the masked base Program Address. The masking operation is similar to the UART automatic address recognition mask: ‘1’ in the mask = base address ‘Care’ bit. ‘0’ in the mask = base address ‘Don’t Care’ bit. So for example, if the base address (in binary) is: 1100 1010 And the mask (in binary) is: 1111 1000 Then the resulting breakpoint addresses (in binary) are: 1100 1xxx (same as the base address, with the exception that any ‘0’ bit in the mask becomes a ‘Don’t Care’ in the breakpoint address). 5.12.3 Data Breakpoints A Data breakpoint is generated whenever the microcontroller accesses external memory with a ‘MOVX’ instruction at the external address specified by the user. The break condition can be specified for a read access, write access, or both. 5.12.4 Link Breakpoints A Link breakpoint is managed on the Hardware Development Board external to the LP device in use. The difference between Hardware and Link breakpoints is performance. A Link breakpoint slows down execution when using ‘Run’ debug commands. This is due to the additional overhead by the Link as it takes control over the device and checks the address of every instruction executed to see if it matches the address of the Link breakpoints. 5.12.5 Setting Breakpoints in the LP Studio User Interface For both Simulator and Device debug platforms, Program Address breakpoints can be toggled on or off by pressing the ‘Toggle Breakpoint’ button on the debug toolbar. The shortcut key ‘F9’ can also be used to perform the same operation. Advanced breakpoints are set, enabled, and disabled using the LP Studio Breakpoint Configuration manager. Figure 5-13 shows the breakpoint configuration manager for the Device debug platform. AT89LP Developer Studio User Guide 5-9 3711B–MICRO–04/10 Views and Windows Figure 5-13. Breakpoint manager for the Device debug platform 5.12.6 Adding Breakpoints 1. Enter Debug mode by clicking Debug -> Start Debug 2. Open the Breakpoint Configuration Manager by clicking Chip -> Breakpoint Configuration 3. Select the target for the breakpoint: chip or link. Note: Not recommended to use breakpoints on link. 4. Select the breakpoint type: Program Address, Range, or Data 5. Specify the Program Address of the breakpoint and, if desired, configure it as a Range breakpoint by providing the mask value. 6. Enable and disable breakpoints by clicking the respective checkboxes on the left of the breakpoint. 5.12.7 Removing Breakpoints 1. In the Breakpoint Configuration Manger, left-click and highlight the Breakpoint number. 2. Click the Remove Button The Breakpoint Configuration Manager is shown in Figure 5-14. 5-10 3711B–MICRO–04/10 AT89LP Developer Studio User Guide Views and Windows Figure 5-14. Breakpoint manager for the simulator debug platform 5.12.8 Debugging with Breakpoints and Advanced Breakpoints When debugging in LP Studio, the type of breakpoints available depends on the debug platform and the target device. The debug platform is either the Simulator or the actual Device on the Hardware Development Board. When debugging on the Simulator, there are different restrictions on the number of breakpoints that can be set. The Simulator allows an unlimited number of Program Address breakpoints. However, Range and Data breakpoints are not available. Program Address, Range, and Data breakpoints can all be used when debugging on the Device. The number of breakpoints available on the Device depends on the targeted LP microcontroller. Some LP microcontrollers implement 4 Program Address breakpoints; others offer 4 additional Advanced breakpoints. Advanced breakpoints can be configured as Program Address, Range, or Data breakpoints. Additionally, up to 128 Program Address breakpoints can be configured on the link. AT89LP Developer Studio User Guide 5-11 3711B–MICRO–04/10 Section 6 Build Tools in AT89LP Developer Studio 6.1 Assembler and Compiler LP Studio comes with Atmel’s C51ASM assembler and SDCC C-compiler. When creating a new project, specify the project type as Assembly or C. AT89LP Developer Studio User Guide 6-1 3711B–MICRO–04/10 Section 7 Menus and Toolbars 7.1 AT89LP Developer Menu Figure 7-1. 7.2 AT89LP Developer Studio Menu File Menu Figure 7-2. Expanded File Menu in LP Studio Table 7-1. Expanded File Menu in LP Studio Name Description New Create new text file or project Open Open existing text file or project Close Close the active file Save Save file current text file Save As Save file current text file as Save All Save all text files Open Solution AT89LP Developer Studio User Guide Open project 7-1 3711B–MICRO–04/10 Menus and Toolbars Table 7-1. Expanded File Menu in LP Studio Name Description Close Solution Close project Print Print Preview Preview current text file Print Setup Setup printer Recent Files Open text file from most recently used list Recent Projects Open project from most recently used list Exit 7.3 Print current text file Exit LP Studio Edit Menu Figure 7-3. Expanded Edit Menu in LP Studio Table 7-2. Expanded Edit Menu in LP Studio Name Undo Cut Cut and copy selected text from editor Copy selected text from editor Paste Paste text from clipboard to the editor Find 7-2 Undo last editor action Copy Select All 3711B–MICRO–04/10 Description Select all text from editor Open a dialog to search through the current file. Find Next Jump to next search item specified in ‘Find…’ Replace Open a dialog to replace text in the current file AT89LP Developer Studio User Guide Menus and Toolbars 7.4 Debug Menu Figure 7-4. Expanded Debug Menu in LP Studio Table 7-3. Expanded Debug Menu in LP Studio Name Build Solution Assemble or compile project Clean Solution Delete output files from project Start Debug Start a new debug session Stop Debug End the current debug session Run Run the target Break Halt target in run mode Reset Reset and Break the target on first instruction Step Over Toggle Breakpoint 7.5 Description Step over current instruction (Single-step) Toggle Program Address breakpoint Tools Menu Figure 7-5. Expanded Tool Menu in LP Studio AT89LP Developer Studio User Guide 7-3 3711B–MICRO–04/10 Menus and Toolbars 7.6 Chip Menu Figure 7-6. Expanded Chip Menu in LP Studio Table 7-4. Expanded Chip Menu in LP Studio Name Port Configuration Select port and configure hardware communication Fuse Configuration Configure device User Fuses Lock Protection Mode Signature Breakpoint Configuration Open Device Buffer 7.7 Description Configure Lock Bits/Flash protection mode Configure device User Signature Open the Breakpoint Configuration Manager Open static memory view View Menu Figure 7-7. Expanded View Menu in LP Studio Table 7-5. Expanded View Menu in LP Studio Name Description Toolbar Show/hide Toolbar Status Bar 7-4 3711B–MICRO–04/10 Show/hide Status bar AT89LP Developer Studio User Guide Menus and Toolbars 7.8 Window Menu Figure 7-8. Expanded Window Menu in LP Studio Table 7-6. Expanded Window Menu in LP Studio Name Description New Window New Window Cascade Title Arrange Icons Select 7.9 Cascade the open windows Tile the open windows Arrange icons Select active window Help Menu Figure 7-9. Expanded Help Menu in LP Studio Table 7-7. Expanded Help Menu in LP Studio Name Description AT89LP Developer Studio User Manual LP Studio’s user manual is here. AT89 Instruction Set Instruction set is displayed here. AT89 C51ASM User Manual About AT89LP Developer Studo Contact Us AT89LP Developer Studio User Guide C51ASM user manual is here. Displays the About dialog about LP Studio. Version information is displayed here. Displays the Contact Information. 7-5 3711B–MICRO–04/10 Menus and Toolbars 7.10 Standard Toolbar Figure 7-10. Standard Toolbar in LP Studio 7.11 Edit Toolbar Figure 7-11. Standard Edit in LP Studio. 7.12 Debug Toolbar Figure 7-12. Debug Toolbar in LP Studio 7.13 Flow Control Toolbar Figure 7-13. Flow Control Toolbar in LP Studio 7-6 3711B–MICRO–04/10 AT89LP Developer Studio User Guide Section 8 Programming Dialogs 8.1 Port and Link Configuration Before starting a debug session on a device, connect the PC to the AT89LP OCD Board using a serial port. If the PC does not have a serial port, then a USB-to-serial adapter is needed. Setup and configure the PC-to-hardware connection in the LP Studio using ‘Configure Chip Communication’ dialog. In this dialog, specify and configure the serial port being used to connect to the hardware board. It is recommended that new users of LP Studio keep the default port and link configuration values. The ‘Port Select’ window is shown in Figure 8-1. Figure 8-1. Selecting serial port for chip communication Select the serial port and baud rate for the speed of the serial port transmission. To connect to a serial port, click and highlight the port to be used and press ‘Select’. The default baud rate is 9600. It is recommended for new users to use the default baud rate Figure 8-1 shows the selected serial port named ‘COM1’. The ‘Link Configuration’ window is shown in Figure 8-2. Advanced users may want to specify the baud rate at which the link transmits data between the chip and the PC. This is done in the ‘Link Configuration’ window by adjusting the parameters ‘Target Frequency’ and ‘Maximum Clock Divide’ to obtain the desired link baud rate. AT89LP Developer Studio User Guide 8-1 3711B–MICRO–04/10 Programming Dialogs Figure 8-2. 8.2 Specifying link baud rate Programming Fuses The ‘Fuse Bits’ window allows configuration of the fuses on the LP device. In this window, the fuses on the LP microcontroller can be read and written. The ‘Fuse Bits’ window is shown in Figure 8-3. Figure 8-3. The Fuse Bit window Available fuse settings are presented in drop-down lists. Be careful when writing the fuses as some configurations options may prevent LP Studio from further communication with the device. A warning is given if the selected fuse setting may leave the LP device in an unintended state. It is strongly recommended to refer to the data sheet before configuring fuses. 8-2 3711B–MICRO–04/10 AT89LP Developer Studio User Guide Programming Dialogs 8.3 Programming Flash Security/Lock The ‘Lock Bits’ window, shown in Figure 8-4, sets the lock bits for the targeted LP microcontroller. Figure 8-4. The Lock Bits Window Configuring the ‘Lock Bits’ sets the protection mode for Code and Data flash memories. They determine the memory Write and Read access privileges For example, with the current setting in Figure 8-4, the device has no lock features enabled. Write and Read access can be disabled. Please note that setting a ‘Lock’ on the device will prevent LP Studio from further communication with the device. A warning will be displayed if an attempt is made to set a ‘Lock’ on the device. 8.4 Programming the Signature All LP microcontrollers have User Signature and Atmel Signature memory features. The User Signature is programmable flash memory that can be used by the user to store serial numbers, revision information, date codes or other user parameters. It also contains analog configuration data for the device. The analog configuration values occupy the second half of the User Signature space. Care should be taken so that these values are not modified when writing the first half of the User Signature space. The Atmel Signature contains the device ID of the targeted LP microcontroller. It also contains a copy of the analog configuration values found in the second half of the User Signature. The AT89LP6440 Signature window is shown in Figure 8-5. The first three bytes of the Atmel signature show the device ID for AT89LP6440, namely 0x1E, 0x64, 0xFF. AT89LP Developer Studio User Guide 8-3 3711B–MICRO–04/10 Programming Dialogs Figure 8-5. 8-4 3711B–MICRO–04/10 The Signature Window AT89LP Developer Studio User Guide Section 9 Revision History 9.1 Revision History Revision No. History Revision A – Aug. 2009 • Initial Preliminary Release Revision B– April 2010 • • • • Remove 2.2.2 jvm.dll installation description page 2-2 Added “Processor” I/O view, Figure 5-2 on page 5-2 Added baud rate caluculator view, Figure 5-9 on page 5-6 Added pulse width modulation calculator view, Figure 5-10 on page 5-6 • • • AT89LP Developer Studio User Guide Added timeout calculator view, Figure 5-11 on page 5-7 Added “Tools” to menu toolbar,Figure 7-1 on page 7-1 Added Calculator view, Figure 7-5 on page 7-3 9-1 3711B–MICRO–04/10 Headquarters International Atmel Corporation 2325 Orchard Parkway San Jose, CA 95131 USA Tel: 1(408) 441-0311 Fax: 1(408) 487-2600 Atmel Asia Unit 1-5 & 16, 19/F BEA Tower, Millennium City 5 418 Kwun Tong Road Kwun Tong, Kowloon Hong Kong Tel: (852) 2245-6100 Fax: (852) 2722-1369 Atmel Europe Le Krebs 8, Rue Jean-Pierre Timbaud BP 309 78054 Saint-Quentin-enYvelines Cedex France Tel: (33) 1-30-60-70-00 Fax: (33) 1-30-60-71-11 Atmel Japan 9F, Tonetsu Shinkawa Bldg. 1-24-8 Shinkawa Chuo-ku, Tokyo 104-0033 Japan Tel: (81) 3-3523-3551 Fax: (81) 3-3523-7581 Technical Support [email protected] Sales Contact www.atmel.com/contacts Product Contact Web Site www.atmel.com Literature Requests www.atmel.com/literature Disclaimer: The information in this document is provided in connection with Atmel products. No license, express or implied, by estoppel or otherwise, to any intellectual property right is granted by this document or in connection with the sale of Atmel products. EXCEPT AS SET FORTH IN ATMEL’S TERMS AND CONDITIONS OF SALE LOCATED ON ATMEL’S WEB SITE, ATMEL ASSUMES NO LIABILITY WHATSOEVER AND DISCLAIMS ANY EXPRESS, IMPLIED OR STATUTORY WARRANTY RELATING TO ITS PRODUCTS INCLUDING, BUT NOT LIMITED TO, THE IMPLIED WARRANTY OF MERCHANTABILITY, FITNESS FOR A PARTICULAR PURPOSE, OR NON-INFRINGEMENT. IN NO EVENT SHALL ATMEL BE LIABLE FOR ANY DIRECT, INDIRECT, CONSEQUENTIAL, PUNITIVE, SPECIAL OR INCIDENTAL DAMAGES (INCLUDING, WITHOUT LIMITATION, DAMAGES FOR LOSS OF PROFITS, BUSINESS INTERRUPTION, OR LOSS OF INFORMATION) ARISING OUT OF THE USE OR INABILITY TO USE THIS DOCUMENT, EVEN IF ATMEL HAS BEEN ADVISED OF THE POSSIBILITY OF SUCH DAMAGES. Atmel makes no representations or warranties with respect to the accuracy or completeness of the contents of this document and reserves the right to make changes to specifications and product descriptions at any time without notice. Atmel does not make any commitment to update the information contained herein. Unless specifically provided otherwise, Atmel products are not suitable for, and shall not be used in, automotive applications. Atmel’s products are not intended, authorized, or warranted for use as components in applications intended to support or sustain life. © 2010 Atmel Corporation. All rights reserved. Atmel ®, Atmel logo and combinations thereof, and others are registered trademarks or trademarks of Atmel Corporation or its subsidiaries. Windows ® and others are registered trademarks or trademakrs of Microsoft Corporation in U.S. and or other countries. Other terms and product names may be trademarks of others. 3711B–MICRO–04/10 /xM