1
op_scope
working draft
Version 3.0
User Manual
revision
15 January 2015
SUPERsmith
www.supersmith.com
Table of Contents
DISCLAIMER...........................................................................................................................................3
1 What is op_scope?..................................................................................................................................4
2 Getting the most from op_scope.............................................................................................................4
3 Conventions in this document.................................................................................................................5
4 About Hardware Performance Counters.................................................................................................5
4.1 General description..........................................................................................................................5
4.2 CPU_CLK_UNHALTED...............................................................................................................7
4.3 Event attribution “skid”...................................................................................................................7
5 Requirements of your program for use with op_scope...........................................................................9
6 op_scope description of operation........................................................................................................10
6.1 Overview.......................................................................................................................................10
6.2 Interface with PAPI.......................................................................................................................11
6.3 Running your code with op_scope_runner....................................................................................11
6.3 Examining the data with op_scope_ui in GUI mode....................................................................12
6.4 Examining the data with op_scope_ui in text mode......................................................................15
6.5 Files created by op_scope..............................................................................................................16
6.6 Files created by op_scope: controlling their location....................................................................17
6.7 Files Summary...............................................................................................................................18
7 Description of how op_scope is installed on a system..........................................................................18
8 Using op_scope: The simplest program................................................................................................19
9 Using op_scope: The simplest threaded (OpenMP) program...............................................................19
9 Using op_scope: The simplest MPI program........................................................................................19
10 Using op_scope: A Hybrid MPI/OpenMP program...........................................................................19
11 Working with multiple counters.........................................................................................................19
12 How to obtain performance data for dynamic libraries opened at runtime. (i.e. not at startup).........19
12 What do the counters mean?..............................................................................................................19
13 Alphabetized description of op_scope environment variables............................................................20
14 List of op_scope command arguments, that may be supplied to the generated “op_scope_ui” script.
..................................................................................................................................................................20
DISCLAIMER
THIS SOFTWARE IS PROVIDED BY THE COPYRIGHT HOLDERS AND CONTRIBUTORS "AS
IS" AND WITHOUT ANY EXPRESS OR IMPLIED WARRANTIES, INCLUDING, BUT NOT
LIMITED TO, THE IMPLIED WARRANTIES OF MERCHANTABILITY AND FITNESS FOR
A PARTICULAR PURPOSE ARE DISCLAIMED. IN NO EVENT SHALL SUPERSMITH OR
CONTRIBUTORS BE LIABLE FOR ANY DIRECT, INDIRECT, INCIDENTAL, SPECIAL,
EXEMPLARY, OR CONSEQUENTIAL DAMAGES (INCLUDING, BUT NOT LIMITED TO,
PROCUREMENT OF SUBSTITUTE GOODS OR SERVICES; LOSS OF USE, DATA, OR
PROFITS; OR BUSINESS INTERRUPTION) HOWEVER CAUSED AND ON ANY THEORY OF
LIABILITY, WHETHER IN CONTRACT, STRICT LIABILITY, OR TORT (INCLUDING
NEGLIGENCE OR OTHERWISE) ARISING IN ANY WAY OUT OF THE USE OF THIS
SOFTWARE, EVEN IF ADVISED OF THE POSSIBILITY OF SUCH DAMAGE.
Use of this software implies consent to the above disclaimer.
1 What is op_scope?
It is a powerful performance analysis tool, based on the PAPI interface and the Linux environment. It
enables the user to make simple or sophisticated use of the hardware-based performance counters
present in most modern processors. It gathers a user-defined set of performance data for a given
program. The results of that information are presented in either text mode, or a simple but effective
graphical user interface (GUI). It uses symbol table information from a given program to enable
source-code correlation by the user, and also allows the user to “drill down” to the opcode level. The
tool has been ported to all varieties of x86/x86_64 processors, as well as MIPS, and ARM in both 32
and 64 bit modes. As long as PAPI and Linux are supported on a given processor, the porting process
can be performed in a matter of days.
The op_scope tool supports most programming paradigms, such as MPI and threading. It has been
specifically upgraded to work potentially with tens of thousands of MPI ranks, and the threading
support is generalized, so any threading paradigm such as Posix Threads or OpenMP is supported.
2 Getting the most from op_scope.
Users of op_scope will obtain best results if they possess a few key skills. At a minimum, they will
need to know their way around a Linux system. They will need to understand files, directories,
permissions, paths, shells, etc. Since all the examples in this document and available online will be
“bourne shell” scripts, they should able to understand and create such scripts themselves, or, be capable
of converting such scripts to their scripting shell of choice. A sample such script is:
#!/bin/sh
export TOTO=”hello world”
echo ${TOTO}
In addition to these minimal skills, users will be more effective at understanding the nature of their
code, and the possibilities for improvement, by being able to read and understand the assembly
language generated by compilers on their behalf. The op_scope tool provides some assistance in this
regard, and there is some discussion in this document of x86_64-style opcodes. A complete discussion
of assembly language is beyond the scope of this document. The user should understand the basics of
vectorization and be familiar with PAPI.
The most sophisticated op_scope user will have an understanding of the underlying micro-architecture
of a given processor. With this knowledge, and the way that op_scope can present the decoded
assembly language in terms of terms of it's “basic blocks”, deep insight into the performance
characteristics of a code can be obtained.
Lastly, the user needs to be able to build and modify their program/code from source. There will also
need to be symbol-table information generated at compile-time to enable source-code correlation. The
user can use information presented by op_scope to either change compiler flags to enable generation of
more efficient code, or modify their source code to achieve the same effect. So, it is imperative that the
user have a good handle on the build process of their code.
3 Conventions in this document.
This document consists of explanatory text such as this paragraph, sample bourne-shell scripts such as
seen in section 2), suggested interactive commands, text output of the former, and images of the GUI
interface. Text of scripts, commands, and output will generally be in fixed width courier fonts of
various sizes to preserve the experience on the computer monitor. Some of the output may include the
typical “prompt” for interactive sessions, and the user is expected to be able to differentiate the prompt
from command-line-input. Since there will be information presented from a variety of systems, having
a consistent prompt across all the example data is not tractable.
This document and most example scripts are available for download from the Supersmith website at:
http://www.supersmith.com/site/op_scope.html
This document is also updated regularly. The date of last update is present in the first page of the
document.
Almost all the discussion of processor characteristics in this manual refer to x86_64 type systems,
unless specifically indicated otherwise.
4 About Hardware Performance Counters.
4.1 General description.
Hardware Performance Counters are present in most modern processors. They consist of a set of
normally hidden registers, and methods to program them, control their use, and read and write values.
The registers are programmed to respond to hardware events that occur within the processor. The
simplest event may be the incrementing of the system clock (CPU_CLK_UNHLATED). i.e. an “event”
that happens with every clock advance. In the case of a 2 Ghz processor, this would be 2 Billion such
“events” every second. They perform this event counting without disturbing the processor in any way.
What can incur an “overhead cost”, is the reading out of counter data, or when used to generate
interrupts, as described below.
A more complex event would be, for example, a reference by your program to a memory location that
was not contained in the L1 data cache. A so-called “L1 Data Cache Miss” event. Some events may
occur with far more frequency than others. We will see later in section xxx how op_scope gives the
user the ability to control and interpret performance counters with widely varying rates of occurrence.
There is no standard for the names or meanings of Hardware Performance Counters. The PAPI
interface has tried to standardize names of it's own. In all cases though, the PAPI team has mapped
their idea of an event type to the “real” event name on a given processor that most closely matches (in
their opinion) the nature of their own counter name. A notorious example is PAPI_FP_OPS which is
intended to count floating point operations. This has different mappings on different Intel Xeon
processors, with completely different meanings, resulting in varying counts for this “counter” on
different systems. It is a source of great confusion to users.
The name of a PAPI event always begins with “PAPI_”. In the context of discussions of event names,
if the name does not begin with “PAPI_”, then it can be assumed that the reference is to a native event.
We strongly recommend that users always specify the native, real names of hardware performance
events. For a given processor, this means that un-ambiguous documentation from the manufacturer can
be referenced to understand precisely what the named event means. Section xxx describes how to find
the real names of an event, and how to go about finding out what it means. There is no guarantee of the
quality of the manufacturer documentation, so sometimes, experiments must be performed to fully
understand the meaning of a counter. The user needs to be aware as well, that without a somewhat
detailed knowledge of the underlying micro-architecture of a processor, they may have difficulty in
interpreting a manufacturer's typically terse description of the meaning of a specific event.
Please be aware that each model of processor has it's own, unique, set of defined performance counters.
Successive models of, say, Intel Xeon processors were probably designed by completely different
design teams, with each team defining and implementing their vision of what type of performance
counters were relevant. Also be aware that only a subset of performance counters are documented and
made available to the general user. And lastly, performance counters need not actually work correctly
in a shipping product. The user must be cautious.
Hardware Performance Counters may be present in sets of 2 or more to allow counting of multiple
events at once. Their may be rules for a given processor defining which type of counters may or may
not be used simultaneously. We strongly suggest that users of op_scope obtain performance counter
data one event at a time. This would involve running your program/code for as many times as there are
different counters you wish to obtain data for. In section xxx, the method is shown how to integrate the
performance data from many separate runs into one coherent view.
The simplest use of performance counters is to count the total number of events over the course of
running a program. The typical metric “IPC”, or “Instructions Per Clock” can be measured this way by
counting the Instructions Retired Event, measuring the time that passed, and dividing by the clock rate.
Finding event totals over the life of a program may be of interest, but it serves no purpose to help to
understand the specifics of a given program, how it performs on a given processor, nor what might be
done to speed it up.
The more interesting use of the performance counters is to program them in a more sophisticated
manner. In this more sophisticated mode, an arbitrary count can be associated with each performance
counter. When the number events of that event counter reach the programmed value, an interrupt is
generated to the user program by the kernel. The kernel makes a note of the program counter at the
moment of the interrupt and reports it to the user. The cycle then continues.
This is a simplified explanation, but this method allows user code to build up a “histogram” of where in
the user code certain events occurred. In the simplest case of, say, “CPU_CLK_UNHALTED”, this
would provide a histogram of “where” in the user code time is being spent. The “graininess” of this
histogram can be adjusted by making the programmed count (what op_scope calls a “bucket size”)
arbitrarily small or large. The smaller the bucket size, the finer the detail, the more system overhead is
added to the running of the program. The larger the buck size, the less detail, and the less system
overhead is added to the running of the program.
In general, op_scope uses the “CPU_CLK_UNHALTED” event as a reference point for all it's event
counters. The bucket size used by op_scope for CPU_CLK_UNHALTED on x86_64 processors is the
clock frequency divided by 100 million. On a 2.6 Ghz processor, this gives a bucket size of 260,000.
Overhead for CPU_CLK_UNHALTED for this value is typically 3% to 5%. This also has the
convenience that when op_scope presents CPU_CLK_UNHALTED data, the user can simply divide
the integer values by 10,000 to get to units of seconds of cpu time. Section xxx describes how to alter
the bucket size of the various counters to make them more or less sensitive to detection by op_scope.
Obviously, if a bucket size is set large enough for a given counter such that the total numbers of such
events never exceeds this bucket size, then op_scope will report that zero such events occurred.
The user should also be aware that setting a bucket size too small for a frequently occurring event can
cause the operating system to “freeze” or reboot. In such a case, the kernel would be devoting so much
time to servicing the rapidly occurring interrupts, that it would be unable to complete it's normal
processing. The user needs to be cautious. Section xxx describes using events other than
CPU_CLK_UNHALTED, and should be something undertaken by only an experienced op_scope user.
A typical question that arises from new op_scope users is the following:
“OH, I can see that a large fraction of time in my code is spent in the MPI library routines. How can I
find out which calls to MPI routines are causing the most cpu time to be used?”
The answer to this is that op_scope cannot determine this. It should be clear from the discussion above
that the mechanism of having the kernel interrupt the running program when the threshold of a certain
number of events have transpired precludes this. While it might theoretically be possible to have a (cpu
intensive) traceback performed at each such interrupt, and the vast volume of resulting data be
somehow recorded, it is basically not a tractable functionality to incorporate into op_scope. Note that
the PAPI interface being used by op_scope provides no such functionality. Other tools exist that may
be able to provide call-tree and cpu-use data.
4.2 CPU_CLK_UNHALTED
CPU_CLK_UNHALTED is the name of perhaps the most useful Hardware Performance Counter. As
it's name implies, it counts cpu clocks when the processor is not halted. When the Linux system is up
and running your codes, it is, of course, not halted. So, this counter just counts cpu clocks. This is a
direct measure of time. So, measuring this counter indicates where your code is spending it's time, and
gives you an idea where you should focus your optimization efforts. Alternate names for
CPU_CLK_UNHALTED may be UNHALTED_CORE_CYCLES. The PAPI event is typically
PAPI_REF_CYC. op_scope, by default, unless the user specifies otherwise, will always gather data for
the CPU_CLK_UNHALTED event. For certain systems, it may automatically switch to the alternate
name of UNHALTED_CORE_CYCLES if it can identify the processor in use. Some newer processors
can enable a “turbo boost” mode, where the clock frequency can vary depending mostly on the current
thermal characteristics of the chip. Other newer chips may run at a different clock speed when certain
instructions are being used. This behavior does slightly alter the results of using
CPU_CLK_UNHALTED and is discussed in detail in section xxx. Since the effects are slight, in
general, the user can still rely on the results of CPU_CLK_UNHALTED to give them a good sense of
utilized cpu time.
4.3 Event attribution “skid”
When using op_scope, it must be understood that attribution of event data to specific opcodes in your
code is not exact. This is known as “skid”. When a “bucket” for an event counter “overflows”, and the
kernel is notified to interrupt the running process and record the program counter (i.e. the address
where your code is running) there is a certain natural lag, or delay, in the reporting of the address where
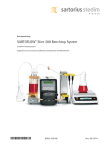
the overflow occurred. The best way to illustrate this is with a screenshot of an op_scope GUI session.
Details of the GUI are described later in this document, but a quick view will help to clarify “skid”.
This screenshot of an active op_scope GUI session shows data at the lowermost level of opcodes. Two
counters are enabled. CPU_CLK_UNHALTED, the leftmost column and upper graph, and
RETIRED_SSE_OPERATIONS:ALL, the second column from the left and lower graph.
The code block being shown is not fully visible, but contains a sequence of vector floating point add
and multiplies, (the addps and mulps tokens) followed by many no-op (nop) instructions. One can see
how the attribution of RETIRED_SSE_OPERATIONS:ALL, which one would expect to be associated
only with the addps/mulps opcodes, has in fact “skidded” down into the region of the no-ops. Clearly, a
no-op instruction cannot generate a RETIRED_SSE_OPERATION event of any kind.
The graphs show a representation of the columns of counter values. The x-axis is the “code footprint”,
with the y-axis representing values of the counters at those locations. It can be seen that the “natural
heartbeat” of 3-way opcode issue is going smoothly, a characteristic of the specific AMD processor this
code was run on. The “tick marks” on top of the graphs delimit the region of the current basic block
being examined. The time is spread evenly between all the opcodes, while the attribution of
RETIRED_SSE_OPERATIONS is bunched down in the middle of the no-op region.
It looks, then, like about a 9 or 10 clock delay for reporting the RETIRED_SSE_OPERATIONS
events.
The point of this explanation is to make clear that there is not an exact one-to-one correlation in the
relationship between individual opcodes and the reporting of an event value. First-time op_scope users
often mistakenly assume that they must focus on such-and-such individual opcode, as “that is where the
time is being spent”. This is not correct. Most codes, especially scientific codes, spend a lot of their
time in loops. Even if the attribution of events has “skid” of 9 or 10 clock periods, the events will, in
general, be attributed with sufficient accuracy to enable realistic performance analysis. Where this may
“fall down”, is in the case of “spaghetti code”. If the code blocks are tiny, (i.e. 3-4 opcodes each) and
there are huge amounts of conditional branches that delimit the tiny blocks, then it may not be possible
to get a realistic view of where the “hot spots” are for certain events. Of course, if the user sees such
masses of tiny blocks when using op_scope, that in itself is a suggestion of what may be limiting the
program's performance. In general, the longer the basic block of code, the greater possibility for the
modern processor to exploit inherent parallelism, and the faster the code will run.
Newer processor designs may have more or less accurate mechanisms than shown with this specific
AMD chip. They may also show greater accuracy for some events as compared to others. The user
needs to be aware of this. Ultimately, only experimentation can really determine the vagaries of a
specific processor and it's interaction with the Linux Kernel and PAPI software.
5 Requirements of your program for use with op_scope.
op_scope will only work with codes that are “normal programs”. It cannot be used with Java, for
example, or with any similar “scripting” language or “jit” compilation system. It cannot work with
Matlab. It cannot work with self-modifying code.
Your code must also be dynamically linked. This is so that op_scope can take advantage of various
essential capabilities that result from using the dynamic library loading mechanisms. You can tell if
your code is dynamically linked or not with the ldd command:
atomic.site:/home/dpb> gcc hello.c
atomic.site:/home/dpb> ldd a.out
linux-vdso.so.1 (0x00007fff4b5ff000)
libc.so.6 => /lib64/libc.so.6 (0x00002ba7b273c000)
/lib64/ld-linux-x86-64.so.2 (0x00002ba7b2518000)
atomic.site:/home/dpb> gcc -static hello.c
atomic.site:/home/dpb> ldd a.out
not a dynamic executable
atomic.site:/home/dpb>
In the above sequence of commands, “hello.c” was first compiled with the typical gcc defaults,
resulting in the ldd output as shown. Your code should show similar results with ldd. “hello.c” was then
recompiled with the “-static” flag. The result is a statically linked program as reported by ldd. A
statically linked program cannot be used with op_scope. If your code is statically linked for redistribution purposes, you may want to consider linking dynamically just to do performance analysis
with op_scope. After making potential improvements, you can then go back to linking statically.
There are no plans for op_scope to support statically-linked programs.
In order to correlate your program's behavior with your source code, you will need to enable symbol
table generation in your build process. This is done usually with the:
-g
flag. It must be specified at both the compile and link steps:
gcc -g hello.c
# compile and link in one step
gcc -c -g hello.c
gcc -g hello.o
# -g flag on the compile step
# -g flag on the link step
Using the -g flag will have no effect on the nature of the code generated by the compiler.
Note that running the “strip” command on an executable will remove it's symbol table. Users should
avoid that step to retain the generated symbol table.
6 op_scope description of operation.
6.1 Overview
op_scope consists of a variety of commands, all of which begin with the string “op_scope”. Some of
these commands replicate functionality that may already exist on a given Linux system. These
replications are necessary to ensure that a) the functionality exists without further ado, and b) the
functionality is of a version compatible with op_scope. An example of such a command is:
op_scope_readelf
You may or may not have the readelf command installed on your system. Having a version specific for
op_scope ensures that the command is available for op_scope, and that it cannot possibly conflict with
your own use of the normal readelf command. The complete list of op_scope commands is:
op_scope
op_scope_dump
op_scope_get_regions
op_scope_nm
op_scope_objdump
op_scope_papi_avail
op_scope_papi_native_avail
op_scope_papi_preload
op_scope_populate
op_scope_readelf
op_scope_runner
op_scope_runner_env_check
Installation of op_scope generally involves putting these commands in some convenient directory, and
adding this directory to your PATH.
As a user, you will only ever need to directly use three of these commands. They are:
op_scope_papi_avail
This is op_scope's version of the standard “papi_avail” command. Use this command to get a list of the
PAPI-defined set of counters.
IMPORTANT NOTE: No PAPI event defined as “derived” can be used with op_scope. Use the
op_scope_papi_avail command to determine if a PAPI-define event is “derived”. We strongly
recommend that you always use the native event names.
op_scope_papi_native_avail
This is op_scope's version of the standard “papi_native_avail” command. Use this command to get a
list of native events for your system. We strongly recommend that you always use native event names.
Note that any other papi commands available on your system, such as papi_avail, or papi_native_avail,
may not be compatible with the op_scope versions, and you should not use them to get event names for
use with op_scope. You must use op_scope_papi_avail and/or op_scope_papi_native_avail for these
purposes.
op_scope_runner
This is the command used to run your code and get performance data for viewing by the op_scope user
interface.
The simplest usage of op_scope is as follows:
op_scope_runner ./a.out
./op_scope_ui
The op_scope_runner script will run your program, “a.out”, under it's control. At the end of processing,
it will create a script called “op_scope_ui” in the current directory. You invoke this “op_scope_ui”
script to perform the actions of viewing the performance data. In this case, with no arguments to
op_scope_ui, the GUI will open as an X-window.
op_scope is always built with the latest version of PAPI. A new release of PAPI requires op_scope to
be rebuilt by Supersmith and redistributed. There is no way to have op_scope work with a different
version of PAPI other than the one is was built with at Supersmith. This is done purposefully, to ensure
that all op_scope components are consistent with one version of papi.
6.2 Interface with PAPI
op_scope makes use of the “PAPI_sprofil” C interface. This routine provides the functionality to obtain
the histograms of performance counter data. Please reference the PAPI documentation for details.
6.3 Running your code with op_scope_runner
op_scope_runner is a bourne-shell script used to run your program under the control of op_scope. It's
main function is to apply the LD_PRELOAD environment variable, set to the shared object
“op_scope_papi_preload”, to the execution of your program. Under no circumstances attempt to set
LD_PRELOAD yourself. Having the LD_PRELOAD set to “op_scope_papi_preload” enables all the
functionality of the data-gathering phase of op_scope.
All communication of various possible option settings for op_scope_papi_preload is done via
environment variables, all of which begin with the string “OP_SCOPE_”. An alphabetized list of
op_scope environment variables, and the phase of processing to which they apply, may be found in
section xxx.
The two most important environmental variables are:
OP_SCOPE_EXE
OP_SCOPE_EVENTS
The OP_SCOPE_EXE environmental variable is used in the case where your program is not the first
argument to op_scope_runner. For example, if you are using MPI, your run command may look like:
mpiexec -np 128 a.out
In this case you have to specify:
export OP_SCOPE_EXE=a.out
op_scope_runner -np 128 a.out
If the OP_SCOPE_EXE environment variable was not set in the above case, then op_scope_runner
would assume the executable was the first token on it's command line, which is “-np”, which does not
exist as a program.
Another case where you would want to use the OP_SCOPE_EXE environment variable would be the
case where your executable's invocation is buried inside a complex startup script.
The OP_SCOPE_EVENTS environment variable is used to specify the name of the events to use in
op_scope performance data gathering. If it is not set, the default will be one counter, set to
CPU_CLK_UNHALTED. Multiple counters may be specified at one time such as:
export OP_SCOPE_EVENTS=CPU_CLK_UNHALTED,RETIRED_SSE_OPERATIONS:ALL
op_scope_runner a.out
See that here, we have just specified two counters, with a comma, “,” as the delimiter. Different
processors will have different rules about how many events may be processed simultaneously, and
what types of events can be mixed together. Additionally, different counters can have events occurring
at wildly different rates. We strongly advise the user to only gather data for one counter at a time. How
to gather data into a coherent whole doing one counter at a time, and to alter the sensitivity, or “bucket
size” for the different counters, is described in detail in section xxx.
At the end of processing, op_scope_runner will create a script named “op_scope_ui”, which stands for
“Op_scope User Interface”. You invoke this script to enable viewing of the results. You should invoke
the script as:
./op_scope_ui
This will always start the op_scope_ui script in the current directory, whether or not you have the
current directory in your PATH. The op_scope_ui script will be created in the directory where you
launched the op_scope_runner command. There is no option to change the name of this script.
The op_scope_ui script accepts various options as described below.
6.3 Examining the data with op_scope_ui in GUI mode
After the creation of the “op_scope_ui” script using the op_scope_runner command as described above,
one simply invokes it with no arguments to bring up the GUI. For example:
Consider this script:
#!/bin/sh
set -e -x
cat main.f
cat toto.f
gfortran -O3 -g -c main.f
gfortran -O3 -g -c toto.f
gfortran -O3 -g main.o toto.o
export OP_SCOPE_EVENTS=CPU_CLK_UNHALTED
export OP_SCOPE_EXE=./a.out
time op_scope_runner ${OP_SCOPE_EXE}
./op_scope_ui
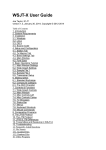
We will now run this script, getting the text output shown here, and the GUI window opening up
below.
+ cat main.f
program main
implicit none
double precision a (10000)
double precision b (10000)
integer i, j
do i = 2, 1000
do j = 1, 10000
a(j) = j
b (j) = j
end do
call toto (a, b, 10000)
end do
print *, a(100)
end
+ cat toto.f
subroutine toto (a, b, n)
implicit none
integer n
integer i
double precision a (n), b(n)
do i = 1, n
a (i) = a(i) * b (i) + cos (b (i)) + sin (b (i))
end do
return
end
+ gfortran -O3 -g -c main.f
+ gfortran -O3 -g -c toto.f
+ gfortran -O3 -g main.o toto.o
+ export OP_SCOPE_EVENTS=CPU_CLK_UNHALTED
+ OP_SCOPE_EVENTS=CPU_CLK_UNHALTED
+ export OP_SCOPE_EXE=./a.out
+ OP_SCOPE_EXE=./a.out
+ op_scope_runner ./a.out
op_scope created user interface script: /home/dpb/optests/x86/loop/op_scope_ui
10000.355953231177
real
0m3.739s
user
0m3.534s
sys
0m0.192s
+ ./op_scope_ui
op_scope_dump.c line 415: op_scope_dump is creating symbol table file:
/home/dpb/optests/x86/loop/a.out.ecfa2f7c1ef91305e910e4e290f0ca2f.L.txt
op_scope_dump.c line 407: op_scope_dump is creating disassembly file:
/home/dpb/optests/x86/loop/a.out.ecfa2f7c1ef91305e910e4e290f0ca2f.d.txt
op_scope_dump.c line 415: op_scope_dump is creating symbol table file: /home/dpb/optests/x86/loop/ld2.17.so.0ac3abf58d1993a7f88302cea0cde12d.L.txt
op_scope_dump.c line 407: op_scope_dump is creating disassembly file: /home/dpb/optests/x86/loop/ld2.17.so.0ac3abf58d1993a7f88302cea0cde12d.d.txt
op_scope_dump.c line 415: op_scope_dump is creating symbol table file:
/home/dpb/optests/x86/loop/op_scope_papi_preload.45ae063ac0c3481380137c4ad05af3b8.L.txt
op_scope_dump.c line 407: op_scope_dump is creating disassembly file:
/home/dpb/optests/x86/loop/op_scope_papi_preload.45ae063ac0c3481380137c4ad05af3b8.d.txt
op_scope_dump.c line 415: op_scope_dump is creating symbol table file:
/home/dpb/optests/x86/loop/libgfortran.so.3.0.0.d80e596f03494d16155bb58f32f239b4.L.txt
op_scope_nm: /usr/lib64/libgfortran.so.3.0.0: no symbols
op_scope_dump.c line 407: op_scope_dump is creating disassembly file:
/home/dpb/optests/x86/loop/libgfortran.so.3.0.0.d80e596f03494d16155bb58f32f239b4.d.txt
op_scope_dump.c line 415: op_scope_dump is creating symbol table file: /home/dpb/optests/x86/loop/libm2.17.so.ad0cc06504cd786a3fd59e4e019a5da9.L.txt
op_scope_dump.c line 407: op_scope_dump is creating disassembly file: /home/dpb/optests/x86/loop/libm2.17.so.ad0cc06504cd786a3fd59e4e019a5da9.d.txt
op_scope_dump.c line 415: op_scope_dump is creating symbol table file:
/home/dpb/optests/x86/loop/libgcc_s.so.1.2f5b1d92b6e80f9dde2e1c82818d40b3.L.txt
op_scope_nm: /lib64/libgcc_s.so.1: no symbols
op_scope_dump.c line 407: op_scope_dump is creating disassembly file:
/home/dpb/optests/x86/loop/libgcc_s.so.1.2f5b1d92b6e80f9dde2e1c82818d40b3.d.txt
op_scope_dump.c line 415: op_scope_dump is creating symbol table file:
/home/dpb/optests/x86/loop/libquadmath.so.0.0.0.3ff0961baf31c9034ebcce642c53c61c.L.txt
op_scope_nm: /usr/lib64/libquadmath.so.0.0.0: no symbols
op_scope_dump.c line 407: op_scope_dump is creating disassembly file:
/home/dpb/optests/x86/loop/libquadmath.so.0.0.0.3ff0961baf31c9034ebcce642c53c61c.d.txt
op_scope_dump.c line 415: op_scope_dump is creating symbol table file: /home/dpb/optests/x86/loop/libc2.17.so.333a0ddcd9034608a69ec2210d1a4c9c.L.txt
op_scope_dump.c line 407: op_scope_dump is creating disassembly file: /home/dpb/optests/x86/loop/libc2.17.so.333a0ddcd9034608a69ec2210d1a4c9c.d.txt
op_scope_dump.c line 415: op_scope_dump is creating symbol table file:
/home/dpb/optests/x86/loop/libdl-2.17.so.c0e84719202952bb181d0d42a873b6dc.L.txt
op_scope_dump.c line 407: op_scope_dump is creating disassembly file: /home/dpb/optests/x86/loop/libdl2.17.so.c0e84719202952bb181d0d42a873b6dc.d.txt
op_scope_dump.c line 415: op_scope_dump is creating symbol table file:
/home/dpb/optests/x86/loop/libnsl-2.17.so.efce63ed874919a290094f315a3929e8.L.txt
op_scope_dump.c line 407: op_scope_dump is creating disassembly file:
/home/dpb/optests/x86/loop/libnsl-2.17.so.efce63ed874919a290094f315a3929e8.d.txt
op_scope_dump.c line 415: op_scope_dump is creating symbol table file:
/home/dpb/optests/x86/loop/libX11.so.6.3.0.bbf8ba619de6dd36e3bf5ad372331bf1.L.txt
op_scope_nm: /usr/lib64/libX11.so.6.3.0: no symbols
op_scope_dump.c line 407: op_scope_dump is creating disassembly file:
/home/dpb/optests/x86/loop/libX11.so.6.3.0.bbf8ba619de6dd36e3bf5ad372331bf1.d.txt
op_scope_dump.c line 415: op_scope_dump is creating symbol table file:
/home/dpb/optests/x86/loop/libXext.so.6.4.0.c04c03669a04d90857d4b85d8d864925.L.txt
op_scope_nm: /usr/lib64/libXext.so.6.4.0: no symbols
op_scope_dump.c line 407: op_scope_dump is creating disassembly file:
/home/dpb/optests/x86/loop/libXext.so.6.4.0.c04c03669a04d90857d4b85d8d864925.d.txt
op_scope_dump.c line 415: op_scope_dump is creating symbol table file:
/home/dpb/optests/x86/loop/libxcb.so.1.1.0.0800ac6fed75640dfc544143a10f247b.L.txt
op_scope_nm: /usr/lib64/libxcb.so.1.1.0: no symbols
op_scope_dump.c line 407: op_scope_dump is creating disassembly file:
/home/dpb/optests/x86/loop/libxcb.so.1.1.0.0800ac6fed75640dfc544143a10f247b.d.txt
op_scope_dump.c line 415: op_scope_dump is creating symbol table file:
/home/dpb/optests/x86/loop/libXau.so.6.0.0.65b7c90d4333063d744c50f4ffe8b9f0.L.txt
op_scope_nm: /usr/lib64/libXau.so.6.0.0: no symbols
op_scope_dump.c line 407: op_scope_dump is creating disassembly file:
/home/dpb/optests/x86/loop/libXau.so.6.0.0.65b7c90d4333063d744c50f4ffe8b9f0.d.txt
Note that some of the output text with long filenames has been wrapped in the terminal window.
Section 6.5 will explain what all these files are, show how to control their location to be somewhere
other than the current directory, and how to make it such that you will not have to deal with the
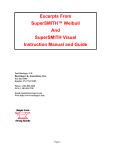
creation of so many files every time an op_scope_ui script is invoked. The GUI that results from this
looks like:
The structure and capabilities of the GUI will be explained later in this document.
6.4 Examining the data with op_scope_ui in text mode
Congruent with the example script in section 6.3 above, we can also use op_scope_ui to examine the
data in text mode. At it's simplest, this would look like:
+ ./op_scope_ui -p 0
op_scope [/home/dpb/optests/x86/loop] a.out (elf64-x86-64)
Column 0 of 1
Host atomic.site (AMD A6-3650 APU with Radeon(tm) HD Graphics 2600.00 Mhz) of 1 hosts total
Thread 0
CPU_CLK_UNHALTED (bucket size: 260000)
/home/dpb/optests/x86/loop/a.out.ecfa2f7c1ef91305e910e4e290f0ca2f.c.txt
33980 Total
19778 libm-2.17.so/feraiseex/cept
7011 libm-2.17.so/__sin_sse2
6240 libm-2.17.so/__cos_sse2
355 libm-2.17.so/sincos
241 a.out/toto_
97 a.out/MAIN__
81 op_scope_papi_preload/find_buffer
59 libm-2.17.so/csloww1
38 libm-2.17.so/*ABS*+0xafa0@plt
31 libm-2.17.so/qsort@plt
20 op_scope_papi_preload/output_data
15 libm-2.17.so/__dubsin
8 libm-2.17.so/csloww
4 libm-2.17.so/__dubcos
1 libc-2.17.so/__parse_one_specmb
1 a.out/sincos@plt
It can be seen that on this second invocation of op_scope_ui, none of the files created in section 6.3
needed to be re-created. This explained in more detail in section 6.5. It can also be seen that the text
output has the same information as the GUI image in section 6.3. In essence, this an ordered list of
subroutines, sorted by counter values. Note that the op_scope_ui accepts arguments, which are passed
along to the invocation of the op_scope command inside the script. In this case, the arguments were: “p 0”, which means “print the data for column 0”. A complete list of op_scope arguments may be found
in section xxx. You can always generate the list of op_scope options yourself online, by simply
invoking “op_scope” with no arguments. These described arguments are passed on by op_scope_ui to
the embedded op_scope command. Note that due to the complexity of files required by op_scope, it is
not anticipated that users would invoke the op_scope command themselves. In all cases, this will be
done via the generated op_scope_ui script, which reflects the information required to display
performance information from the set of files associated with the running of your program.
6.5 Files created by op_scope
op_scope creates files of three types. They are all text files. Note that when the op_scope_ui interface
script is created at the termination your program, it is created with all the proper filenames incorporated
from the runtime, since your running program “knows” all this information as it exits. With MPI, note
that each rank will write one “counter” file, while only the master rank will write the “op_scope_ui”
script.
Files with the suffix “.c.txt”
These are known as “counter” files, and contain information derived from correlating addresses of your
code or libraries with Hardware Performance Counter data. They are text files, but in an internal
op_scope-specific format.
The full filename prefix for these counter files incorporates the name of the executable or library,
optional MPI rank indication, optional threading information, followed by the md5sum of the
executable or library used at runtime. The md5sum is incorporated as part of the filename to make it
impossible to use the wrong counter file associated with your program.
Files with the suffix “.d.txt”
These are know as “disassembly” files. They consist of the output of “op_scope_objdump -d” applied
to the various components of your code. i.e. your executable itself, and any libraries dynamically
linked. They are text files, and similar, if not identical, to the output of the “objdump -d” command on
your system, if you happen to have objdump installed. op_scope uses these files to parse the assembly
opcodes for presentation in GUI or text modes.
The full filename prefix for these disassembly files incorporates the name of the executable or library
followed by the md5sum of the executable or library used at runtime. The md5sum is incorporated as
part of the filename to make it impossible to use the wrong disassembly file associated with your
program.
Files with the suffix “.L.txt”
These are known as “symboL table files”. They are text files, but in an internal op_scope-specific
format. They contain information derived from the “op_scope_nm” and “op_scope_readelf”
commands. There will be one of these files for each corresponding “.d.txt” file. They will be present,
but very small, even if a given disassembled entity has no symbol table.
The full filename prefix for these symbol table files incorporates the name of the executable or library
followed by the md5sum of the executable or library used at runtime. The md5sum is incorporated as
part of the filename to make it impossible to use the wrong symbol table file associated with your
program.
6.6 Files created by op_scope: controlling their location
Some of the files (the counter files) mentioned in section 6.5 are created (by default) in the current
working directory at the conclusion of your program when op_scope_runner is invoked. The others,
(disassembly and symbol table files) are created at the start of the op_scope_ui script, also, by default,
in the current working directory.
Note that the disassembly and symbol table files will only be created on the first invocation of
op_scope_ui. The command that that creates them, “op_scope_dump”, uses time of creation and
recorded md5sums to only create new disassembly and symbol table files if actually required.
Users may find the presence of these files in their working directories annoying and confusing. Also,
many of these files would be common to other uses of op_scope with other programs you may be
profiling. The shared libraries, for example. For this reason, there are three op_scope environment
variables that can be set to put these files in more convenient locations. The three variables are now
discussed, and represent three natural groupings of the files in question.
OP_SCOPE_DISLOC
This is the location of disassembly and symbol table files that are derived from all the shared libraries.
That is, all executable components of you program except your program itself. It is useful to set this
environment variable to one central location, perhaps in your home directory or some other central
location. This way, different runs of op_scope will most likely not have to recreate disassembly and
symbol table files that are shared, or common. You may want to set this location in your .cshrc or other
login initialization file, so that it it always set the same value.
For example:
in ,cshrc:
setenv OP_SCOPE_DISLOC ${HOME}/disloc
or
export OP_SCOPE_DISLOC=${HOME}/disloc
perhaps elsewhere.
Of course, you will have to actually create the directory.
OP_SCOPE_EXE_DISLOC
This is the location of the disassembly and symbol table files of your program. It makes sense to place
these in a directory located in your working directory when running your program. An example might
be:
export OP_SCOPE_EXE_DISLOC `pwd`/exe_disloc
rm -rf ${OP_SCOPE_EXE_DISLOC}
mkdir ${OP_SCOPE_EXE_DISLOC}
See how in the example commands, we have defined the location, then removed it, and recreated the
empty directory. You may find it convenient to manage your files in this way, as it prevents the
accumulation of numerous versions of disassembly and symbol table files from different versions of
your program as you go through the normal edit/compile/run cycle.
OP_SCOPE_CTRLOC
This is the location of the counter files that contain the performance information. There will be at least
one, on potentially many thousands if you are using MPI with thousands of ranks. It alos makes sense
to place this location in the current working directory as follows:
export OP_SCOPE_CTRLOC `pwd`/ctrloc
rm -rf ${OP_SCOPE_CTRLOC}
mkdir ${OP_SCOPE_CTRLOC}
It is not required to delete previous counter files in this manner, as op_scope will simply over-write
previous versions. It is good practice, though. For example, an MPI program may fail, leving the
counter files in an indeterminate state of mixing between an older run and the current run. It would be
best practice to delete any previous counter files.
6.7 Files Summary
Files created and used by op_scope have been discussed. The best practice of a sequence of commands
such as follows should be used with op_scope to best manage generated files.
export OP_SCOPE_DISLOC=${HOME}/disloc
# This best set in .cshrc
export OP_SCOPE_EXE_DISLOC=`pwd`/exe_disloc
rm -rf ${OP_SCOPE_EXE_DISLOC}
mkdir ${OP_SCOPE_EXE_DISLOC}
export OP_SCOPE_CTRLOC `pwd`/ctrloc
rm -rf ${OP_SCOPE_CTRLOC}
mkdir ${OP_SCOPE_CTRLOC}
# Following from previous discussion
export OP_SCOPE_EXE=./a.out
export OP_SCOPE_EVENTS=CPU_CLK_UNHALTED
op_scope_runner ${OP_SCOPE_EXE)
./op_scope_ui -d
# use -d flag to get disassemblies etc.
Note that we have added a new flag to the op_scope_ui script in the above sample. This causes
op_scope_ui to ONLY create the disassembly and symbol table files. No GUI will start. This is a good
thing to do in your script that runs your program under the control of op_scope. The reason for this,
especially if you are using a large batch system, is that you need to capture the disassemblies and
symbol table files of the actual libraries that were used at the time and system where your program ran.
These files may not be the same on your “front end”, where you will most likely be running the GUI.
7 Description of how op_scope is installed on a system.
op_scope is typically installed and made available on a system via a “module”. The user loads the
module, and the location of the op_scope commands isp lace in the user's PATH. As was mentioned in
section 6.1, the op_scope installation merely consists of a set of commands which all begin with the
string “op_scope”. There are no libraries or other components. Thus, users can load the op_scope
module and be confident it will not possibly interfere with their use of the system, unless they
specifically invoke op_scope commands themselves. On a hypothetical system this module loading
may look like:
module load /u/dpbarker/public/supersmith/modules/op_scope_3.0.sgi
or
module load /u/dpbarker/public/supersmith/modules/op_scope_3.0.intel
Note that versions of op_scope are specific to the type of MPI that may be used. The op_scope_3.0.sgi
module is for use with the so-called SGI MPT MPI subsystem, while op_scope_3.0.intel if or use with
the Intel supplied equivalent.
If no MPI is being used in your program, then either module could be used, as there would be no
difference in that case. Note that the op_scope_3.0.sgi module may be a symbolic link to a sub-verison
of the 3.0 version. The modules themselves are quite simple, merely setting up the PATH, as shown
below.
pfe23:/home4/dpbarker> cd /u/dpbarker/public/supersmith/modules
pfe23:/home4/dpbarker/public/supersmith/modules> ls -l op_scope_3.0.sgi
lrwxrwxrwx 1 dpbarker scicon 18 Jan 14 13:50 op_scope_3.0.sgi -> op_scope_3.0.1.sgi
pfe23:/home4/dpbarker/public/supersmith/modules> cat op_scope_3.0.1.sgi
#%Module
prepend-path
PATH
/u/dpbarker/public/supersmith/op_scope.sgi.generic.nas.3.0.1/bin
pfe23:/home4/dpbarker/public/supersmith/modules>
When op_scope_ui is invoked, it must use the version of op_scope that was used at the time the
associated op_scope files were created. i.e. when op_scope_runner was invoked. To ensure that, the
op_scope_ui command is created with the paths to the op_scope commands embedded in the script
itself. This way, as new op_scope versions are installed, the old versions of op_scope_ui will continue
to function as long as the old op_scope installations are not removed. Of course, if new op_scope
features are desired to be used, the user would simply have to re-run their program using the latest
op_scope.
8 Using op_scope: The simplest program.
To be supplied
9 Using op_scope: The simplest threaded (OpenMP) program.
To be supplied
9 Using op_scope: The simplest MPI program.
To be supplied
10 Using op_scope: A Hybrid MPI/OpenMP program.
To be supplied
11 Working with multiple counters.
To be supplied.
12 How to obtain performance data for dynamic libraries opened
at runtime. (i.e. not at startup)
To be supplied.
12 What do the counters mean?
To be supplied.
13 Alphabetized description of op_scope environment variables.
To be supplied.
14 List of op_scope command arguments, that may be supplied
to the generated “op_scope_ui” script.
To obtain version and license information for op_scope, invoke:
op_scope -v
For example:
atomic.site:/home/dpb> op_scope -v
OP_SCOPE is licensed software created by SUPERsmith, this version
3.0.1 dated: Wed Jan 14 18:28:21 2015, license expires: Tue Mar 17
19:28:21 2015
atomic.site:/home/dpb>
To obtain a list of arguments that may be supplied to the op_scope command embedded in the
generated op_scope_ui script, invoke op_scope with no arguments. Fore example:
atomic.site:/home/dpb> op_scope
the -C flag and argument must be specified
Usage: op_scope -d files.d.txt files.c.txt
where:
files.d.txt is (for example) the output of "objdump -d -l a.out"
files.c.txt are the various *.c.txt files
Advanced options:
-A aaa
supply additional argument aaa to script invocation
-B bbb
specify interpretation
bbb is one of:
relaxed
blocks have
strict
blocks have
stricter
blocks have
of code blocks
one entry, multiple exits (default)
one entry, one exit
one entry, one exit, calls also delimit blocks
-C n
only display data for the indicated column number (n)
-D ddd
specify the executable (ddd) which is the demangler for demangling C++ routine names
-f fff
Perform flopper processing, sending output to file fff
-h hhh
set initial window height to hhh pixels
-H
output header file to assist build of shared object for inclusion
-l lll
lll is the directory where all of the -d files reside
-o subname:offset
Add hexadecimal "offset" to display of addresses in routine "subname"
use for correlating assembly listings when named routine does not
begin at address zero.
-p n
output list of routines sorted by n'th column. No GUI will start.
(add -b flag to get basic block info in output, add -i flag for opcodes)
-p t
output list of column totals. No GUI will start.
-p A
output list of average column totals. No GUI will start.
-p T
output list of column grand totals. No GUI will start.
-p S
output minimum, maximum, average and standard deviation for each event across all
ranks/threads. No GUI will start.
-p p
Just print subroutine info. No GUI will start.
(add -b flag to get basic block info in output, add -i flag for opcodes)
-P
Show column values as percentages.
-Q qqq
a Quick shorthand option where qqq is a tag indicating convenient modes of operation
qqq is one of:
compact
the gui opening screen file labels are not displayed
flopper
the output will the a csv file of flopper information.
grey
the gui will use grey in place of green
itanium
the target architecture is ITANIUM
mips
the target architecture is MIPS
nocolor
the gui will only use black and white
norank
the gui will use host+pid instead of rank
-s sss
use script sss instead of ascript for the script button
-U uuu
incorporate shared object uuu into the op_scope program
-v
print version information and immediately exit
-w www
set initial window width to www pixels
-W wlevel
set warning threshold to wlevel
atomic.site:/home/dpb>