1
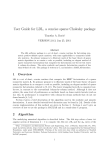
HPCToolkit WORKFLOW
profile
execution
compile & link
call stack
profile
[hpcrun]
app.
source
optimized
binary
•  Presentation
•
•
•
binary
analysis
[hpcstruct]
explore performance data from multiple perspectives
•  rank order by metrics to focus on what’s important
•  compute derived metrics to help gain insight
•  e.g. scalability losses, waste, CPI, bandwidth
graph thread-level metrics for contexts
explore evolution of behavior over time
presentation
[hpcviewer/
hpctraceviewer]
11
program
structure
database
interpret profile
correlate w/ source
[hpcprof/hpcprof-mpi]