1
■ Print Data
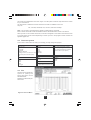
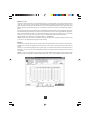
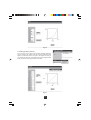
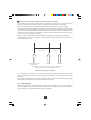
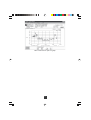
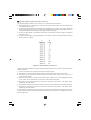
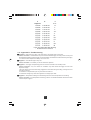
To obtain a tabular listing of the data, select “Print Data”. The listing gives the date, time, value and units
for each reading. To save paper, the data is printed in small type, five columns to a page. A list may
contain from three to five pages. Here is an example of a printout with two data lines.
■ Graph to Clipboard
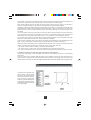
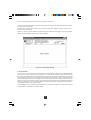
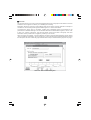
To place the graph in a document, select “Graph to Clipboard‘’. The graph is placed in the Windows
clipboard. From there, it can be pasted into another graphic application such as PowerPoint or Freelance.
■ Scaling
1. Scale And Engineering Unit Programming *
The data logger Models L320, L410 and L430 allow the operator to program the values for scale and
engineering units from within the software. This permits the user to display the recorded data on the
graph or in the tabular listing directly, in the units appropriate to the measurement, rather than
mathematically converting a voltage or a current to the proper scale and value after the graph is displayed.
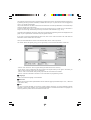
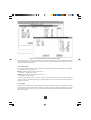
Scales can be programmed from two locations in the software, the File menu and the Scale menu. To
create a library of scales to use with DC volt and DC current loggers, use the File menu. This will allow
the user to select a number of predefined scales. To create scales for loggers connected to the serial
port for downloading, use the Scale menu.
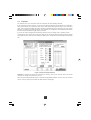
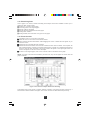
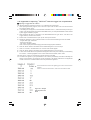
The Simple Logger software allows the operator to define up to 17 points along the scale for DC current
measurement type data loggers.
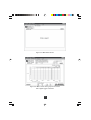
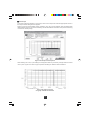
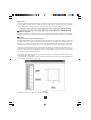
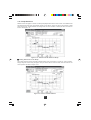
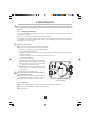
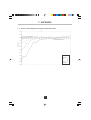
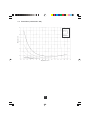
Any combination of points may be used to create the scale which allows the user to plot both linear and
non-linear data. (See Figures 3.5 and 3.6)
Fig 3.5
* Software version 4.0 or higher is required for this feature
21