1
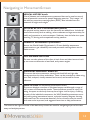
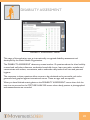
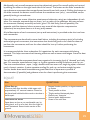
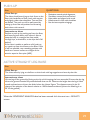
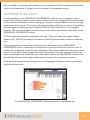
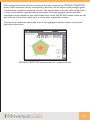
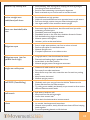
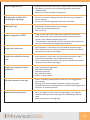
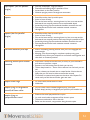
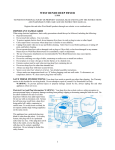
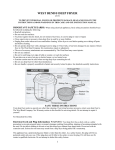
Injury risk screen is the opening results screen. The screen has a bar graph on the left-hand side. This will have a yellow circle and a value out of 100 % next to it indicating the calculated overall % probability for injury. This is based on all the input variables entered in to the program. There are also some labels to indicate the categories of risk. Low % Injury risk values are associated with a lower probability of an injury to the client and will be shown in the ‘low’ category on the screen. This corresponds to a % Injury risk of less than 12. Clients with values between 12<25 are at ‘moderate’ risk, between 25<50 at ‘signicant’ risk, from 50<75 at ‘high’ risk and clients with % Injury risk of 75 or above are at a ‘very high’ risk of musculoskeletal injury. Also shown on this screen are the injury ‘hot spots’ calculated from the specic question responses and movement scores achieved in the various activities of the movement analysis process. The gures illustrate where on the body the high-very high, signicant and moderate joints for injury risk are located. These will be shown as red, orange and yellow circles, respectively. Joints not associated with any coloured circles are at a risk less than moderate based on the information provided by the client. INJURY/PAIN areas If the user has checked an ‘injury/pain’ button on any of the individual movements [on the MOVEMENT ANALYSIS screen] then any body parts/joints identied at that time will automatically be shown as red on the INJURY RISK results screen. Other higher risk injury sites may also be shown in red but this would depend on the calculated scores when all information is entered into our algorithms for injury risk calculations. INJURY RISK screen 32