1
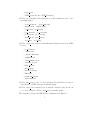
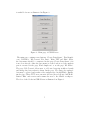
• ’dp’: Amplicon boundaries computed with dynamic programming,
• ’tu’: Indices to the changes of amplicon boundaries,
• ’chromo’: Indices to chromosome starts,
• ’basepair’: Cumulative base-pairs,
• ’samples’: Names of the samples.
Only one data set can be illustrated at a time but it is possible to observe
several properties of the data simultaneously.
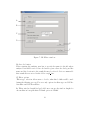
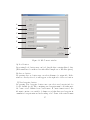
B) Selected data -text box
The name of the selected data file is seen in textbox: ’Selected data’.
F
G
H
B
A
C
D
E
K
I
L
M
J
O
N
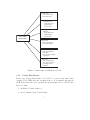
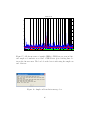
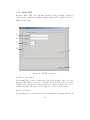
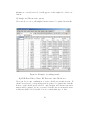
Figure 13: Plot Data -window.
20
P