1
CUDA-GDB (NVIDIA CUDA
Debugger)
DU-05227-001_V3.2 | October 14, 2010
User Manual
TABLE OF CONTENTS
1 Introduction.......................................................................... 1
cuda-gdb: The NVIDIA CUDA Debugger .......................................... 1
What’s New in Version 3.2 ......................................................... 2
2 cuda-gdb Features and Extensions .............................................. 3
Getting Help ......................................................................... 4
Debugging CUDA applications on GPU hardware in real time ................ 4
Extending the gdb debugging environment ..................................... 4
Supporting an initialization file................................................... 4
Pausing CUDA execution at any function symbol or source file line number5
Single-stepping individual warps ................................................. 5
Displaying device memory in the device kernel................................ 5
Variable Storage and Accessibility ............................................ 6
Switching to any coordinate or kernel ........................................... 7
Inspecting the coordinates or kernel ......................................... 7
Changing the coordinate or kernel focus .................................... 7
cuda-gdb info commands .......................................................... 9
Breaking into running applications .............................................. 12
Displaying context and kernel events........................................... 12
Display CUDA context events ................................................. 12
Display CUDA kernel events ................................................... 12
Examples of events displayed................................................. 12
Checking memory errors .......................................................... 13
GPU Error Reporting ............................................................... 13
Multi-GPU debugging .............................................................. 16
3 Installation and Debug Compilation ............................................17
Installation Instructions ........................................................... 17
Compiling for Debugging .......................................................... 18
Compiling/Debugging for Fermi and Tesla GPUs .............................. 18
Compiling for Fermi GPUs ..................................................... 18
Compiling for Fermi and Tesla GPUs ......................................... 18
4 cuda-gdb Walk-through ...........................................................19
Graphics Driver CUDA-GDB (NVIDIA CUDA Debugger)
DU-05227-001_V3.2 | i
TABLE OF CONTENTS
bitreverse.cu Source Code ....................................................... 19
Walking Through the Code........................................................ 20
Appendix A: Supported Platforms ...............................................24
Host Platform Requirements ..................................................... 24
GPU Requirements ................................................................. 24
Appendix B: Known Issues ........................................................25
Graphics Driver CUDA-GDB (NVIDIA CUDA Debugger)
DU-05227-001_V3.2 | ii
01 INTRODUCTION
This document introduces cuda‐gdb, the NVIDIA® CUDA™ debugger, and describes what is new in version 3.2.
cuda-gdb: The NVIDIA CUDA Debugger
cuda‐gdb is an extension to the standard i386/AMD64 port of gdb, the GNU Project debugger, version 6.6. It is designed to present the user with seamless debugging environment that allows simultaneous debugging of GPU and CPU code. Standard debugging features are inherently supported for host code, and additional features have been provided to support debugging CUDA code. cuda‐gdb is supported on 32‐bit and 64‐bit Linux. Note: All information contained within this document is subject to
change.
CUDA-GDB (NVIDIA CUDA Debugger)
DU-05227-001_V3.2 | 1
Chapter 01 : I NTRODUCTION
What’s New in Version 3.2
In this latest cuda‐gdb version the following improvements and changes have been made:
GPU error reporting
cuda‐gdb now catches and reports all hardware errors on GPUs with sm_type sm_20 and higher. These are hardware errors caused by the application and get reported as thread level, warp level, and global errors. Please note that not all errors are precise.
See “GPU Error Reporting” on page 13 for more information.
Double register support
Variables stored in more than one register can now be accessed.
Multi‐GPU support
cuda‐gdb now supports the inspection, execution control, and placement of breakpoints with multiple CUDA‐capable devices.
See “Multi‐GPU debugging” on page 16 for more information.
New cuda‐gdb commands:
• Added a command to display the list of devices currently running a kernel1.
info cuda devices (similar to ʹinfo cuda kernelsʹ command‐ See “info cuda devices” on page 9)
• Added commands to display context and kernel events
set cuda context_events set cuda kernel_events See “Displaying context and kernel events” on page 12.
1. “Kernel” refers to your device code that executes on the GPU, while “context” refers to the virtual
address space on the GPU for your kernel. CUDA-GDB (NVIDIA CUDA Debugger)
DU-05227-001_V3.2 | 2
02 CUDA-GDB FEATURES AND
EXTENSIONS
Just as programming in CUDA C is an extension to C programming, debugging with cuda‐gdb is a natural extension to debugging with gdb. cuda‐gdb supports debugging CUDA applications that use the CUDA driver APIs in addition to runtime APIs, and supports debugging just‐in‐time (JIT) compiled PTX kernels.
The following sections describe the cuda‐gdb features that facilitate debugging CUDA applications:
“Getting Help” on page 4
“Debugging CUDA applications on GPU hardware in real time” on page 4
“Extending the gdb debugging environment” on page 4
“Supporting an initialization file” on page 4
“Pausing CUDA execution at any function symbol or source file line number” on page 5
“Single‐stepping individual warps” on page 5
“Displaying device memory in the device kernel” on page 5
“Switching to any coordinate or kernel” on page 7
“cuda‐gdb info commands” on page 9
“Breaking into running applications” on page 12
“Displaying context and kernel events” on page 12
“Checking memory errors” on page 13
“GPU Error Reporting” on page 13
“Multi‐GPU debugging” on page 16
CUDA-GDB (NVIDIA CUDA Debugger)
DU-05227-001_V3.2 | 3
Chapter 02 : CUDA- GDB FEATURES AND E XTENSIONS
Getting Help
For more information, use the cuda‐gdb help with the ʹhelp cudaʹ and ʹhelp set cudaʹ commands.
Debugging CUDA applications on GPU hardware in
real time
The goal of cuda‐gdb is to provide developers a mechanism for debugging a CUDA application on actual hardware in real time. This enables developers to verify program correctness without the potential variations introduced by simulation and emulation environments.
Extending the gdb debugging environment
GPU memory is treated as an extension to host memory, and CUDA threads and blocks are treated as extensions to host threads. Furthermore, there is no difference between cuda‐gdb and gdb when debugging host code.
The user can inspect either a specific host thread or a specific CUDA thread. To switch focus to a host thread, use the ʺthread Nʺ command. To switch focus to a CUDA thread, use the ʺcuda device/sm/warp/lane/kernel/
grid/block/threadʺ command.ʺ Note: It is important to use the cuda device 0 or cuda kernel 0 command to switch to the required device or kernel before using any of
the other CUDA thread commands.
Supporting an initialization file
cuda‐gdb supports an initialization file. The standard .gdbinit file used by standard versions of gdb(6.6) has been renamed to .cuda-gdbinit. This file accepts any cudagdb command or extension as input to be processed when the cuda-gdb command is executed.
CUDA-GDB (NVIDIA CUDA Debugger)
DU-05227-001_V3.2 | 4
Chapter 02 : CUDA- GDB FEATURES AND E XTENSIONS
Pausing CUDA execution at any function symbol or
source file line number
cuda‐gdb supports setting breakpoints at any host or device function residing in a CUDA application by using the function symbol name or the source file line number. This can be accomplished in the same way for either host or device code. For example, if the kernelʹs function name is mykernel_main, the break command is as follows:
(cuda-gdb) break mykernel_main
The above command sets a breakpoint at a particular device location (the address of mykernel_main) and forces all resident GPU threads to stop at this location. There is currently no method to stop only certain threads or warps at a given breakpoint.
Single-stepping individual warps
cuda‐gdb supports stepping GPU code at the finest granularity of a warp. This means that typing next or step from the cuda‐gdb command line (when in the focus of device code) advances all threads in the same warp as the current thread of focus. In order to advance the execution of more than one warp, a breakpoint must be set at the desired location and then the application execution continued.
A special case is the stepping of the thread barrier call __syncthreads(). In this case, an implicit breakpoint is set immediately after the barrier and all threads are continued to this point.
On GPUs with sm_type less than sm_20 it is not possible to step over a subroutine in the device code. Instead, cuda‐gdb always steps into the device function, whereas on GPUs with sm_20 and higher you can step in, over, or out of the device functions by explicitly using a __ __noinline__ __ keyword on that function or compiling the code with arch=sm_20.
Displaying device memory in the device kernel
The gdb print command has been extended to decipher the location of any program variable and can be used to display the contents of any CUDA program variable including
allocations made via cudaMalloc() data that resides in various GPU memory regions, such as shared, local, and global memory
special CUDA runtime variables, such as threadIdx CUDA-GDB (NVIDIA CUDA Debugger)
DU-05227-001_V3.2 | 5
Chapter 02 : CUDA- GDB FEATURES AND E XTENSIONS
Variable Storage and Accessibility
Depending on the variable type and usage, variables can be stored either in registers or in local, shared, const or global memory. You can print the address of any variable to find out where it is stored and directly access the associated memory. The example below shows how the variable array (which is of shared int array) can be directly accessed in order to see what the stored values are in the array. (cuda-gdb) p &array
$1 = (@shared int (*)[0]) 0x20
(cuda-gdb) p array[0]@4
$2 = {0, 128, 64, 192}
You can also access the shared memory indexed into the starting offset to see what the stored values are:
(cuda-gdb) p *(@shared int*)0x20
$3 = 0
(cuda-gdb) p *(@shared int*)0x24
$4 = 128
(cuda-gdb) p *(@shared int*)0x28
$5 = 64
The example below shows how to access the starting address of the input parameter to the kernel.
(cuda-gdb) p &data
$6 = (const @global void * const @parameter *) 0x10
(cuda-gdb) p *(@global void * const @parameter *) 0x10
$7 = (@global void * const @parameter) 0x110000
CUDA-GDB (NVIDIA CUDA Debugger)
DU-05227-001_V3.2 | 6
Chapter 02 : CUDA- GDB FEATURES AND E XTENSIONS
Switching to any coordinate or kernel
To support CUDA thread and block switching, new commands have been introduced to inspect or change the logical coordinates (kernel, grid, block, thread) and the physical coordinates (device, sm, warp, lane).
The different between grid and kernel is that ʺgrid is a unique identifier for a kernel launch on a given device (per‐device launch id), whereas kernel is a unique identifier for a kernel launch across multiple devices.
Inspecting the coordinates or kernel
To see the current selection, use the ʹcudaʹ command followed by a space‐separated list of parameters. Example: Determing the coordinates
(cuda-gdb) cuda device sm warp lane block thread
Current CUDA focus: device 0, sm 0, warp 0, lane 0, block
(0,0), thread (0,0,0).
Example: Determining the kernel focus
(cuda-gdb) cuda kernel
[Current CUDA kernel 0 (device 0, sm 0, warp 0, lane 0, grid 1,
block (0,0), thread (0,0,0))]
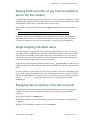
Changing the coordinate or kernel focus
To change the focus, specify a value to the parameter you want to change. For example:
To change the physical coordinates
(cuda-gdb) cuda device 0 sm 1 warp 2 lane 3
New CUDA focus: device 0, sm 1, warp 2, lane 3, grid 1,
block (10,0), thread (67,0,0).
To change the logical coordinates (thread parameter)
(cuda-gdb) cuda thread (15,0,0)
New CUDA focus: device 0, sm 1, warp 0, lane 15, grid 1,
block (10,0), thread (15,0,0).
CUDA-GDB (NVIDIA CUDA Debugger)
DU-05227-001_V3.2 | 7
Chapter 02 : CUDA- GDB FEATURES AND E XTENSIONS
To change the logical coordinates (block and thread parameters)
(cuda-gdb) cuda block (1,0) thread (3,0,0)
New CUDA focus: device 0, sm 3, warp 0, lane 3, grid 1,
block (1,0), thread (3,0,0).
Note: If the specified set of coordinates is incorrect, cuda-gdb will
try to find the lowest set of valid coordinates. If 'cuda
thread_selection' is set to 'logical', the lowest set of valid logical
coordinates will be selected. If 'cuda thread_selection' is set to
'physical', the lowest set of physical coordinates will be selected.
Use 'set cuda thread_selection' to switch the value.
To change the kernel focus, specify a value to the parameter you want to change. To change the kernel focus
(cuda-gdb) cuda kernel 0
[Switching to CUDA Kernel 0 (<<<(0,0),(0,0,0)>>>)]
#0 acos_main <<<(240,1),(128,1,1)>>> (parms={arg = 0x5100000,
res = 0x5100200, n = 5}) at acos.cu:367
367 int totalThreads = gridDim.x * blockDim.x;
CUDA-GDB (NVIDIA CUDA Debugger)
DU-05227-001_V3.2 | 8
Chapter 02 : CUDA- GDB FEATURES AND E XTENSIONS
cuda-gdb info commands
Note: The command “info cuda state” is no longer supported.
info cuda system
This command displays system information that includes the number of GPUs in the system with device header information for each GPU. The device header includes the GPU type, compute capability of the GPU, number of SMs per GPU, number of warps per SM, number of threads(lanes) per warp, and the number of registers per thread. Example:
(cuda-gdb) info cuda system
Number of devices: 1
DEV: 0/1
Device Type: gt200
Regs/LN: 128
SM Type: sm_13
SM/WP/LN: 30/32/32
info cuda device
This command displays the device information with an SM header in addition to the device header per GPU. The SM header lists all the SMs that are actively running CUDA blocks with the valid warp mask in each SM. The example below shows eight valid warps running on one of the SMs.
(cuda-gdb) info cuda device
DEV: 0/1
Device Type: gt200
SM Type: sm_13
Regs/LN: 128
SM: 0/30
valid warps: 00000000000000ff
SM/WP/LN: 30/32/32
info cuda devices
This command–similar to info cuda kernels– displays the list of devices currently running a kernel, in device index order. The device currently in focus is indicated with a ʹ*ʹ character. The first field is the device ID, the second field is the kernel ID, the third and last field is the kernel invocation (kernel name and arguments). Example:
(cuda-gdb) info cuda devices
* 0 Kernel 1 kernel0<<<(1,1),(1,1,1)>>>(...)
1 Kernel 0 kernel1<<<(1,1),(1,1,1)>>>(...)
CUDA-GDB (NVIDIA CUDA Debugger)
DU-05227-001_V3.2 | 9
Chapter 02 : CUDA- GDB FEATURES AND E XTENSIONS
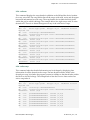
info cuda sm
This command displays the warp header in addition to the SM and the device headers for every active SM. The warp header lists all the warps with valid, active and divergent lane mask information for each warp. The warp header also includes the block index within the grid to which it belongs. The example below lists eight warps with 32 active threads each. There is no thread divergence on any of the valid active warps.
(cuda-gdb) info cuda sm
DEV: 0/1
Device Type: gt200
SM Type: sm_13
SM/WP/LN: 30/32/32
Regs/LN: 128
SM: 0/30
valid warps: 00000000000000ff
WP: 0/32
valid/active/divergent lanes: 0xffffffff/0xffffffff/
0x00000000
block: (0,0)
WP: 1/32
valid/active/divergent lanes: 0xffffffff/0xffffffff/
0x00000000
block: (0,0)
WP: 2/32
valid/active/divergent lanes: 0xffffffff/0xffffffff/
0x00000000
block: (0,0)
WP: 3/32
valid/active/divergent lanes: 0xffffffff/0xffffffff/
0x00000000
block: (0,0)
WP: 4/32
valid/active/divergent lanes: 0xffffffff/0xffffffff/
0x00000000
block: (0,0)
WP: 5/32
valid/active/divergent lanes: 0xffffffff/0xffffffff/
0x00000000
block: (0,0)
WP: 6/32
valid/active/divergent lanes: 0xffffffff/0xffffffff/
0x00000000
block: (0,0)
WP: 7/32
valid/active/divergent lanes: 0xffffffff/0xffffffff/
0x00000000
block: (0,0)
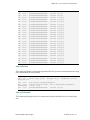
info cuda warp
This command takes the detailed information one level deeper by displaying lane information for all the threads in the warps. The lane header includes all the active threads per warp. It includes the program counter in addition to the thread index within the block to which it belongs. The example below lists the 32 active lanes on the first active warp index 0.
(cuda-gdb) info cuda warp
DEV: 0/1
Device Type: gt200
SM Type: sm_13
SM/WP/LN: 30/32/32
Regs/LN: 128
SM: 0/30
valid warps: 00000000000000ff
WP: 0/32
valid/active/divergent lanes: 0xffffffff/0xffffffff/
0x00000000
block: (0,0)
LN: 0/32
pc=0x00000000000002b8
thread: (0,0,0)
LN: 1/32
pc=0x00000000000002b8
thread: (1,0,0)
LN: 2/32
pc=0x00000000000002b8
thread: (2,0,0)
LN: 3/32
pc=0x00000000000002b8
thread: (3,0,0)
LN: 4/32
pc=0x00000000000002b8
thread: (4,0,0)
LN: 5/32
pc=0x00000000000002b8
thread: (5,0,0)
LN: 6/32
pc=0x00000000000002b8
thread: (6,0,0)
CUDA-GDB (NVIDIA CUDA Debugger)
DU-05227-001_V3.2 | 10
Chapter 02 : CUDA- GDB FEATURES AND E XTENSIONS
LN:
LN:
LN:
LN:
LN:
LN:
LN:
LN:
LN:
LN:
LN:
LN:
LN:
LN:
LN:
LN:
LN:
LN:
LN:
LN:
LN:
LN:
LN:
LN:
LN:
7/32
8/32
9/32
10/32
11/32
12/32
13/32
14/32
15/32
16/32
17/32
18/32
19/32
20/32
21/32
22/32
23/32
24/32
25/32
26/32
27/32
28/32
29/32
30/32
31/32
pc=0x00000000000002b8
pc=0x00000000000002b8
pc=0x00000000000002b8
pc=0x00000000000002b8
pc=0x00000000000002b8
pc=0x00000000000002b8
pc=0x00000000000002b8
pc=0x00000000000002b8
pc=0x00000000000002b8
pc=0x00000000000002b8
pc=0x00000000000002b8
pc=0x00000000000002b8
pc=0x00000000000002b8
pc=0x00000000000002b8
pc=0x00000000000002b8
pc=0x00000000000002b8
pc=0x00000000000002b8
pc=0x00000000000002b8
pc=0x00000000000002b8
pc=0x00000000000002b8
pc=0x00000000000002b8
pc=0x00000000000002b8
pc=0x00000000000002b8
pc=0x00000000000002b8
pc=0x00000000000002b8
thread:
thread:
thread:
thread:
thread:
thread:
thread:
thread:
thread:
thread:
thread:
thread:
thread:
thread:
thread:
thread:
thread:
thread:
thread:
thread:
thread:
thread:
thread:
thread:
thread:
(7,0,0)
(8,0,0)
(9,0,0)
(10,0,0)
(11,0,0)
(12,0,0)
(13,0,0)
(14,0,0)
(15,0,0)
(16,0,0)
(17,0,0)
(18,0,0)
(19,0,0)
(20,0,0)
(21,0,0)
(22,0,0)
(23,0,0)
(24,0,0)
(25,0,0)
(26,0,0)
(27,0,0)
(28,0,0)
(29,0,0)
(30,0,0)
(31,0,0)
info cuda lane
This command displays information per thread level if you are not interested in the warp level information for every thread.
(cuda-gdb) info cuda lane
DEV: 0/1
Device Type: gt200
SM Type: sm_13
SM/WP/LN: 30/32/32
Regs/LN: 128
SM: 0/30
valid warps: 00000000000000ff
WP: 0/32
valid/active/divergent lanes: 0xffffffff/0xffffffff/
0x00000000
block: (0,0)
LN: 0/32
pc=0x00000000000001b8
thread: (0,0,0)
info cuda kernels
This command displays the list of current active kernels and the device on which they run.
CUDA-GDB (NVIDIA CUDA Debugger)
DU-05227-001_V3.2 | 11
Chapter 02 : CUDA- GDB FEATURES AND E XTENSIONS
In the following output example, the * indicates the current kernel (only 1 right now), the first number is the kernel id, the second number is the device id:.
(cuda-gdb) info cuda kernels
* 0 Device 0 acos_main <<<(240,1),(128,1,1)>>> (parms={arg = 0x5100000, res =
0x5100200, n = 5}) at acos.cu:367
Breaking into running applications
cuda‐gdb provides support for debugging kernels that appear to be hanging or looping indefinitely. The CTRL+C signal freezes the GPU and reports back the source code location. The current thread focus will be on the host, you can use cuda kernel <n> to switch to the device kernel you need.
At this point, the program can be modified and then either resumed or terminated at the developerʹs discretion. This feature is limited to applications running within the debugger. It is not possible to break into and debug applications that have been previously launched.
Displaying context and kernel events
“Kernel” refers to your device code that executes on the GPU, while “context” refers to the virtual address space on the GPU for your kernel. Beginning with cuda‐gdb version 3.2, you can turn ON or OFF the display of CUDA context and kernel events to review the flow of the active contexts and kernels. Display CUDA context events
(cuda-gdb) set cuda context_events 1
Display CUDA context events.
(cuda-gdb) set cuda context_events 0
Do not display CUDA context events.
Display CUDA kernel events
(cuda‐gdb) set cuda kernel_events 1
Display CUDA kernel events.
(cuda‐gdb) set cuda kernel_events 0
Do not display CUDA kernel events.
CUDA-GDB (NVIDIA CUDA Debugger)
DU-05227-001_V3.2 | 12
Chapter 02 : CUDA- GDB FEATURES AND E XTENSIONS
Examples of events displayed
The following are examples of context events displayed:
[Context Create of context 0xad2fe60 on Device 0]
[Context Pop of context 0xad2fe60 on Device 0]
[Context Destroy of context 0xad2fe60 on Device 0]
The following are examples of kernel events displayed:
[Launch of CUDA Kernel 1 (kernel3) on Device 0]
[Termination of CUDA Kernel 1 (kernel3) on Device 0]
Checking memory errors
The CUDA MemoryChecker feature is enabled which allows detection of global memory violations and mis‐aligned global memory accesses. This feature is off by default and can be enabled using the the following variable in cuda‐gdb before the application is run.
set cuda memcheck on
Once CUDA memcheck is enabled, any detection of global memory violations and mis‐
aligned global memory accesses will be detected only in the run or continue mode and not while single‐stepping through the code.
You can also run CUDA memory checker as a standalone tool cuda-memcheck.
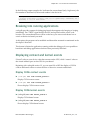
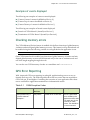
GPU Error Reporting
With improved GPU error reporting in cuda‐gdb, application bugs are now easy to identify and easy to fix. The following table shows the new errors that are reported on GPUs with sm_20 and higher. Continuing the execution of your application after these errors could lead to application termination or indeterminate results.
Table 2.1
CUDA Exception Codes
Exception code
Precision of
Scope of the Error
Description
Global error on the GPU
This is a global GPU
error caused by the
application which does
not match any of the
listed error codes
below. This should be
a rare occurrence.
the Error
CUDA_EXCEPTION_0 :
“Device Unknown
Exception”
CUDA-GDB (NVIDIA CUDA Debugger)
Not precise
DU-05227-001_V3.2 | 13
Chapter 02 : CUDA- GDB FEATURES AND E XTENSIONS
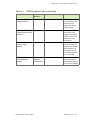
Table 2.1
CUDA Exception Codes (continued)
Exception code
Precision of
Scope of the Error
Description
the Error
CUDA_EXCEPTION_1 :
“Lane Illegal Address”
Precise
(Requires
memcheck on)
Per lane/thread error
This occurs when a
thread accesses an
illegal(out of bounds)
global address.
CUDA_EXCEPTION_2 :
“Lane User Stack
Overflow”
Precise
Per lane/thread error
This occurs when a
thread exceeds its
stack memory limit.
CUDA_EXCEPTION_3 :
“Device Hardware
Stack Overflow”
Not precise
Global error on the GPU
This occurs when the
application triggers a
global hardware stack
overflow. The main
cause of this error is
large amounts of
divergence in the
presence of function
calls.
CUDA_EXCEPTION_4 :
“Warp Illegal
Instruction”
Not precise
Warp error
This occurs when any
thread within a warp
has executed an illegal
instruction.
CUDA_EXCEPTION_5 :
“Warp Out-of-range
Address”
Not precise
Warp error
This occurs when any
thread within a warp
accesses an address
that is outside the
valid range of local or
shared memory
regions.
CUDA_EXCEPTION_6 :
“Warp Misaligned
Address”
Not precise
Warp error
This occurs when any
thread within a warp
accesses an address in
the local or shared
memory segments that
is not correctly
aligned.
CUDA_EXCEPTION_7 :
“Warp Invalid Address
Space”
Not precise
Warp error
This occurs when any
thread within a warp
executes an
instruction that
accesses a memory
space not permitted
for that instruction.
CUDA-GDB (NVIDIA CUDA Debugger)
DU-05227-001_V3.2 | 14
Chapter 02 : CUDA- GDB FEATURES AND E XTENSIONS
Table 2.1
CUDA Exception Codes (continued)
Exception code
Precision of
Scope of the Error
Description
the Error
CUDA_EXCEPTION_8 :
“Warp Invalid PC”
Not precise
Warp error
This occurs when any
thread within a warp
advances its PC
beyond the 40-bit
address space.
CUDA_EXCEPTION_9 :
“Warp Hardware Stack
Overflow”
Not precise
Warp error
This occurs when any
thread in a warp
triggers a hardware
stack overflow. This
should be a rare
occurrence.
CUDA_EXCEPTION_10 :
“Device Illegal
Address”
Not precise
Global error
This occurs when a
thread accesses an
illegal(out of bounds)
global address. For
increased precision,
"set cuda memcheck
on" in cuda-gdb.
CUDA_EXCEPTION_11 :
“Lane Misaligned
Address”
Precise
(Requires
memcheck on)
Per lane/thread error
This occurs when a
thread accesses a
global address that is
not correctly aligned.
CUDA-GDB (NVIDIA CUDA Debugger)
DU-05227-001_V3.2 | 15
Chapter 02 : CUDA- GDB FEATURES AND E XTENSIONS
Multi-GPU debugging
Multi‐GPU debugging is not much different than single‐GPU debugging except for a few additional cuda-gdb commands that let you switch between the GPUs. Any GPU hitting the breakpoint will pause all the GPUs running CUDA on that system. Once paused, you can use the info cuda kernels to view all the active kernels and the GPUs they are running on. When any GPU is resumed, all the GPUs are resumed. All CUDA‐capable GPUs can run the same or different kernels. To switch to an active kernel you can use cuda kernel <n> or cuda device <n> to switch to the desired GPU where n is the id of the kernel or GPU retrieved from info cuda kernels. Once you are on an active kernel and a GPU, then the rest of the process is the same as single‐GPU debugging. Note: The same module, and therefore the same kernel, can be
loaded and used by different contexts and devices at the same
time. When a breakpoint is set in such a kernel, by either name or
file name and line number, it will be resolved arbitrarily to only one
instance of that kernel.
With the runtime API, the exact instance to which the breakpoint
will be resolved cannot be controlled.
With the driver API, the user can control the instance to which the
breakpoint will be resolved to by setting the breakpoint right after
its module is loaded.
CUDA-GDB (NVIDIA CUDA Debugger)
DU-05227-001_V3.2 | 16
03 INSTALLATION AND DEBUG
COMPILATION
Included in this chapter are instructions for installing cuda‐gdb and for using NVCC, the NVIDIA CUDA compiler driver, to compile CUDA programs for debugging.
Installation Instructions
Follow these steps to install NVIDIA cuda‐gdb.
1 Visit the NVIDIA CUDA Zone download page: http://www.nvidia.com/object/cuda_get.html.
2 Select the appropriate Linux operating system. (See “Host Platform Requirements” on page 24.)
3 Download and install the 3.2 CUDA Driver. 4 Download and install the 3.2 CUDA Toolkit. This installation should point the environment variable LD_LIBRARY_PATH to /usr/
local/cuda/lib and should also include /usr/local/cuda/bin in the environment variable PATH.
5 Download and install the 3.2 CUDA Debugger.
CUDA-GDB (NVIDIA CUDA Debugger)
DU-05227-001_V3.2 | 17
Chapter 03 : I NSTALLATION AND DEBUG COMPILATION
Compiling for Debugging
NVCC, the NVIDIA CUDA compiler driver, provides a mechanism for generating the debugging information necessary for cuda‐gdb to work properly. The -g -G option pair must be passed to NVCC when an application is compiled in order to debug with cuda‐
gdb; for example,
nvcc -g -G foo.cu -o foo Using this line to compile the CUDA application foo.cu
forces -O0 (mostly unoptimized) compilation
makes the compiler include symbolic debugging information in the executable Compiling/Debugging for Fermi and Tesla GPUs
Compiling for Fermi GPUs
If you are using the latest Fermi board, add the following flags to target Fermi output when compiling the application: -gencode arch=compute_20,code=sm_20
Compiling for Fermi and Tesla GPUs
If you are targetting both Fermi and Tesla GPUs, include these two flags:
-gencode arch=compute_20,code=sm_20
-gencode arch=compute_10,code=sm_10
CUDA-GDB (NVIDIA CUDA Debugger)
DU-05227-001_V3.2 | 18
04 CUDA-GDB WALK-THROUGH
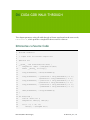
This chapter presents a cuda‐gdb walk‐through of eleven steps based on the source code, bitreverse.cu, which performs a simple 8‐bit bit reversal on a data set.
bitreverse.cu Source Code
1
2
3
4
5
6
7
8
9
10
11
12
13
14
15
16
17
18
19
20
21
22
23
24
25
26
27
28
29
#include <stdio.h>
#include <stdlib.h>
// Simple 8-bit bit reversal Compute test
#define N 256
__global__ void bitreverse(void *data) {
unsigned int *idata = (unsigned int*)data;
extern __shared__ int array[];
array[threadIdx.x] = idata[threadIdx.x];
array[threadIdx.x] = ((0xf0f0f0f0 & array[threadIdx.x]) >> 4) |
((0x0f0f0f0f & array[threadIdx.x]) << 4);
array[threadIdx.x] = ((0xcccccccc & array[threadIdx.x]) >> 2) |
((0x33333333 & array[threadIdx.x]) << 2);
array[threadIdx.x] = ((0xaaaaaaaa & array[threadIdx.x]) >> 1) |
((0x55555555 & array[threadIdx.x]) << 1);
idata[threadIdx.x] = array[threadIdx.x];
}
int main(void) {
void *d = NULL; int i;
unsigned int idata[N], odata[N];
for (i = 0; i < N; i++)
idata[i] = (unsigned int)i;
CUDA-GDB (NVIDIA CUDA Debugger)
DU-05227-001_V3.2 | 19
Chapter 04 : CUDA- GDB WALK- THROUGH
30
31
32
33
34
35
36
37
38
39
40
41
42
43
44
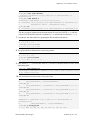
45 }
cudaMalloc((void**)&d, sizeof(int)*N);
cudaMemcpy(d, idata, sizeof(int)*N,
cudaMemcpyHostToDevice);
bitreverse<<<1, N, N*sizeof(int)>>>(d);
cudaMemcpy(odata, d, sizeof(int)*N,
cudaMemcpyDeviceToHost);
for (i = 0; i < N; i++)
printf("%u -> %u\n", idata[i], odata[i]);
cudaFree((void*)d);
return 0;
Walking Through the Code
1 Begin by compiling the bitreverse.cu CUDA application for debugging by entering the following command at a shell prompt:
$: nvcc -g -G bitreverse.cu -o bitreverse This command assumes the source file name to be bitreverse.cu and that no additional compiler flags are required for compilation. See also “Compiling for Debugging” on page 18.
2 Start the CUDA debugger by entering the following command at a shell prompt:
$: cuda-gdb bitreverse 3 Set breakpoints. Set both the host (main) and GPU (bitreverse) breakpoints here. Also, set a breakpoint at a particular line in the device function (bitreverse.cu:18). (cuda-gdb)
Breakpoint
(cuda-gdb)
Breakpoint
(cuda-gdb)
Breakpoint
b main
1 at 0x400db0: file bitreverse.cu, line 25.
b bitreverse
2 at 0x40204f: file bitreverse.cu, line 8.
b 21
3 at 0x40205b: file bitreverse.cu, line 21.
CUDA-GDB (NVIDIA CUDA Debugger)
DU-05227-001_V3.2 | 20
Chapter 04 : CUDA- GDB WALK- THROUGH
4 Run the CUDA application, and it executes until it reaches the first breakpoint (main) set in step 3. (cuda-gdb) r
Starting program: /old/ssalian-local/src/rel/gpgpu/toolkit/r3.1/bin/
x86_64_Linux_debug/bitreverse
[Thread debugging using libthread_db enabled]
[New process 4153]
[New Thread 140609798666000 (LWP 4153)]
[Switching to Thread 140609798666000 (LWP 4153)]
Breakpoint 1, main () at bitreverse.cu:25
25
void *d = NULL; int i;
5 At this point, commands can be entered to advance execution or to print the program state. For this walkthrough, continue to the device kernel. (cuda-gdb) c
Continuing.
Breakpoint 3 at 0x1e30910: file bitreverse.cu, line 21.
[Launch of CUDA Kernel 0 on Device 0]
[Switching to CUDA Kernel 0 (<<<(0,0),(0,0,0)>>>)]
Breakpoint 2, bitreverse <<<(1,1),(256,1,1)>>> (data=0x100000) at
bitreverse.cu:9
9
unsigned int *idata = (unsigned int*)data;
cuda‐gdb has detected that a CUDA device kernel has been reached, so it prints the current CUDA thread of focus. 6 Verify the CUDA thread of focus with the ʺinfo cuda threadsʺ command and switch between host thread and the CUDA threads: (cuda-gdb) info cuda threads
<<<(0,0),(0,0,0)>>> ... <<<(0,0),(255,0,0)>>> bitreverse
<<<(1,1),(256,1,1)>>> (data=0x100000) at bitreverse.cu:9
The above output indicates that there is one CUDA block with 256 threads
executing and all the threads are on the same pc.
(cuda-gdb) bt
#0 bitreverse <<<(1,1),(256,1,1)>>> (data=0x100000) at bitreverse.cu:9
Switch to host thread:
(cuda-gdb) thread
[Current thread is 2 (Thread 140609798666000 (LWP 4153))]
(cuda-gdb) thread 2
[Switching to thread 2 (Thread 140609798666000 (LWP 4153))]#0
0x0000000000400e7d in main () at bitreverse.cu:35
35
bitreverse<<<1, N, N*sizeof(int)>>>(d);
(cuda-gdb) bt
#0 0x0000000000400e7d in main () at bitreverse.cu:35
CUDA-GDB (NVIDIA CUDA Debugger)
DU-05227-001_V3.2 | 21
Chapter 04 : CUDA- GDB WALK- THROUGH
Switch to CUDA kernel:
(cuda-gdb) info cuda kernels
* 0 Device 0 bitreverse <<<(1,1),(256,1,1)>>> (data=0x100000) at
bitreverse.cu:9
(cuda-gdb) cuda kernel 0
[Switching to CUDA Kernel 0 (<<<(0,0),(0,0,0)>>>)]
#0 bitreverse <<<(1,1),(256,1,1)>>> (data=0x100000) at bitreverse.cu:9
9
unsigned int *idata = (unsigned int*)data;
(cuda-gdb) bt
#0 bitreverse <<<(1,1),(256,1,1)>>> (data=0x100000) at bitreverse.cu:9
The above output indicates that the host thread of focus has LWP ID 9146 and the current CUDA thread has block coordinates (0,0) and thread coordinates (0,0,0). 7 Corroborate this information by printing the block and thread indices:
(cuda-gdb) print
$1 = {x = 0, y =
(cuda-gdb) print
$2 = {x = 0, y =
blockIdx
0}
threadIdx
0, z = 0)
8 The grid and block dimensions can also be printed:
(cuda-gdb) print
$3 = {x = 1, y =
(cuda-gdb) print
$4 = {x = 256, y
gridDim
1}
blockDim
= 1, z = 1)
9 Since thread (0,0,0) reverses the value of 0, switch to a different thread to show more interesting data: cuda-gdb) cuda thread 170
[Switching to CUDA Kernel 0 (device 0, sm 0, warp 5, lane 10, grid 1, block
(0,0), thread (170,0,0))]
10 Advance kernel execution and verify some data: (cuda-gdb) n
12
array[threadIdx.x]
(cuda-gdb) n
14
array[threadIdx.x]
(cuda-gdb) n
16
array[threadIdx.x]
(cuda-gdb) n
18
array[threadIdx.x]
(cuda-gdb) n
= idata[threadIdx.x];
= ((0xf0f0f0f0 & array[threadIdx.x]) >> 4) |
= ((0xcccccccc & array[threadIdx.x]) >> 2) |
= ((0xaaaaaaaa & array[threadIdx.x]) >> 1) |
Breakpoint 3, bitreverse <<<(1,1),(256,1,1)>>> (data=0x100000) at
bitreverse.cu:21
21
idata[threadIdx.x] = array[threadIdx.x];
(cuda-gdb) p array[0]@12
$7 = {0, 128, 64, 192, 32, 160, 96, 224, 16, 144, 80, 208}
CUDA-GDB (NVIDIA CUDA Debugger)
DU-05227-001_V3.2 | 22
Chapter 04 : CUDA- GDB WALK- THROUGH
(cuda-gdb) p/x array[0]@12
$8 = {0x0, 0x80, 0x40, 0xc0, 0x20, 0xa0, 0x60, 0xe0, 0x10, 0x90, 0x50,
0xd0}
(cuda-gdb) p &data
$9 = (@global void * @parameter *) 0x10
(cuda-gdb) p *(@global void * @parameter *) 0x10
$10 = (@global void * @parameter) 0x100000
11 Delete the breakpoints and continue the program to completion:
(cuda-gdb) delete b
Delete all breakpoints? (y or n) y
(cuda-gdb) continue
Continuing.
Program exited normally.
(cuda-gdb)
This concludes the cuda‐gdb walkthrough.
CUDA-GDB (NVIDIA CUDA Debugger)
DU-05227-001_V3.2 | 23
APPENDIX A SUPPORTED PLATFORMS
The general platform and GPU requirements for running NVIDIA cuda‐gdb are described in this section.
Host Platform Requirements
NVIDIA supports cuda‐gdb on the 32‐bit and 64‐bit Linux distributions listed below:
Red Hat Enterprise Linux 4.8 & 5.5 Fedora 13
Novell SLED 11SP1
openSUSE 11.1
Ubuntu 10.04
GPU Requirements
Debugging is supported on all CUDA‐capable GPUs with a compute capability of 1.1 or later. Compute capability is a device attribute that a CUDA application can query about; for more information, see the latest NVIDIA CUDA Programming Guide on the NVIDIA CUDA Zone Web site: http://www.nvidia.com/object/cuda_home.html#.
These GPUs have a compute capability of 1.0 and are not supported:
GeForce 8800 GTS
GeForce 8800 GTX
GeForce 8800 Ultra
Quadro Plex 1000 Model IV
Quadro Plex 2100 Model S4
CUDA-GDB (NVIDIA CUDA Debugger)
Quadro FX 4600
Quadro FX 5600
Tesla C870
Tesla D870
Tesla S870
DU-05227-001_V3.2 | 24
APPENDIX B KNOWN ISSUES
The following are known issues with the current release.
X11 cannot be running on the GPU that is used for debugging because the debugger effectively makes the GPU look hung to the X server, resulting in a deadlock or crash. Two possible debugging setups exist:
• remotely accessing a single GPU (using VNC, ssh, etc.)
• using two GPUs, where X11 is running on only one Note: The CUDA driver automatically excludes the device used by X11
from being picked by the application being debugged. This can change
the behavior of the application.
The debugger enforces blocking kernel launches.
Device memory allocated via cudaMalloc() is not visible outside of the kernel function.
Not all illegal program behavior can be caught in the debugger.
On GPUs with sm_type less than sm_20 it is not possible to step over a subroutine in the device code.
Device allocations larger than 100 MB on Tesla GPUs, and larger than 32 MB on Fermi GPUs, may not be accessible in the debugger.
Breakpoints in divergent code may not behave as expected.
Debugging applications using textures is not supported on GPUs with sm_type less than sm_20. cuda‐gdb may output the following error message when setting breakpoints in kernels using textures:
“Cannot access memory at address 0x0”. CUDA-GDB (NVIDIA CUDA Debugger)
DU-05227-001_V3.2 | 25
Appendix B : K NOWN I SSUES
Debugging multiple contexts in a GPU
Debugging applications with multiple CUDA contexts running on the same GPU is not supported on any GPU.
Debugging device functions
On GPUs with sm_20, if you are debugging code in device functions that get called by multiple kernels, then setting a breakpoint in the device function will insert the breakpoint in only one of the kernels. If CUDA environment variable CUDA_VISIBLE_DEVICES <index> is used to target a particular GPU, then make sure X server is not running on any of the GPUs. If X is running then reduce the <index> count by one more since the GPU running X is not visible to the application when running under the debugger.
CUDA-GDB (NVIDIA CUDA Debugger)
DU-05227-001_V3.2 | 26
Notice
ALL NVIDIA DESIGN SPECIFICATIONS, REFERENCE BOARDS, FILES, DRAWINGS, DIAGNOSTICS, LISTS, AND
OTHER DOCUMENTS (TOGETHER AND SEPARATELY, "MATERIALS") ARE BEING PROVIDED "AS IS." NVIDIA MAKES
NO WARRANTIES, EXPRESSED, IMPLIED, STATUTORY, OR OTHERWISE WITH RESPECT TO THE MATERIALS, AND
EXPRESSLY DISCLAIMS ALL IMPLIED WARRANTIES OF NONINFRINGEMENT, MERCHANTABILITY, AND FITNESS
FOR A PARTICULAR PURPOSE.
Information furnished is believed to be accurate and reliable. However, NVIDIA Corporation assumes no
responsibility for the consequences of use of such information or for any infringement of patents or other
rights of third parties that may result from its use. No license is granted by implication of otherwise under
any patent rights of NVIDIA Corporation. Specifications mentioned in this publication are subject to change
without notice. This publication supersedes and replaces all other information previously supplied. NVIDIA
Corporation products are not authorized as critical components in life support devices or systems without
express written approval of NVIDIA Corporation.
Trademarks
NVIDIA, the NVIDIA logo, NVIDIA nForce, GeForce, NVIDIA Quadro, NVDVD, NVIDIA Personal Cinema, NVIDIA
Soundstorm, Vanta, TNT2, TNT, RIVA, RIVA TNT, VOODOO, VOODOO GRAPHICS, WAVEBAY, Accuview
Antialiasing, Detonator, Digital Vibrance Control, ForceWare, NVRotate, NVSensor, NVSync, PowerMizer,
Quincunx Antialiasing, Sceneshare, See What You've Been Missing, StreamThru, SuperStability, T-BUFFER,
The Way It's Meant to be Played Logo, TwinBank, TwinView and the Video & Nth Superscript Design Logo are
registered trademarks or trademarks of NVIDIA Corporation in the United States and/or other countries.
Other company and product names may be trademarks or registered trademarks of the respective owners
with which they are associated.
Copyright
© 2007–2010 NVIDIA Corporation. All rights reserved.
www.nvidia.com