1
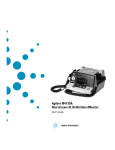
Chapter 5: GPA Fundamentals
Figure 5.7:
Baseline
exams
FORUM Glaucoma Workplace
Elements of the VFI Plot
Follow-Up
exams
Solid blue line indicating
the calculated progression
Progression rate and
confidence level
The selected
Follow-Up exam
Gray-shaded bands show statistical
significance, defining the confidence
range for the progression analysis
5-year
projection
VFI Bar
The VFI plot is dynamic and interactive. You can use it to set a new baseline,
to deselect exams so that they are not counted in the GPA analysis, and to
perform other tasks. You can also hide various indicators to simplify the
display. For details, see "Chapter 6: Working with the GPA Tools" on
page 111.
If you are working with MD instead of VFI, all the procedures described in this
chapter are equally available to you.
Page 88
Version 2.4
G-30-1911-us