1
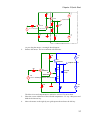
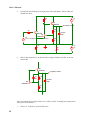
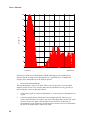
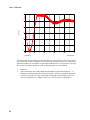
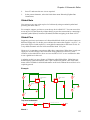
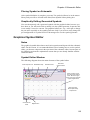
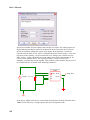
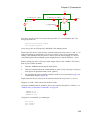
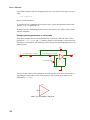
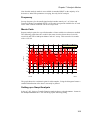
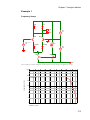
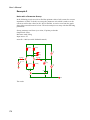
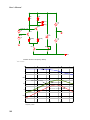
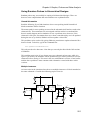
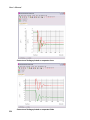
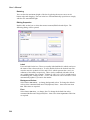
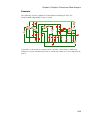
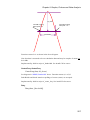
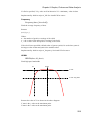
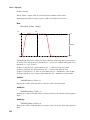
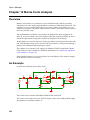
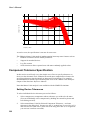
User’s Manual
able to move the file. This will make it impossible to resume the simulation (if paused)
or restart the simulation (transient only).
Note that if you specify a location on a different volume as the original data, then the
file’s data has to be copied and for large data files, this will take a long time.
Make new copy
This makes a fresh copy of the data. This option does not suffer from the drawbacks of
moving the file but if the data file is large can take a very long time.
Restoring SImulation Data
Select menu File|Data|Load.... Navigate to a directory where you have previously
saved data files.
You can also reload data from temporary files using menu File|Data|Load Temporary
Data.... Whether or not there will be any files available to opened depends on the
temporary data file delete options. See “Graph/Probe/Data Analysis” on page 310 for
information about these options.
The error “The process cannot access the file because it is being used by another
process” means that the temporary data file is still in use. Unless the file is in use by
another instance of SIMetrix you will be able to use its data by selecting its associated
group. Use menu Graphs and Data Analysis|Change Data Group....
Performance Analysis and Histograms
Overview
When running multi-step analyses which generate multiple curves, it is often useful to
be able to plot some characteristic of each curve against the stepped value. For
example, suppose you wished to investigate the load response of a power supply
circuit and wanted to plot the fall in output voltage vs transient current load. To do this
you would set up a transient analysis to repeat a number of times with a varying load
current. (See “Multi-step Analyses” on page 184 to learn how to do this). After the run
is complete you can plot a complete set of curves, take cursor measurements and
manually produce a plot of voltage drop vs. load current. This is of course is quite a
time consuming and error prone activity.
Fortunately, SIMetrix has a means of automating this procedure. A range of functions sometimes known as goal functions - are available that perform a computation on a
complete curve to create a single value. By applying one or a combination of these
functions on the results of a multi-step analysis, a curve of the goal function versus the
stepped variable may be created.
This feature is especially useful for Monte Carlo analysis in which case you would
most likely wish to plot a histogram.
We start with an example and in fact it is a power supply whose load response we wish
to investigate.
248