1
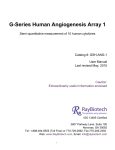
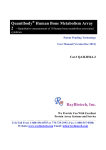
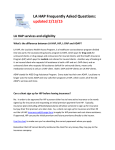
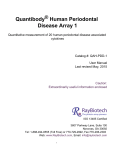
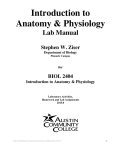
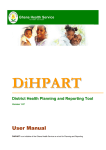
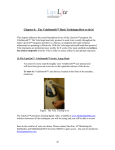
Quantibody Porcine Cytokine Array 3 --Quantitative measurement of 10 porcine cytokines Patent Pending Technology User Manual (Version Sept 2014) Cat # QAP-CYT-3 RayBiotech, Inc. We Provide You With Excellent Protein Array Systems and Service Tel:(Toll Free) 1-888-494-8555 or 770-729-2992; Fax: 1-888-547-0580; Website:www.raybiotech.com Email: [email protected] Cytokine Detected (10) Decorin, GASP-1, IGFBP-5, IL-15, IL-22, Insulin, IP10, MCP-1, NCAM-1, TWEAK R Format One standard glass slide is spotted with 16 wells of identical cytokine antibody arrays. Each antibody is arrayed in quadruplicate. Detection Method Fluorescence with laser scanner: Cy3 equivalent dye Sample Volume 50 – 100 l per array Reproducibility CV <20% Assay duration 6 hrs See Section V For Array Map Fluor dye (cy3 equivalent) B Biotin-Streptavidin complex Detect antibody Cytokine Capture antibody Glass Slide Support Quantibody Porcine Cytokine Array 3 1 TABLE OF CONTENTS Overview……………………………………….…. 1 Introduction….......................................................... 3 How It Works ……………………………………... 5 Materials Provided…………………………..…….. 6 Additional Materials Required………………..…… 6 General Considerations…………………….……… 7 A. Preparation of Samples…………………….…… 7 B. Handling Glass Chips…………………….…….. 7 C. Incubation………………………………….…… 7 IV. Protocol………………………………………….… 8 A. Complete Air Dry the Glass Chip……………… 8 B. Prepare Cytokine Standard Dilutions………….. 8 C. Blocking and Incubation………………………. 9 D. Incubation with Detection Antibody Cocktail...… 10 I. II. III. E. Incubation with Cy3 Equivalent Dye-Streptavidin … 10 F. Fluorescence Detection…………………………… 11 G. Data Analysis…………………………………….. 12 Cytokine Array Map & Standard Curves... ………… 13 VI. 8-Point Standards …………………………………... 14 V. VII. System Specificity …….……………………………... 15 VIII. Quantibody® Q-Analyzer ………………………..….. 16 IX. Troubleshooting Guide…………………………….... 17 X. Select Quantibody® Publications …………………… 18 XI. Experimental Record Form…………………………. 19 XII. How to Choose Quantibody® Products …………….. 20 Quantibody Porcine Cytokine Array 3 2 I. Introduction Cytokines play an important role in immunity, apoptosis, angiogenesis, cell growth and differentiation. They are involved in interactions between different cell types, cellular responses to environmental conditions, and maintenance of homeostasis. In addition, cytokines are also involved in most disease processes, including cancer and cardiac diseases. The traditional method for cytokine detection and quantification is through the use of an enzyme-linked immunosorbent array (ELISA). In this method, target protein is first immobilized to a solid support. The immobilized protein is then recognized with an antibody that is linked to a protein conjugate or enzyme. Detection of the enzyme-complex can then be visualized through the use of a substrate that produces a detectable signal. While the traditional method works well for a single protein, the overall procedure is time consuming and requires a lot of sample. With little sample to work with, conservation of precious small quantities becomes a risky task. With the advancements in microarray technology over the last decade, more and more choices are available to scientists today. A long-standing leader in the field, RayBiotech, has pioneered the development of cytokine antibody arrays, which have now been widely applied in the research community with hundreds of peer reviewed publications including JEM, Cell, and Nature. Quantibody® arrays, our quantitative array platform, uses multiplexed sandwich ELISA-based technology, and enables researchers to accurately determine the concentration of multiple cytokines simultaneously. It combines the advantages of the high detection sensitivity and specificity of ELISA and the high throughput of multiplex arrays. Like a traditional sandwich-based ELISA, it uses a pair of cytokine specific antibodies for detection. A capture antibody is first bound to the glass surface. After incubation with the sample, the target cytokine is trapped on the solid surface. A second biotin-labeled detection antibody is then added, which can recognize a different epitope of the target cytokine. The cytokine-antibodybiotin complex can then be visualized through the addition of the streptavidin-labeled Cy3 equivalent dye using a laser scanner. Unlike the traditional ELISA, Quantibody products use array format, which array Quantibody Porcine Cytokine Array 3 3 multiple cytokine specific capture antibodies onto a glass support allowing simultaneous detection of cytokines in one experiment. In detail, one standard glass slide is spotted with 16 wells of identical cytokine antibody arrays. Each antibody, together with the positive controls is arrayed in quadruplicate. The slide comes with a 16-well removable gasket which allows for the process of 16 samples in one slide. Four slide chips can be nested into a tray, which matches a standard microplate and allows for automated robotic high throughput process of 64 arrays simultaneously. For cytokine quantification, the array specific cytokine standards, whose concentration has been predetermined, are provided to generate a standard curve for each cytokine. In a real experiment, standard cytokines and samples will be assayed in each array simultaneously through a sandwich ELISA procedure. By comparing signals from unknown samples to the standard curve, the cytokine concentration in the samples will be determined. Quantibody® array kits have been confirmed to have similar detection sensitivity as traditional ELISA. Our current high density Quantibody kits allow scientists to quantitatively determine the concentration of 400 human or 200 mouse cytokines in a single experiment. This is not only one of the largest and most efficient arrays on the market for cytokine quantification, but makes it more affordable for quantification of large number of proteins. Simultaneous detection of multiple cytokines undoubtedly provides a powerful tool for drug and biomarker discovery. Quantibody Porcine Cytokine Array 3 4 How It Works Array support Samples Incubation of Sample With arrayed antibody Supports 1-2 hr Cocktail of Biotin-Ab Incubation with Biotinylated Ab Labeled – streptavidin Incubation with Cy3 equivalent dye Labeled- streptavidin Detection of signals Data analysis and graph Quantibody Porcine Cytokine Array 3 5 1-2 hr 1 hr II. Materials Provided Upon receipt, all components of the Quantibody Array kit should be stored at -200C. At -200C the kit will retain complete activity for up to 6 months. Once thawed, the glass chip, cytokine standard mix, detection antibody cocktail and Cy3 equivalent dye-conjugated Streptavidin should be kept at – 200C and all other components may be stored at 40C. The entire kit should be used within 6 months of purchase. Components Item Description 1 2 3 4 5 6 7 8 9 10 Quantibody Array Glass Chip Sample Diluent 20X Wash Buffer I 20X Wash Buffer II Lyophilized cytokine standard mix * Detection antibody cocktail Cy3 equivalent dye-conjugated Streptavidin Slide Washer/Dryer Adhesive device sealer Manual 1-Slide kit 2-Slide kit 1 1 2 1 1 1 1 1 5 1 2 1 3 1 1 2 2 1 10 1 * See Section VI for detailed cytokine concentrations after reconstitution. Additional Materials Required Orbital shaker Laser scanner for fluorescence detection Aluminum foil Distilled water 1.5ml Polypropylene microcentrifuge tubes Quantibody Porcine Cytokine Array 3 6 III. General Considerations A. Preparation of Samples Use serum-free conditioned media if possible. If serum-containing conditioned media is required, it is highly recommended that complete medium be used as a control since many types of sera contains cytokines. We recommend the following parameters for your samples: 50 to 100 μl of original or diluted serum, plasma, cell culture media, or other body fluid, or 50-500 μg/ml of protein for cell and tissue lysates. If you experience high background or the readings exceed the detection range, further dilution of your sample is recommended. B. Handling glass chips Do not touch the surface of the slides, as the microarray slides are very sensitive. Hold the slides by the edges only. Handle all buffers and slides with latex free gloves. Handle glass chip in clean environment. Because there is no barcode on the slide, transcribe the slide serial number from the slide bag to the back of the slide with a permanent marker before discarding the slide bag. Once the slide is disassembled, you might not have enough info to distinguish one slide from the other. C. Incubation Completely cover array area with sample or buffer during incubation. Avoid foaming during incubation steps. Perform all incubation and wash steps under gentle rotation. Cover the incubation chamber with adhesive film during incubation, particularly when incubation is more than 2 hours or <70 l of sample or reagent is used. Several incubation steps such as step 6 (blocking), step 7 (sample incubation), step 10 (detection antibody incubation), or step 13 (Cy3 equivalent dye-streptavidin incubation) may be done overnight at 40C. Please make sure to cover the incubation chamber tightly to prevent evaporation. Quantibody Porcine Cytokine Array 3 7 IV. Protocol A. Completely air dry the glass chip 1. Take out the glass chip from the box, and let it equilibrate to room temperature inside the sealed plastic bag for 20-30 minutes. Remove slide from the plastic bag; peel off the cover film, and let it air dry at room temperature for another 1-2 hours. Note: Incomplete drying of slides before use may cause the formation of “comet tails”. B. Prepare Cytokine Standard Dilutions Note: There is only one vial of standard provided in the two-slide kit, which is enough for making two standard curves. Reconstitute the lyophilized standard within one hour of usage. If you must use the standard for two different days, store only the Std1 dilution at -80 0C. Prepare serial dilution of cytokine standards 100l 100l 100l 100l 100l 100l Add 500l Sample Diluent 200l 200l 200l 200l 200l 200l Vial Labels Std1 Std2 Std3 Std4 Std5 Std6 Std7 100l CNTRL 2. Reconstitute the Cytokine Standard Mix (lyophilized) by adding 500l Sample Diluent to the tube. For best recovery, always quick-spin vial prior to opening. Dissolve the powder thoroughly by a gentle mix. Labeled the tube as Std1. Quantibody Porcine Cytokine Array 3 8 3. Label 6 clean microcentrifuge tubes as Std2 to Std7. Add 200l Sample Diluent to each of the tubes. 4. Pipette 100l Std1 into tube Std2 and mix gently. Perform 5 more serial dilutions by adding 100ul Std2 to tube Std3 and so on. 5. Add 100l Sample Diluent to another tube labeled as CNTRL. Do not add standard cytokines or samples to the CNTRL tube, which will be used as negative control. For best results, include a set of standards in each slide. Note: Since the starting concentration of each cytokine is different, the serial concentrations from Std1 to Std7 for each cytokine are varied which can be found in section VI. C. Blocking and Incubation 6. Add 100μl Sample Diluent into each well and incubate at room temperature for 30 min to block slides. 7. Decant buffer from each well. Add 100μl standard cytokines or samples to each well. Incubate arrays at room temperature for 1-2 hour. (Longer incubation time is preferable for higher signals) Note: We recommend using 50 to 100 μl of original or diluted serum, plasma, conditioned media, or other body fluid, or 50-500 μg/ml of protein for cell and tissue lysates. Cover the incubation chamber with adhesive film during incubation if less than 70 ul of sample or reagent is used. Note: This step may be done overnight at 40C for best results. 8. Wash: Decant the samples from each well, and wash 5 times (5 min each) with 150 μl of 1x Wash Buffer I at room temperature with gentle shaking. Completely remove wash buffer in each wash step. Dilute 20x Wash Buffer I with H2O. Quantibody Porcine Cytokine Array 3 9 (Optional for Cell and Tissue Lysates) Put the glass chip with frame into a box with 1x Wash Buffer I (cover the whole glass slide and frame with Wash Buffer I), and wash at room temperature with gentle shaking for 20 min. Decant the 1x Wash Buffer I from each well, wash 2 times (5 min each) with 150 μl of 1x Wash Buffer II at room temperature with gentle shaking. Completely remove wash buffer in each wash step. Dilute 20x Wash Buffer II with H2O. Note: Incomplete removal of the wash buffer in each wash step may cause “dark spots”. (Background signal is higher than that of the spot.) D. Incubation with detection antibody cocktail and wash. 9. Reconstitute the detection antibody by adding 1.4 ml of Sample Diluent to the tube. Spin briefly. 10. Add 80 μl of the detection antibody cocktail to each well. Incubate at room temperature for 1-2 hour. (Longer incubation time is preferable for higher signals and backgrounds) 11. Decant the samples from each well, and wash 5 times with 150 μl of 1x Wash Buffer I and then 2 times with 150 μl of 1x Wash Buffer II at room temperature with gentle shaking. Completely remove wash buffer in each wash step. E. Incubation with Cy3 equivalent dye -Streptavidin and wash 12. After briefly spinning down, add 1.4 ml of Sample Diluent to Cy3 equivalent dye-conjugated streptavidin tube. Mix gently. 13. Add 80 μl of Cy3 equivalent dye-conjugated streptavidin to each well. Cover the device with aluminum foil to avoid exposure to light or incubate in dark room. Incubate at room temperature for 1 hour. Quantibody Porcine Cytokine Array 3 10 14. Decant the samples from each well, and wash 5 times with 150 μl of 1x Wash Buffer I at room temperature with gentle shaking. Completely remove wash buffer in each wash step. F. Fluorescence Detection 15. Disassemble the device by pushing clips outward from the slide side. Carefully remove the slide from the gasket. (Be careful not to touch the surface of the array side) 16. Place the slide in the slide Washer/Dryer (a 4-slide holder/centrifuge tube), add enough 1x Wash Buffer I (about 30 ml) to cover the whole slide, and then gently shake at room temperature for 15 minutes. Decant Wash Buffer I. Wash with 1x Wash Buffer II (about 30 ml) with gentle, and gently shake at room temperature for 5 minutes. 17. Remove water droplets completely by one of the following ways: Put the glass chip into the Slide Washer/Dryer, and dry the glass chip by centrifuge at 1,000 rpm for 3 minutes without cap. Or, dry the glass chip by a compressed N2 stream. Or gently apply suction with a pipette to remove water droplets. Do not touch the array, only the sides. 18. Imaging: The signals can be visualized through use of a laser scanner equipped with a Cy3 wavelength such as Axon GenePix. Make sure that the signal from the well containing the highest standard concentration (Std1) receives the highest possible reading, yet remains unsaturated. Note: In case the signal intensity for different cytokine varies greatly in the same array, we recommend using multiple scans, with a higher PMT for low signal cytokines, and a low PMT for high signal cytokines. Quantibody Porcine Cytokine Array 3 11 G. Data Analysis 19. Data extraction can be done with most of the microarray analysis software (GenePix, ScanArray Express, ArrayVision, or MicroVigene). For quantitative data analysis, our Quantibody® Q-Analyzer software is available. It gives visual output as well as digital values. More information can be found in section VIII. Experiments Image scan (laser scanner) Data extraction (GenePix etc.) 455 433 443 442 121 122 132 119 2 1 3 2 21 22 21 23 222 223 232 213 89 88 90 91 55 54 57 56 188 178 189 190 70000 Data computation (Q Analyzer) Intensity (Signal - BKG) 60000 50000 40000 30000 20000 10000 0 0 100 200 300 400 500 600 700 800 900 Cytokine Concentration (pg/ml) Final Result (pg/ml) Quantibody Porcine Cytokine Array 3 12 Sample Name IL-2 IL-4 IL-5 IL-6 Media control 0.1 0.0 0.2 0.1 Cell culture, 24hr 0.1 0.9 0.0 0.1 Add drug A, 24hr 0.1 2.4 0.4 0.4 1112.7 IL-8 IL-10 IFNg TNFa 0.0 0.1 0.1 0.1 0.3 0.1 435.0 0.2 0.1 349.7 0.1 0.1 0.5 IL-13 GM-CSF 0.0 2399.7 0.1 1.0 Add drug B, 24hr 0.0 1.6 0.1 0.2 576.7 0.2 0.0 493.0 0.1 Add drug A and B, 24hr 0.1 4.6 0.4 0.8 934.9 1.2 0.2 3283.0 0.0 Cell culture, 72hr 0.1 0.5 0.0 0.2 453.7 0.8 0.3 563.8 0.1 0.6 Add drug A, 72hr 0.2 34.3 0.3 2.4 915.7 6.7 0.4 3304.8 0.3 20.8 0.2 Add drug B, 72hr 0.2 1.1 0.1 0.3 454.0 0.7 0.3 721.4 0.1 0.3 Add drug A and B, 72hr 0.1 60.5 0.5 4.1 810.6 8.1 0.7 3665.1 1.0 44.1 2.4 V. Cytokine Array Map & Standard Curves POS1 POS2 Decorin GASP-1 IGFBP-5 IL-15 IL-22 Insulin IP-10 MCP-1 NCAM-1 TWEAK R QAP-CYT-3 Standard Curves 1e+5 Decorin GASP-1 IGFBP-5 IL-15 IL-22 Insulin IP-10 MCP-1 NCAM-1 TWEAK R Signal Intensity 1e+4 1e+3 1e+2 1e+1 1e-1 1e+0 1e+1 1e+2 1e+3 Concentration (pg/ml) Quantibody Porcine Cytokine Array 3 13 1e+4 1e+5 1e+6 VI. 8-Point Standards After reconstitution of the lyophilized cytokine standard mix, the 8-point cytokine concentration used for generating the standard curve of a given antigen is listed below. The detection sensitivity of each protein in one experiment is user dependent. Try our array specific Quantibody Q-Analyzer to see your Limit of Detection (LOD). (Section VIII). Serial standard concentration (pg/ml) (pg/ml) Decorin GASP-1 IGFBP-5 IL-15 IL-22 Insulin IP-10 MCP-1 NCAM-1 TWEAK R Control 0 0 0 0 0 0 0 0 0 0 Std7 5 5 55 55 137 137 55 1 137 137 Std6 16 16 165 165 412 412 165 4 412 412 Std5 49 49 494 494 1,235 1,235 494 12 1,235 1,235 Std4 148 148 1,481 1,481 3,704 3,704 1,481 37 3,704 3,704 Std3 444 444 4,444 4,444 11,111 11,111 4,444 111 11,111 11,111 Std2 1,333 1,333 13,333 13,333 33,333 33,333 13,333 333 33,333 33,333 Std1 4,000 4,000 40,000 40,000 100,000 100,000 40,000 1,000 100,000 100,000 Panel cross-reactivity CAB\DAB Decorin GASP-1 Decorin 58,073 30 GASP-1 11 65,398 IGFBP-5 13 11 IL-15 15 12 IL-22 6 7 Insulin 18 57 IP-10 15 48 MCP-1 16 49 NCAM-1 11 63 TWEAK R 5 13 IGFBP5 23 20 3,283 125 7 105 407 414 26 13 IL-15 128 119 103 13,966 72 178 189 192 163 63 Quantibody Porcine Cytokine Array 3 IL-22 126 99 95 677 5974 152 180 142 128 50 14 Insulin 83 69 81 100 35 52,551 117 100 85 29 IP-10 111 131 33 176 16 128 1,975 56 140 22 MCP-1 121 133 144 218 116 121 283 65,204 155 137 NCAM1 59 60 59 82 134 97 92 77 52,092 30 TWEAK R 15 9 18 23 2 29 45 47 17 6,327 VII. System Recovery The antibody pairs used in the kit have been tested to recognize their specific antigen. Analysis of samples containing only a single recombinant protein found no cross-reactivity with other proteins. The spiking recovery rate of the cytokines by the kit in 2x diluted porcine serum (SR), and conditioned media (CM) is listed in the following table. (pg/ml) Decorin GASP-1 IGFBP-5 IL-15 IL-22 Insulin IP-10 MCP-1 NCAM-1 TWEAK R Spike-in 2,000 2,000 10,000 20,000 50,000 50,000 20,000 500 50,000 50,000 SR 1,254 2,083 1 193 3,218 115 272 114 65,251 1,689 Quantibody Porcine Cytokine Array 3 SR+Ag 3,597 3,673 9,563 8,229 43,010 18,735 7,025 271 111,795 31,906 15 SR% 117% 79% 96% 40% 80% 37% 34% 31% 93% 60% CM 8 2 0 0 85 86 0 0 0 9 CM+Ag 2,880 1,678 14,343 27,794 62,856 60,971 27,244 787 48,171 50,587 CM% 144% 84% 143% 139% 126% 122% 136% 157% 96% 101% VIII. Quantibody® Q-Analyzer Quantibody Q-Analyzer is an array specific, Excel-based program. However, it is not a simple calculation macro as it contains sophisticated data analysis. Key features: Simplicity: Easy to operate and requires no professional training. With a simple copy and paste process, the cytokine concentration is determined. Outlier Marking & Removing: The software can automatically mark and remove the outlier spots for more accurate data analysis Normalization: The program allows for intra- and inter-slide normalization for large number of samples. Two Positive Controls: The program takes the two positive controls in each array for normalization. Two Analytical Algorithms: Users can choose either linear regression or log-log algorithms to meet their analytical needs. Two Data Outputs: standard curves and digital concentration. User Intervention: The program allows for user manual handling of those outliers and other analytical data. Lower and Upper Limits Determination: The program automatically marks out the values below or above the detection range. Standard Deviation: The program outputs the standard deviations of the quadruplicate spots for data accuracy. Analytical Tips: Q-Analyzer analysis tips are included in the program. Quantibody Porcine Cytokine Array 3 16 IX. Troubleshooting guide Problem Cause Recommendation Inadequate detection Inadequate reagent volumes or improper dilution Short incubation time Weak Signal Too low protein concentration in sample Improper storage of kit Uneven signal Bubble formed during incubation Arrays are not completed covered by reagent Reagent evaporation Cross-contamination from neighboring wells Comet tail formation Inadequate standard reconstitution or Improper dilution Poor standard curve Inadequate detection Use freeze-thawed cytokine standards Overexposure Dark spots High background Insufficient wash Dust Slide is allowed to dry out Quantibody Porcine Cytokine Array 3 17 Increase laser power and PMT parameters Check pipettes and ensure correct preparation Ensure sufficient incubation time and change sample incubation step to overnight Don’t make too low dilution or concentrate sample Store kit as suggested temperature. Don’t freeze/thaw the slide. Avoid bubble formation during incubation Completely cover arrays with solution Cover the incubation chamber with adhesive film during incubation Avoid overflowing wash buffer Air dry the slide for at least 1 hour before usage Reconstitute the lyophilized standard well at the room temperature before making serial dilutions. Check pipettes and ensure proper serial dilutions. Increase laser power that the highest standard concentration for each cytokine receives the highest possible reading yet remains unsaturated. Always use new cytokine standard vial for new set of experiment. Discard any leftover. Lower the laser power Completely remove wash buffer in each wash step. Increase wash time and use more wash buffer Work in clean environment Don’t dry out slides during experiment. X. Select Quantibody Publications Quantibody products have been referenced in hundreds of publications. Following are only some of the selections. • • • • • • • • • • • • • • • • • Gao, et al. A Chinese herbal decoction, Danggui Buxue Tang, activates extracellular signal-regulated kinase in cultured T-lymphocytes. FEBS Letters, 2007; 581(26): 50875093. Zhai, et al. Coordinated Changes in mRNA Turnover, Translation, and RNA Processing Bodies in Bronchial Epithelial Cells following Inflammatory Stimulation. Molecular and Cellular Biology. 2008; 28(24): 7414-7426. Toh HC et al: Clinical Benefit of Allogeneic Melanoma Cell Lysate–Pulsed Autologous Dendritic Cell Vaccine in MAGE-Positive Colorectal Cancer Patients. Clin Cancer Res 2009 15:7726-7736 Willingham, SB et al. NLRP3 (NALP3, Cryopyrin) facilitates in vivo caspase-1 activation, necrosis, and HMGB1 release via inflammasome-dependent and independent pathways. J Immunol. 2009; 183(3):2008-15 Gujar SA et al: Reovirus virotherapy overrides tumor antigen presentation evasion and promotes protective antitumor immunity. Mol Cancer Ther. 2010 9(11):2924-33 Rajkumar T et al: Identification and validation of genes involved in gastric tumorigenesis. Cancer Cell Int. 2010 10(1):45 Lewis JA et al: Analysis of Secreted Proteins as an in vitro Model for Discovery of Liver Toxicity Markers. J Proteome Res. 2010; 9(11):5794-802 Montes AH et al: The MMP1 (-16071G/2G) single nucleotide polymorphism associates with the HAART-related lipodystrophic syndrome. AIDS. 2010 24(16):2499-506 Yin JJ et al: Cediranib/AZD2171 Inhibits Bone and Brain Metastasis in a Preclinical Model of Advanced Prostate Cancer. Cancer Res. 2010 70(21):8662-73 Storti, P et al: HOXB7 expression by myeloma cells regulates their pro-angiogenic properties in multiple myeloma patients. Leukemia, 2011 Mar;25(3):527-37 Shinmura D et al: Pretreatment of Human Mesenchymal Stem Cells with Pioglitazone Improved Efficiency of Cardiomyogenic Transdifferentiation and Improved Cardiac Function. Stem Cells. 2011 Feb;29(2):357-66. Feng W. et al: A novel role for platelet secretion in angiogenesis: mediating bone marrow-derived cell mobilization and homing. Blood. 2011 Mar 2. Fleming J. et al: Probiotic helminth administration in relapsing-remitting multiple sclerosis: a phase 1 study. Mult Scler. 2011 Mar 3. Morelli T et al: Angiogenic biomarkers and healing of living cellular constructs. J Dent Res. 2011 Apr;90(4):456-62. Christoph E. et al: Levels of VEGF but not VEGF165b are Increased in the Vitreous of Patients With Retinal Vein Occlusion. Am J of Ophthalmology 2011. May 28 Lee A et al: Bacterial and Salivary Biomarkers Predict the Gingival Inflammatory Profile. J Periodontol. 2011 May 12. Scanlon ST, et al: Airborne lipid antigens mobilize resident intravascular NKT cells to induce allergic airway inflammation. J Exp Med. 2011 Sep 19. Quantibody Porcine Cytokine Array 3 18 XI. Experiment Record Form Date: ___________________________ File Name: _______________________ Laser Power: ______________________ PMT: ____________________________ Well No. Sample Name 1 CNTRL 2 Std7 3 Std6 4 Std5 5 Std4 6 Std3 7 Std2 8 Std1 Dilution factor 9 10 11 12 13 14 15 16 Quantibody Porcine Cytokine Array 3 19 1 2 3 4 5 6 7 8 XII. How to Choose Quantibody® Products? Species-based selection: • • • • • • • • Human: (QAH-) Mouse: (QAM-) Rat: QAR-CYT-1, QAR-CYT-2, QAR-CYT-3, QAR-CYT-4, QAR-INF-1 Porcine: QAP-CYT-1, QAP-CYT-2, QAP-CYT-3, QAP-CYT-4 Non-Human Primates (NHP): QAN-CYT-1 Canine: QAC-CYT-1, QAC-CYT-2 Feline: QAF-CYT-1 Bovine: QAB-CYT-1, QAB-CYT-2 Function-based selection: • • • • • • TH1/TH2/TH17 Array: QAH-TH-1, QAH-TH17, QAM-TH17 Inflammation Arrays: QAH-INF-1, QAH-INF-2, QAH-INF-3; QAM-INF-1; QAR-INF-1 Angiogenesis Arrays: QAH-ANG-1, QAH-ANG-2, QAH-ANG-3, QAH-ANG-1000 Chemokine Arrays: QAH-CHE-1, QAM-CHE-1 MMP Array: QAH-MMP-1 Immunoglobulin Isotype Array: QAH-ISO-1; QAM-ISO-G1 Cytokine Number-based selection: • • • • • • • • • • • • • • • 400 cytokines: QAH-CAA-9000 360 cytokines: QAH-CAA-8000 320 cytokines: QAH-CAA-7000 280 cytokines: QAH-CAA-6000 240 cytokines: QAH-CAA-5000 200 cytokines: QAH-CAA-4000 160 cytokines: QAH-CAA-3000, QAM-CAA-3000 120 cytokines: QAH-CAA-2000; QAM-CAA-2000 80 cytokines: QAH-CAA-1000; QAM-CAA-1000 60 cytokines: QAH-ANG-1000; QAM-CYT-Q2000 40 cytokines: QAH-INF-3, QAH-CHE-1, QAH-GF-1, QAH-REC-1, QAH-CYT-4, QAHCYT-5, QAH-CYT-6, QAH-CYT-7, QAM-INF-1, QAM-CYT-4, QAM-CYT-5, QAM-CYT-6 30 cytokines: QAH-ANG-2, QAH-ANG-3, QAM-INT-1000, QAR-CYT-3, QAM-CHE-1 20 cytokines: QAH-CYT-1, QAH-CYT-2, QAM-CYT-1, QAM-CYT-2, QAM-CYT-3, QAMINT-1, QAH-TH17-1, QAM-TH17-1 10 cytokines: QAH-TH-1, QAH-INF-1, QAH-INF-2, QAH-ANG-1, QAH-MMP-1, QAHADI-1, QAM-INT-2, QAR-CYT-1, QAR-CYT-2, QAR-INF-1, QAN-CYT-1, QAP-CYT-1, QAH-IGF-1 less than 10 cytokines: QAH-ISO-1, QAH-ADI-2, QAP-CYT-1, QAM-ISO-G1 Purpose-based selection --- Custom Arrays • • • Choose from over 1000 cytokine pool; Any kind; Any number Order slide only or full service in house Desired marker not in our pool? No problem! For certain developmental fee, we may be able to add the marker to your panel if the paired antibodies are available on the market. Quantibody Porcine Cytokine Array 3 20 Note: Quantibody® is the trademark of RayBiotech, Inc. Cytokine protein arrays are RayBiotech patent-pending technology. This product is intended for research only and is not to be used for clinical diagnosis. Our produces may not be resold, modified for resale, or used to manufacture commercial products without written approval by RayBiotech, Inc. Under no circumstances shall RayBiotech be liable for any damages arising out of the use of the materials. Products are guaranteed for three months from the date of purchase when handled and stored properly. In the event of any defect in quality or merchantability, RayBiotech’s liability to buyer for any claim relating to products shall be limited to replacement or refund of the purchase price. This product is for research use only. ©2014 RayBiotech, Inc. Quantibody Porcine Cytokine Array 3 21