1
APPENDIX C:
PROGRAMMER’S MANUAL
RSAP
Version 3.0.0
NCHRP
22-27
ROADSIDE SAFETY ANALYSIS
PROGRAM (RSAP) UPDATE
RoadSafe LLC
12 Main Street
Canton, Maine 04221
October 25, 2012
TABLE OF CONTENTS
List of Figures ..................................................................................................................... 3
List of Tables ...................................................................................................................... 4
Introduction ......................................................................................................................... 5
Background ......................................................................................................................... 5
Overview ............................................................................................................................. 5
Architechture....................................................................................................................... 7
Background ..................................................................................................................... 7
RSAP Components ......................................................................................................... 8
Conventions .................................................................................................................... 9
Program Initiation ......................................................................................................... 10
Project Input and Control .................................................................................................. 11
RSAP Controls Dialog box ........................................................................................... 11
Project information worksheet ...................................................................................... 14
Traffic Information Worksheet ..................................................................................... 18
Road Segments worksheet ............................................................................................ 21
Alternatives worksheet.................................................................................................. 26
Cross-Section Worksheet .............................................................................................. 30
moduleXsection ............................................................................................................ 36
Analyze ......................................................................................................................... 36
Results Worksheet ........................................................................................................ 38
Settings.......................................................................................................................... 43
Hazards Worksheet ....................................................................................................... 45
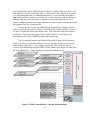
Encroachment Module ...................................................................................................... 50
Procedure ...................................................................................................................... 50
Crash Prediction Module .................................................................................................. 59
Introduction ................................................................................................................... 59
Module POCmain ......................................................................................................... 60
ModulePOChaz ............................................................................................................. 87
ModulePOCtraj ............................................................................................................. 93
ModulePOCanalysis ................................................................................................... 105
Severity Module .............................................................................................................. 145
Benefit-Cost Module ....................................................................................................... 146
Procedure .................................................................................................................... 146
C-1
Development and Maintenance Tools ............................................................................ 149
Conclusions ..................................................................................................................... 152
References ....................................................................................................................... 153
C-2
LIST OF FIGURES
Figure 1. Initial RSAPv3 Application Display. ............................................................... 11
Figure 2. RSAP Controls Dialog -- tab and button bindings. .......................................... 12
Figure 3. Project Information Worksheet. ....................................................................... 15
Figure 4. RSAP Controls Dialog -- Project Information. ................................................ 16
Figure 5. Traffic Information Worksheet......................................................................... 19
Figure 6. RSAP Controls Dialog -- Traffic Information.................................................. 20
Figure 7. Road Segments Worksheet – Whole Roadway Characteristics Input Area. .... 22
Figure 8. Road Segments Worksheet – User Entered Characteristics Input Area. .......... 22
Figure 9. RSAP Controls Dialog – Highway. .................................................................. 24
Figure 10. Alternatives Worksheet. ................................................................................. 26
Figure 11. RSAP Controls Dialog -- Alternatives. .......................................................... 28
Figure 12. Cross-Section Worksheet. .............................................................................. 30
Figure 13. RSAP Controls Dialog – Cross-Section. ........................................................ 32
Figure 14. RSAP Controls Dialog – Analyze (Condensed View). .................................. 37
Figure 15. Results Worksheet – Feature Report View. ................................................... 39
Figure 16. Results Worksheet – Segment Report View. ................................................. 40
Figure 17. Results Worksheet – Benefit-Cost Report View. ........................................... 40
Figure 18. RSAP Controls Dialog -- Results. .................................................................. 42
Figure 19. RSAP Controls Dialog -- Settings. ................................................................. 44
Figure 20. Seveity Worksheet. ......................................................................................... 46
Figure 21. RSAP Controls Dialog -- Hazards.................................................................. 47
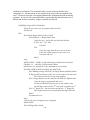
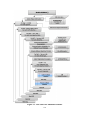
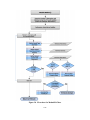
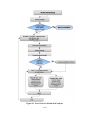
Figure 22. Flow Chart for ModulePOCMaine. ................................................................ 61
Figure 23. RSAP Controls Dialog – Analyze (Expanded View Showing Settings)........ 69
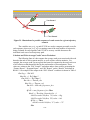
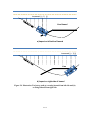
Figure 24. Illustration of encroachment locations for a divided roadway. ...................... 70
Figure 25. Illustration of encroachment locations for an undivided roadway. ................ 71
Figure 26. Illustration of encroachment locations for a one-way roadway. .................... 71
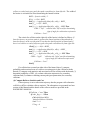
Figure 27. Illustration of transforming the median cross-section coordinates from the
global reference frame to the local reference frame. ................................ 74
Figure 28. Illustration of “apparent” sign of roadside slope relative to encroachment path
of vehicle. .................................................................................................. 78
Figure 29. Illustration of a possible sequence of crash events for a given trajectory
scenario ..................................................................................................... 83
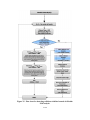
Figure 30. Flow chart for ModulePOChaz. ..................................................................... 88
Figure 31. Sketch of line-hazard dimensions. .................................................................. 91
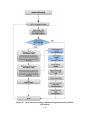
Figure 32. Flow chart for Module POCtraj. ..................................................................... 94
Figure 33. RSAPv3 Controls Dialog -- Default Analysis Settings. .............................. 101
Figure 34. Flow Chart for Module POCanalysis. .......................................................... 107
Figure 35. Flow chart for detecting collisions with line hazards in Module POCanalysis.
................................................................................................................. 108
Figure 36. Flow chart for detecting collisions with point hazards in Module
POCanalysis. ........................................................................................... 109
Figure 37. Illustration of roadway segment showing definition of x0. ........................... 111
Figure 38. Illustration. Trajectory path (a) crossing hazard from left side and (b) crossing
hazard from right side. ............................................................................ 115
C-3
Figure 39. Illustration. Defining the effective radius, R, of a "Point" hazard. .............. 120
Figure 40. Illustration. Trajectory path crossing a point hazard. ................................... 121
Figure 41. Probability model for trucks rolling over longitudinal barriers.................... 128
Figure 42. Flow chart for subroutine subrolloverM2a. .................................................. 139
Figure 43. Flow chart for subroutine subRolloverM2b. ................................................ 142
Figure 44. Illustration of trajectory path intersecting two hazards. ................................ 144
LIST OF TABLES
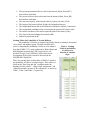
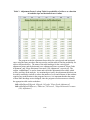
Table 1. Lookup Table for probability of rollover as a function of roadside slope. ........ 66
Table 2. Adjustment Factor Lookup Table for probability of rollover as a function of
roadside slope and vertical grade. ............................................................. 67
Table 3. Adjustment Factor Lookup Table for probability of rollover as a function of
roadside slope and horizontal curve radius. .............................................. 68
Table 4. Example Output to POC Scratch worksheet ....................................................... 86
C-4
INTRODUCTION
This Manual is one of three reports which accompany this software, including a
USER’S MANUAL and an ENGINEER’S MANUAL. This manual, the
PROGRAMMER’S MANUAL, is intended for those that are maintaining or modifying
the actual computer code for RSAPv3. Most typical changes and updates to RSAP can
be accomplished using the many lookup tables and do not require any changes to the
actual code. Instructions for making changes to the lookup tables are described in the
ENGINEER’S MANUAL. When updating the program, the first and preferable choice is
to try and make the change using the lookup tables and to change the underlying code
only when absolutely necessary. This manual documents the program architecture, the
data table specifications and the pseudo-code and provides the necessary background
needed to understand the program structure.
The USER’S MANUAL is a reference for program users of all experience levels
focusing on how to use the software and access its features. It includes several example
problems that illustrate how data should be set up and entered and provides results that
can be used to check a user’s first runs. The ENGINEER’S MANUAL contains
extensive explanations of the analysis methods, the supporting research and data used by
the software, background information, explanation of existing software and literature and
the potential implementation of this software. The ENGINEER’S MANUAL also
contains instructions on how to maintain, modify and update the many lookup tables
within RSAP so that the results of new research can be easily incorporated into the
program.
BACKGROUND
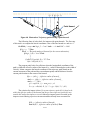
RSAPv3 uses a conditional encroachment-collision-severity approach to
determine the frequency, severity and societal cost of roadside crashes for each userentered design alternative. These crash costs are then compared to the agency costs (i.e.,
construction and/or maintenance, etc.) of the proposed alternatives. An alternative
which results in a reduction in crash costs greater than the agency costs of the
improvement is considered a feasible project. The alternative with the highest benefit
(i.e., reduction in crash costs) to agency costs ratio is the “best” alternative. An RSAPv3
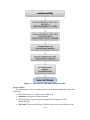
analysis is composed of four major steps for assessing each alternative and is, therefore,
structured into four modules:
Encroachment Probability Module,
Crash Prediction Module,
Severity Prediction Module, and
Benefit/Cost Analysis Module.
Each of these four modules are implemented as a code module in RSAPv3. Each
code module will be discussed in the chapters and sections below.
OVERVIEW
The analysis technique used by RSAPv3 is based on a series of conditional
probabilities. First, RSAPv3 predicts the number of encroachments that can be expected
C-5
on a given road segment as a function of the traffic and geometric characteristics of the
roadway. Given an encroachment has occurred, the crash prediction module then
assesses if the encroachment is likely to result in a crash, P(Cr|Encr). If a crash is
predicted, the severity prediction module estimates the severity of the crash, P(Sev|Cr).
The severity estimates of each crash are then calculated and transformed into units of
dollars in order to compare the reduction in societal crash costs (i.e., benefits) to the
direct cost of implementing the alternative (i.e., costs). The following conditional
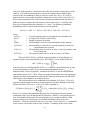
probability model is used for each alternative on each segment:
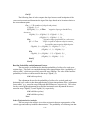
E(CC)N,M = ADT · LN · P(Encr) ∙P(Cr|Encr) ∙ P(Sev|Cr) ∙ E(CCs|Sevs)
where:
E(CC)N,M
AADT
LN
P(Encr)
P(Cr|Encr)
P(Sevs|Cr)
E(CCs|Sevs)
=
=
=
=
=
Expected annual crash cost on segment N for alternative M,
Average Daily Traffic in vehicles/day,
Length of segment N in miles,
The probability a vehicle will encroachment on the segment,
The probability a crash will occur on the segment given that an
encroachment has occurred,
= The probability that an crash of severity s occurs given that a crash
has occurred and
= The expected crash cost of a crash of severity s in dollars.
The term ADT·L·P(Encr) yields the expected number of encroachments on a
segment in units of encroachments/mi/year. ADT·P(Encr) can be further defined as:
∙
∙
where the terms are as defined before and fbase encr is the base encroachment rate in units
of encroachments/mi/yr and EAFi are encroachment adjustment factors. fbase encr is
tabulated on the “Encr Freq and Adj” worksheet in RSAPv3 as are the encroachment
modification factors, EAFi. These values are simple lookup tables where the appropriate
adjustment or base encroachment is read from the tables given the geometric and traffic
characteristics of the highway provided by the user.
The collision and severity conditional encroachments, P(Cr|Encr) ∙ P(Sevs|Cr),
must be grouped together because each encroachment could have multiple events with
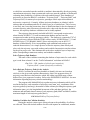
different severities. P(Cr|Encr) ∙ P(Sevs|Cr) can be expanded to:
|
|
1
∩
|
|
∩
Where
∩
is the probability that trajectory k will intersect hazard j and the
summation is done over all hazards and all trajectories. RSAPv3 will typically process
tens of thousands of trajectories for each segment to arrive at this summation. Each
trajectory analyzed is compared to every hazard identified by the user for each
alternative. Lastly the expected crash cost of a severity s crash, E(CCs|Sevs), is multiplied
by the result to convert the result to units of dollars. Combining all the terms yields:
C-6
,
∙
1
∩
∩
|
While the encroachment method is conceptually straight forward, estimating the
three conditional probabilities at the heart of the method can be difficult and
computationally demanding since tens of thousands of possible encroachments must be
evaluated. Each of these conditional probabilities are based either on observed
encroachment and crash data. Since the computations can be complicated, a computer
program like RSAPv3 is the most convenient way to implement the encroachment-based
approach in roadside safety analysis.
Each of these condition probabilities is implemented within RSAPv3 as a module.
The results of the analysis (i.e., E(CC)N,M) are used in the benefit/cost module to compare
roadside design alternatives. Project specific data is collected from the user through a
series of worksheets within the RSAPv3 user interface. This project specific data is used
in conjunction with models based on research stored in other worksheets to preform
calculations which are coded in RSAPv3.
Unlike earlier versions of RSAP, RSAPv3 does not use a Monte Carlo simulation
method to calculate the probability of a collision given an encroachment. Instead, a
deterministic method is used where a sample of real crash trajectories are compared to the
roadside and used to perform the double summation in the equation above.
Documented below in four main chapters are the encroachment probability
module, crash prediction module, severity prediction module, and the Benefit/Cost
module as implemented in RSAPv3. Each chapter documents the program architechture
and structure for each of the modules. This document mirrors the structure of the
USER’S MANUAL and ENGINEER’S MANUAL to the extent possible. Each manual
takes the same general form and references have been made to other manuals to avoid
duplication across manuals.
ARCHITECHTURE
BACKGROUND
RSAPv3 is written as a series of Visual Basic for Applications (VBA) macros
within Microsoft Excel. The Excel worksheets are used to provide a data entry location
for the users as well as to provide project documentation and results to the user. The
macros provide user control and input forms and perform the numerous analysis tasks in
the background. RSAPv3 was written using VBA 7.0 running under Excel version 14.0
and Microsoft Windows NT 6.01 (i.e., Windows 7 Professional Service Pack 1).
RSAPv3 is backwardly compatible with Excel 12 and has been tested with Windows NT,
XP and 2007.
To access the VBA code, start any macro-enabled RSAP workbook or template.
After the splash screen has disappeared and the RSAP Controls Dialog box has appeared
select any cell in any worksheet and press ALT-F11. This starts the VBA editor which
appears as another window. The RSAPv3 code is password protected so double clicking
the RSAPv3 entry in the “Project” VBA workspace will prompt for a password. Once a
C-7
correct password has been entered, the project components are shown (note: the password
up through RSAP 3.0.0. Beta Relese 120815 is “roadsafe”).
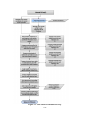
RSAP COMPONENTS
As is typical for VBA projects, there are three types of project components in
RSAPv3 as follows:
Microsoft Excel Objects
Forms
Modules
The Microsoft Excel Objects in RSAPv3 include the following 8 visible and 10
hidden worksheets (note: names in parenthesis are the worksheet names that are
displayed in the workbook whereas the primary name is the internal name of the
worksheet generally used in the code. Whether the worksheet is by default hidden is also
indicated.):
shAlternatives (Alternatives)
shDefaults (Defaults) -- hidden
shEncrAdj (Encr Freq and Adj)
shPOCplots (POC Plots) – hidden
shPOCscratch (POC Scratch) – hidden
shPrgData (Program Data) – hidden
shPrjInfo (Project Info)
shProfile (Profile) – hidden
shRdSegs (Road Segments)
shRedirectionGridC (Redirection Cars) – hidden
shRedirectionGridT (Redirection Trucks) – hidden
shResults (Results)
shSeverity (Severity)
shTraffInfo (Traffic Info)
shXsection (Cross-Section)
TrajectoryGrid1 (TrajectoryGrid1) – hidden
TrajectoryGrid2 (TrajectoryGrid2) – hidden
TrajectoryGrid3 (TrajectoryGrid3) – hidden
The user interacts with RSAPv3 through the RSAP Controls Dialog box and the
visible worksheets. The hidden worksheets contain a variety of default data, trajectory
information and other data needed by RSAPv3 that the user should not normally need to
see. These worksheets are hidden to prevent inadvertent changes in the default data and
required program information.
The next type of components are Forms and RSAPv3 has the following forms
defined:
frmRSAPcontrols – this form is the primary means for the user to control
the program flow.
C-8
frmProgressBar – this form shows a progress bar during the analysis phase
showing the percentage of completion as well as some trajectory selection
messages.
frmRSAPsplash – this form is a simple splash screen that appears and
disappears when RSAPv3 is started.
frmXsectionChoice – this is a minor selection input form for the selection
of x-section data that is called by frmRSAPcontrols.
RSAPv3 is an event-driven piece of software meaning that the exact process flow
is determined by the user through the choice and order of buttons that are selected. There
is no overall “flow chart” of information flow since the user can move around the
program in any order they wish with the exception that all input has to be complete
before the “Run” button on frmRSAPcontrols is selected. This event-driven structure is
enabled primarily by the frmRSAPcontrols form.
The last type of component in the RSAPv3 VBA project are code modules. There
are nine RSAPv3 code modules:
moduleAlternatives – contains code that supports the Alternatives
worksheet.
moduleEncroachments – contains code that calculates the base
encroachment rate, applies adjustments and performs other tasks in
support of the Road Segments worksheet.
moduleMain – is the main program control for the analysis.
modulePOCanalysis – contains code that performs the collision analysis.
modulePOChaz – contains code that reads the hazard information and
processes it in support of modulePOCanalysis.
modulePOCtraj – contains code that selects, grades and processes
trajectories in support of modulePOCanalysis.
moduleResults – contains code that organizes and processes the results
and creates the information on the Results worksheet.
moduleTools – contains a variety of code that acts in support of RSAPv3
but is not associated with any particular worksheet or form.
moduleXsection – contains code that supports the X-Section worksheet.
CONVENTIONS
Each of these worksheets, forms and code modules will be described in later
portions of this manual. The following convention has generally been used throughout
the RSAPv3 code:
“sh” designates an MS Excel worksheet,
“frm” designates a VBA form,
“btn” designates a command button,
“lbl” designates a label form,
“module” designates a VBA code module,
“txt” designates a text box form,
“rbtn” designates a radio-button form and
C-9
“txt” designates a text box.
Subroutine and method names generally start with one of the fore-going
designations to help clarify the type of object that is being instantiated.
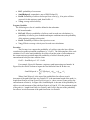
RSAP uses several worksheet cell styles to inform the user about where input can
and cannot be placed. RSAP uses the following styles which can be found in Excel
under the Home>Cell Styles group:
Input – this style indicates cells where the user must enter information.
This is the project specific information so there are no default values. This
cell style has a yellow highlighted background to indicate user input is
expected. This style is also by default unprotected.
Input2 – this style indicates cells where the user may provide input but
where RSAP will provide a default value. The cells are high-lighted rose
and are unprotected.
Heading1, Heading2, Heading3, Heading4, Normal 2—these four styles
are used to format the RSAP worksheets with a variety of font sizes and
font types. They user cannot change these cells as they are protected.
RSAP generally uses standard Excel format for number with one important
exception. A custom style “0+##.00;##+##.##;0+00.##” has been added to display
Station number in the traditional highway engineering format (i.e., the location 345.67
feet from the start of the project is Station 3+45.67). This is only a display format
meaning the number is entered into the cell as 345.67 but will be displayed as 3+45.67.
All cells that indicate station input have validation rules attached such that if the “+” sign
or any other non-numeric character is typed an error will be displayed.
Most cells that accept user input (i.e., cell styles “Input” and “Input2”) have
validation rules attached to prevent invalid data from being entered. For example, if a
positive numeric value is needed a validation rule requires the cell field to be input as
such. The many validation rules are not described herein but they can easily be identified
by selecting cell of interest, going to Data>Data Validation>Data Validation and
examining the rule appropriate for that particular cell.
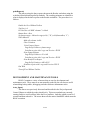
PROGRAM INITIATION
RSAPv3 is started whenever an RSAP macro-enabled worksheet or template is
started in MS Excel and involves three subroutines found in moduleTools:
AutoOpen
StartRSAP
ProcessPrioritySet
The subroutine moduleTools.AutoOpen() automatically starts when an RSAP
workbook is opened. This subroutine does the following:
Unload any open forms so they do not conflict with the new instance of
RSAPv3.
C-10
Hide the standard excel ribbons interface and set up the standard RSAPv3
view.
frmRSAPsplash displays the opening splash screen for 5 seconds
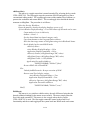
moduleTools.StartRSAP starts the RSAP program.
The subroutine moduleTools.Start RSAP actually starts the RSAP run as follows:
Sets up the application display to the RSAP default style
ProcessPrioritySet(High) ‘ set the process priority to high so RSAP fall
into the background processes.
Load frmRSAPcontrols ‘ this starts the RSAP Control Dialog box
Select shPrjInfo as the starting place for input
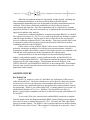
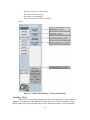
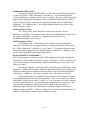
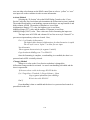
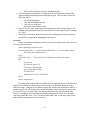
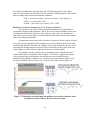
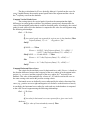
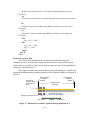
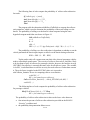
When moduleTools.StartRSAP completes the application screen should look like
Figure 1. If, for any reason, the RSAP controls dialog disappears, RSAPv3 can be restarted manually with the keystroke CTRL+s which is a keystroke macro that simply reruns moduleTools.StartRSAP. No information on the worksheets is lost when selecting
CTRL+S but any settings in the RSAP Controls Dialog box are re-set to their default
values.
Figure 1. Initial RSAPv3 Application Display.
PROJECT INPUT AND CONTROL
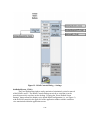
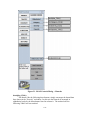
RSAP CONTROLS DIALOG BOX
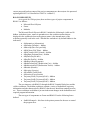
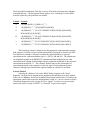
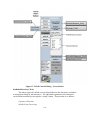
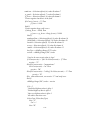
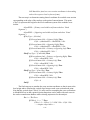
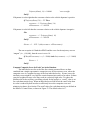
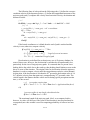
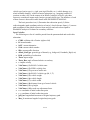
The RSAP controls dialog box is shown in Figure 2 and is initiated using the
Show method executed from modulesTools.StartRSAP(). The RSAP controls dialog
C-11
box is defined in the object frmRSAPcontrols which is a standard VBA User Form. The
main portion of the form a multipage form (i.e. mpControls) with a label in the lower left
(i.e., lnlNextStepHint) and six command button forms (i.e., btn UserMan, btnEngMan,
btnRSAPhep, btnSave, btnSaveAs, and btnExit). Figure 2 also shows the tab and button
bindings indicating which subroutine or method is executed when the button or tab is
pushed. frmRSAPcontrols has no input variables, constants or public variables other than
the standard VBA User Form properties.
Pressing the tabs executes the frmRSAPcontrols.mpControls_Change() method
which activates the appropriate worksheet, indicated on the left side of Figure 2 and sets
the value of frmRSAPcontrols.mpControls.value. Each of the tabs will be discussed in
detail below. The buttons that appear in the “context sensitive” area of Figure 2 are
determined by the value of frmRSAPcontrols.mpControls.value.
The six command buttons at the bottom of the RSAP Controls Dialog shown in
Figure 2 are always visible and available to the user. Pressing the buttons activates the
method indicated in Figure 2. For example, pressing the “User’s Manual” button
executes the frmRSAPcontrols.btnUserMan_Click() method which opens a window with
the User’s Manual in it. These six buttons are briefly described below:
Figure 2. RSAP Controls Dialog -- tab and button bindings.
C-12
btnUserMan_Click()
This button displays a PDF copy of the User’s Manual. RSAP first looks for the
User’s Manual file (i.e., RSAPv3userManual.pdf) in C:\Program Files\RSAPv3. If it
does not find the file there it looks in the RSAP home directory stored in the “Program
Information” worksheet in cell B24. If the file is not found in either of these places
RSAP attempts to load the file from the Internet at
http://rsap.roadsafellc.com/RSAPv3userManual.pdf. If even this fails an error message is
displayed. Regardless of the file location, the file is displayed using the
ActiveWorkbook.FollowHyperlink method; both local files and internet files are
displayed using the same method.
btnEngMan_Click()
This button displays a PDF copy of the Engineer’s Manual and the code is
identical to the btnUserMan_Click() subroutine except the Engineer’s Manual (i.e., the
file name is RSAPv3EngineersManual.pdf).
btnRSAPhelp_Click()
This button opens the RSAP help file. The help file is a Microsoft Compile
HTML help file (i.e., the file extension is .chm). The file RSAP.chm is distributed with
RSAPv3 and is usually located in the C:\Program Files\RSAPv3 subdirectory. RSAP
first looks for the file in the location specified in the public variable
moduleTools.helpfile. If it does not find the file there it looks in the RSAP home
directory stored in the “Program Information” worksheet in cell B24. If the help file is
not found in either of these locations an error message is displayed and the Windows
default help screen appears.
btnSave_Click()
This button saves the workbook using the existing workbook name property
using the ActiveWorkbook.SaveAs method when the filename property is set to the
current workbook name property.
btnSaveAs_Click()
This button prompts the user for a file name to save the current workbook. RSAP
can be started from either a macro enabled template (i.e., an xltm file) or a macro-enabled
workbook (i.e., an xlsm file). RSAP will not allow the user to save a project as a
template, only as a macro-enabled workbook. This prevents unintentional overwriting of
the source blank workbook template.
The method starts by setting the current workbook name property to the
temporary variable “currentName.” The Application.GetSaveAsFilename method is
called which brings up a standard Windows file browser where the user indicates the
desired filename and directory. If the filename returned by the GetSaveAsFilename
method is valid the file is saved.
btnExit_Click()
This button simply issues the Application.Quit method and thereby indirectly
executes the workbook_BeforeClose method of Excel. In RSAP the BeforeClose method
C-13
simply returns the ribbon interface back to its normal Excel settings so that when the user
opens a non-RSAP workbook the interface will appear as the standard Excel interface.
lblNextStepHint.Caption
The last always-visible feature of the RSAP Controls Dialog shown in Figure 2 is
the NextStepHint label. This area on the RSAP Controls Dialog is used to provide hints
to the user about the next appropriate input step. This is accomplished by RSAP setting
a text string equal to the lblNextStepHint.Caption property of frmRSAPcontrols. Many
different subroutines and functions write into this text box depending on the context. The
user cannot enter data in this locations; it is only for RSAP to write out text hints.
The lblNextStepHint label form can be hidden using the “Verbose Mode Off”
button in the Settings tabs as will be described later. The label is hidden by setting the
form property lblNextStepHint.Visible to FALSE.
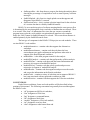
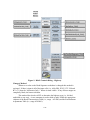
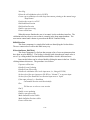
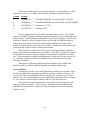
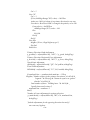
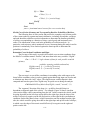
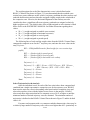
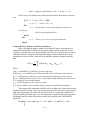
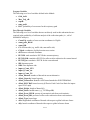
PROJECT INFORMATION WORKSHEET
The “Project Information” worksheet is used to collect basic project information from the
user like a project name, the design life, rate of return, construction year, etc. as shown in
Figure 3. (Note: Figure 3, like other screen shots of the worksheet in this manual, shows
the worksheets with the row and column labels on. This is not the normal RSAP default
but they are shown that way in this manual to aid in referring to the cell locations in the
text). The only required information is the project name in cell B5, indicated in yellow in
Figure 3. The rose colored cells may be changed by the user but contain RSAP default
values.
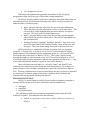
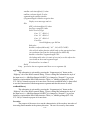
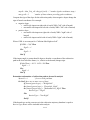
Selecting the “Project” tab in the RSAP Controls Dialog or selecting the
“Program Information” worksheet tab will set the frmRSAPcontrols.mpControls.Value
property to “0” , display the context sensitive buttons as shown in Figure 4 and activate
the Project Information worksheet (i.e., shPrjInfo).
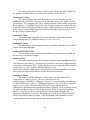
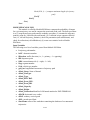
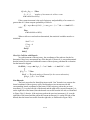
The Project Information view of RSAP Controls shown in Figure 4 includes five
command buttons which will be described below. The user can either select button on
the RSAP control form or select a “yellow” or “rose” user input cell on the worksheet in
order to enter information.
Activate Method
Selecting the “Project” tab on the RSAP Dialog Controls or the “Project
Information” tab in the Excel worksheet tabs instantiates the
shPrjInfo.Worksheet_Activate() method. In the case of shPrjInfo, RSAP simply checks
to see if there is any input in cell B5 (i.e., the project name). This is the only required
information on the “Project Information” worksheet although there are a number of other
default values that can be changed. If shPrjInfo.Range(“B5”) value is not blank, the
“Traffic Info >” button is set to visible indicating that it is appropriate to move on to the
next worksheet. If shPrjInfoRange(“B5”).Value=”” (i.e., is equal to blank) the “Traffic
Info >” remains hidden.
Lastly, shPrjInfo is selected and control is returned to frmRSAPcontrols.
C-14
Figure 3. Project Information Worksheet.
Change() Method
Whenever a value on the Project Information worksheet is changed this method
is activated. It simply checks to see if shPrjInfo.Range(“B5”) has a value. If it does, the
“Traffic Info >” button is made visible. If there is no value, the “Traffic Info >””” button
is hidden.
btnNewPrj_Click()
The purpose of this method is to allow a user to clear any data from the worksheet
and start a new fresh project. The method is executed by pressing the “Start a New
Project” button shown in Figure 4. The method first notifies the user that all user entered
information in the workbook will be removed and the RSAP defaults restored using a
standard vbYesNo message box. If the user responds “No” the method exits. If the user
responds “Yes”, the following steps take place:
Notify user all data will be deleted in a Msgbox and ask if they want to proceed
If user_response= YES then
Turn off event processing
Turn off screen updating
Unprotect all user input sheets.
Clear the content of user input cells of each worksheet.
Restore the RSAP defaults by copying the appropriate ranges from
shDefaults to the appropriate user input worksheet.
Select shPrjInfo.
Move the cursor to cell B5.
C-15
Reprotect all the user input sheets.
Re-enable event processing.
Re-enable screen updating
Set the Next button visibility to FALSE
End if
Figure 4. RSAP Controls Dialog -- Project Information.
btnOldPrj_Click()
This method is executed by pressing the “Open Existing Project” button shown in
Figure 4. The purpose of this method is to allow the user to read in an already existing
RSAP project file. Only the input data is read in and not the results. Once the data has
C-16
been read in it can be either changed or analyzed using the usual procedures. The
procedure is as follows:
Notify user all data will be deleted in a Msgbox and ask if they want to proceed
If user_response= YES then
Disable events
Disable alerts
Disable screen updating
Unprotect all user input sheets
Go through each sheet and clear all user entered data
Go through each sheet and restore all RSAP defaults
Open the existing file with Workbooks.Open
If filename<>FALSE then ‘file name is valid and exists
For all user input worksheets
Copy user input cells from old worksheet
PasteVavles user input cells into active worksheet
moduleEncroachments.sortRoadChars ‘Sort the road characteristics
moduleEncroacments.segChars ‘segment the project
btnEncr_Click() ‘ estimate the number of encroachments
shPrjInfo.Select ‘ go back to the Project Information worksheet
Re-protect all user sheets
Re-enable events
Re-enable screen updating
Re-enable alerts.
End if
btnProjInfoClear()
This method is executed by pressing the “Clear User Information” button shown
in Figure 4. Unlike btnNewPrj_Click() which clears all user input in the workbook, this
method only clears information on the Project Information worksheet.
Show Msgbox asking if the user really wants to clear the information
If user_choice = no then
Exit
Else
Unprotect shPrjInfo
shProjInfo.Range(“B5”).ClearContents
frmRSAPcontrols.btnNextTraffInfo.Visible=false
Protect shPrjInfo
End if
C-17
btnPrjInfoDefaults()
The purpose of this method is to allow a user to restore the RSAP default
information to the “rose” colored cells (i.e., style “Input2”)on the “Project Information”
worksheet. Any information that has been changed in these cells will be overwritten.
Show Msgbox vbYesNo asking if the user really wants to clear the information
and restore the RSAP defaults.
If user_choice = YES then
Unprotect shPrjInfo
shProjInfo.Range(“”B5:I5”).ClearContents
frmRSAPcontrols.btnNextTraffInfo.Visible=false
Protect shPrjInfo
End if
btnNextTraffInfo_Click()
The “Traffic Info>” button advances the control to the “Traffic Information”
worksheet. The button will not appear until there is user input in cell B5 of the “Project
Information” worksheet. Selecting the button execute this method which simply selects
the “Traffic Information” worksheet (i.e., shTraffInfo), selects cell C3 in that worksheet
and set the value of frmRSAPcontrols.mpControls.value=1.
TRAFFIC INFORMATION WORKSHEET
The “Traffic Information” worksheet is used to collect information from the user about
the traffic volume, traffic mix and vehicle properties as shown in Figure 5. The rose
colored cells may be changed by the user but contain RSAP default values.
Selecting the “Traffic” tab in the RSAP Controls Dialog or selecting the “Traffic
Information” worksheet tab will set the frmRSAPcontrols.mpControls.Value property to
“1” , display the context sensitive buttons as shown in Figure 5and activate the Traffic
Information worksheet (i.e., shTraffInfo).
The Traffic Information view of RSAP Controls shown in Figure 6. Figure 4
includes four command buttons which will be described below. The user can either
select buttons on the RSAP control form or select a “yellow” or “rose” user input cell on
the worksheet in order to enter information.
The worksheet itself contains the following formulae in the protected cells
indicated:
Cell Formula
C6
=$C$3*(1+C$4/100)^(‘Project Information’!$B$7/2)
C7
=$C$3*(1+C$4/100)^(‘Project Information’!$B$7)
C8
=IF($C$5=”Construction”,C3,IF($C$5=”End of Life”,$C$7,$C$6)
C26
=Sum(C13:C16)
C-18
The formula in cell C6 calculates the projected AADT for the midlife using the
AADT supplied in Cell C3, the traffic growth supplied in Cell C4 and half the project life
previously supplied on the Project Information worksheet in cell B7. The formula in cell
C7 is identical except the whole project life is used to calculate the AADT at the end of
the project life. The AADT used in the benefit-cost calculations is shown in cell C8
based on the user’s choice in cell C5. The formula in cell C26 simply sums the percent
of traffic for each vehicle type. A validation rule is applied such that if the value is not
equal to exactly 100.00 the cell is colored red. The user is not permitted to proceed until
the sum is 100.00.
Activate Method
Selecting the “Traffic” tab on the RSAP Dialog Controls or the “Traffic
Information” tab in the Excel worksheet tabs instantiates the
shTraffInfo.Worksheet_Activate() method. In the case of shTraffInfo, RSAP simply
checks to see if there is any input in user cells and either displays the “Highway Info”
button if there is or leaves it blank if there is not.
Figure 5. Traffic Information Worksheet.
C-19
Change() Method
Whenever a value on the Traffic Information worksheet is changed this method is
activated. It simply checks to see if shTraffInfo.Range(“C3:C4”) has a value using
moduleTools.RangeIsMT subroutine. If C3C4 has values, the “Highway Info >” button
is made visible. If there is no value, the “Highway Info >” button is hidden.
btnClearTraffInfo_Click()
Selecting the “Clear User Information” on this form executes this method which
is active only on the “Traffic Information” worksheet. The user is asked if the really
want to delete all the traffic information, if they respond YES then all the yellow INPUT
cells are cleared of their content. The “Highway Info >” next button is hidden unless all
the yellow INPUT cells have values.
Figure 6. RSAP Controls Dialog -- Traffic Information.
C-20
btnDefaultTraffInfo_Click()
Selecting the “Restore RSAP Defaults” on this form executes this method which
is active only on the “Traffic Information” worksheet (i.e., only information on the
“Traffic Information” worksheet is deleted or overwritten). The user is asked if the really
want to delete all the traffic information, if they respond YES then all the rose INPUT
2cells are cleared of their content and the appropriate default values are copied from
shDefaults. The “Highway Info >” next button remains hidden unless all the yellow
INPUT cells have values.
btnPrevProjInfo_Click()
The “<Project Info” button returns the control to the previous “Project
Information” worksheet. Selecting the button executes this method which simply selects
the “project Information” worksheet (i.e., shprojInfo)and sets the value of
frmRSAPcontrols.mpControls.value=0.
btnNextSegments_Click()
The “Highway Info>” button advances the control to the “Road Segments”
worksheet. The button will not appear until there is user input in all the yellow cells in
the “Traffic Information” worksheet (i.e., style “Input”). Selecting the button executes
this method which simply selects the “Road Segments” worksheet (i.e., shRdSegs), and
set the value of frmRSAPcontrols.mpControls.value=2.
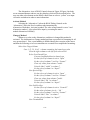
ROAD SEGMENTS WORKSHEET
The “Road Segments” worksheet is used to collect information from the user about the
characteristics of the roadway as shown in Figure 7 and Figure 8. The rose colored cells
may be changed by the user but initially contain RSAP default values; the yellow cells
require user input.
Selecting the “Highway” tab in the RSAP Controls Dialog or selecting the “Road
Segments” worksheet tab will set the frmRSAPcontrols.mpControls.Value property to 2 ,
display the context sensitive buttons as shown in Figure 9 activate the Road Segments
worksheet (i.e., shRdSegs). The initial worksheet view will be similar to Figure 7.
The Road Segments view of RSAP Controls shown in Figure 9Figure 4 includes
ten command buttons which will be described below. The user can either select buttons
on the RSAP control form or select a “yellow” or “rose” user input cell on the worksheet
in order to enter information. The Road Segments worksheet has two input areas. The
first is the Whole Roadway Characteristics area at the top of the worksheet (i.e.,
shRdSegs.Range(E3:E8) and the second is the User Entered Characteristics area in
shRdSegs.Range(A98:D587). The user is taken to the User Entered Characteristics area
when the “Enter Highway Characteristics” button is selected.
C-21
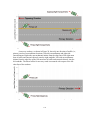
Figure 7. Road Segments Worksheet – Whole Roadway Characteristics Input Area.
Figure 8. Road Segments Worksheet – User Entered Characteristics Input Area.
C-22
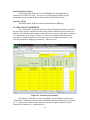
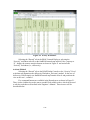
The Expected Encroachments Table has a variety of formulae coded into the worksheet
as described below. The descriptions below apply to rows 14 through 33 where ROW
would be replaced by the particular row number.
Column Formula
A
=IF(D64>[ROW-13],[ROW-13],””)
F
=IF(D[ROW]=””,””,SUM(G[ROW]:J[ROW]))
G
=IF(D[ROW]=””,””,E14*G13*PRODUCT(B[40+ROW]:D[40+ROW],
H[40+ROW]:N[40+ROW])
H
=IF(D[ROW]=””,””,E14*H13*PRODUCT(B[40+ROW]:D[40+ROW],
H[40+ROW]:N[40+ROW])
I
=IF(D[ROW]=””,””,E14*I13*PRODUCT(E[40+ROW]:N[40+ROW])
J
=IF(D[ROW]=””,””,E14*J13*PRODUCT(E[40+ROW]:N[40+ROW])
The formula in column A simply writes the appropriate segment number starting
with segment 1 in ROW=14 based on the total number of segments as listed in cell D64.
The formulae in columns G through J calculate the adjusted number of expected
encroachments for each encroachment type (i.e., PR, PL, OR and OL). The adjustments
are multiplied together in the PRODUCT statement and then multiplied by the total
encroachments in column E and multiplied by the proportion attributable to the particular
encroachment from ROW 13. The column F formula sums up the total number of
encroachments based on the estimates for the four types of encroachments listed in
columns G through J provided that the segment number in column D is not blank.
Activate Method
Selecting the “Highway” tab on the RSAP Dialog Controls or the “Road
Segments” tab in the Excel worksheet tabs instantiates the shRdSegs.Activate() method.
In the case of shRdSegs, RSAP sets frmRSAPcontrols.mpControls.value=2 to shift to the
appropriate control form, makes the default buttons visible (i.e., the view shown in Figure
9) and then changes the styles of range E3:E8 to “Input2” in order to accept user input
and sets the styles of range A98:D587” to “Normal2” to prevent user input.
C-23
Figure 9. RSAP Controls Dialog – Highway.
Change() Method
Whenever a value on the Road Segments worksheet is changed this method is
activated. If there is input in all of the input cells (i.e., A98:d588, E3:E5, G71:V90 and
B71:c71) then the “Alternative Info >” button is made visible. If any of these ranges are
completely blank, the button is hidden.
This method also checks cell E5 to determine the highway type (i.e., divided,
undivided or one-way). A case statement is used to hide or make visible the appropriate
columns of the Road Characteristics Table (i.e., range A63:P90) and the Encroachment
Adjustments Table (i.e., range A38:M61).
C-24
The change method also checks to make sure that 100 percent of the volume is in
the primary direction for one-way roadways by checking cells E5 and E3.
btnAutomatic_Click()
This macro shifts the view to the data entry area for road characteristics in
shRdSegs.Range(A98:D587). The style for the data entry area is set to “Input” to allow
for user input. The “Segment” and “Clear” buttons are made visible and the “Recalculate
Encroachments,” “Edit Whole Project Info” and “Defaults” buttons are hidden. The view
is split showing the Whole Project Characteristics on the top and the user data entry area
on the bottom. Control shifts to the user to allow for data entry and remains there until
the user selects “Segment Project.”
btnSeeEncr_Click()
This macro simply repositions the view of shRdSegs such that the Expected
EncroachmentsTable (i.e., shRdSegs.Range(A11:J33)) is in view.
btnDefaults_Click()
This macro clears all information from the rose colored cells and copies the RSAP
default values from shDefaults.
btnEditWholePrjInf_Click()
This macro sets up the view so that the Whole Project Information is visible and
the styles are set to allow user input.
btnEncr_Click()
This button calls the macros that calculate the encroachments and adjustments on
each segment of the roadway. The macro first checks to be sure there is appropriate data
in the Road Characteristics Table. If there appears to be missing data the user is notified
and the macro is exited. If there is sufficient data the macros
moduleEncroachments.calcBaseEncr() and moduleEncroachment.adjustEncr() are called.
These macros are described in the next chapter,Encroachment Module.
btnSegment_Click()
This button is initially hidden but is made visible when the “Enter Road
Characteristics” button is pressed. The style of the input area (i.e.,
shRdSegs.Range(A98:B587)) is changed to “Normal 2” to prevent further use input and
the Road Characteristics Table (i.e., shRdSegs.Range(B71:C90, G71:V90)) is cleared to
prepare it for new data. The macro sortRoadChars() is then called to sort the
characteristics into homogeneous segments and then segChars() macro is called to assign
the segment characteristics to the Road Characteristics Table. Lastly, RSAP calls the
btnEncr_Click() macro which calculates the base encroachment and applies the
appropriate adjustments. Essentially, this button executes the encroachment module of
RSAP as described in the next chapter. After the adjusted encroachments have been
calculated the macro re-sets the buttons to the view shown in Figure 9.
C-25
btnSeeCharTable_Click()
This button simply shifts the view of shRdSegs such that the Roadway
Characteristics Table is in view. The screen is split showing the Whole Project
Information on the top and the Road Characteristics Table on the bottom.
btnClear_Click()
This button clears all the user-entered information on shRdSegs.
ALTERNATIVES WORKSHEET
The “Alternatives” worksheet is used to collect information from the user about
the the various specific roadside alternatives that will be considered in the benefit-cost
analysis. The alternative information is entered by the user on the Alternative worksheet
(i.e., shAlternatives) as shown in Figure 10. There is no default information on the
Alternatives worksheet and the user can define up to five different alternatives. The
worksheet defaults to displaying alternative 1 when activated.
Figure 10. Alternatives Worksheet.
Selecting the “Alternatives” tab in the RSAP Controls Dialog or selecting the
“Alternatives” worksheet tab will set the frmRSAPcontrols.mpControls.Value property
to “3” , display the context sensitive buttons as shown in Figure 10and activate the
Alternatives worksheet (i.e., shAlternatives).
C-26
The Alternatives view of RSAP Controls shown in Figure 11Figure 4 includes
seven command buttons and two text-box displays which will be described below. The
user can either select buttons on the RSAP control form or select a “yellow” user input
cell on the worksheet in order to enter information.
Activate Method
Selecting the “Alternatives” tab on the RSAP Dialog Controls or the
“Alternatives” tab in the Excel worksheet tabs instantiates the
Alternatives.Worksheet_Activate() method. The value of mpControls is set to 3 and
Alternative number 1 is pre-selected for input by executing the macro
moduleAlternatives.EditAlt(1).
Change() Method
Whenever a value on the Alternatives worksheet is changed this method is
activated. The shAlternatives.Change method performs a great deal of formatting for all
rows greater than 9. First, event handling is disabled during the execution of the macro
and then the following set of case statements are executed to accomplish the formatting:
Select Case Target.Column
Case 1, 12, 23, 34, 45 ‘ columns containing the hazard type value
Clear the eight columns to the left of the selected cell
Select Case Hazard Type
Case any longitudinal barrier hazard type
Set the style to of columns 4 to 6 to “Input”
Set the style of columns 7 and 8 to “Normal”
Clear any values from columns 7 and 8.
Print the label “width” in column 7
Set the style of column 8 to “Input2”
Case Special Edge
Set the style to of columns 4 to 6 to “Input”
Set the style of columns 7 and 8 to “Normal”
Clear any values from columns 7 and 8.
Print the label “NA” in column 7
Set the style of column 8 to “Input2”
Case PoleTreeSign
Set the style to of columns 4 to 6 to “Normal 2”
Set the value of columns 4 to 6 = “NA”
Set the style of columns 7 and 8 to “Normal”
Print the label “Dia.” in column 7
Set the style of column 8 to “Input2”
Case TerminalEnds
C-27
Set the style to of columns 4 to 6 to “Normal 2”
Set the value of columns 4 to 6 = “NA”
Set the style of columns 7 and 8 to “Normal”
Print the label “Width” in column 7
Set the style of column 8 to “Input2”
Set the default value to 24”
End Case
End Select
Figure 11. RSAP Controls Dialog -- Alternatives.
C-28
lblAltNum
This is a text box label that displays the number of alternatives that have been
defined by the user. The initial default value is one. The number of alternatives must be
an integer greater than zero and less than 6. The user cannot change this text box, RSAP
changes the value based on the user choices described below.
btnClearAlts_Click()
This button clears all user entered information from the Alternatives worksheet.
txtAlt2Copy
The user can enter a number in this text box indicating the alternative they would
like to copy. This text box works in conjunction with the “Copy Alt” button next to it.
First, the user enters the integer value of the alternative they want to copy and then they
press the “Copy Alt” button to affect that action. The new alternative is automatically
added and the lblAltNum.value is incremented by one (i.e., if there are three alternatives
and the user copies the 2nd alternative, the new copied alternative will be alternative 4).
btnCopyAlt_Click()
lblAlt2Delete
The user can enter a number in this text box indicating the alternative they would
like to delete. This text box works in conjunction with the “Delete Alt” button next to it.
First, the user enters the integer value of the alternative they want to delete and then they
press the “Delete Alt” button to affect that action. The selected alternative is
automatically removed and the lblAltNum.value is decreased by one (i.e., if there are
three alternatives and the user deletes the 2nd alternative, the 3rd alternative will be
become alternative 2).
btnSortAlts_Click()
This macro simply sorts the user entered information into station order. It is not
necessary to press this button, it is only provided for the convenience of the user to
organize the information.
rbtnAlt1_Click()
Five radio buttons are displayed in the a frame (i.e., Frame2) with the label
“View/Edit.” All five buttons work exactly the same so only the first (i.e.,
rbtnAlt1_Click()) is described here. Selecting the radio button shifts the view to display
the user input area for the alternative selected, changed the cell style for that alternative to
“Input” and changes the cell style for all other cells to “Normal 2.” The user can then
enter data in the yellow highlighted cells until they chose another button. This macro sets
the rbtnAlt1.value=TRUE showing that the radio button has been selected and then calls
the macro moduleAlternatives.EditAlt(1) which sets up the formating.
btnViewHazData_Click()
This button activates the Severity worksheet and shifts the view to the Severity
worksheet (i.e., shSeverity). It also sets the mpControls value to 8 which displays the
“Hazard” tab as shown in Figure 21. This button shifts control to the Severity tab of the
RSAP Control Dialog.
C-29
btnPrevBuildSegments_Click()
This button returns the user to the Road Segments worksheet by activating
shRdSegs and setting mpControls=2. The user is taken back to the previous input
worksheet. Any information entered on the Alternatives worksheet is saved so the user
can come back to where they left off.
btnNextAnalyze_Click()
This button advances the user to the X-Section worksheet by activating the
“Cross-Section” worksheet (i.e., shXsection) and setting mpControls=4.
CROSS-SECTION WORKSHEET
The “Cross Section” worksheet is used to collect information from the user about
the roadside and median cross sections for each of the alternatives defined on the
Alternative worksheet as shown in Figure 12. The rose colored cells may be changed by
the user but contain RSAP default values.
Figure 12. Cross-Section Worksheet.
Selecting the “X-Section” tab in the RSAP Controls Dialog or selecting the
“Cross Section” worksheet tab will set the frmRSAPcontrols.mpControls.Value property
to 4 , display the context sensitive buttons as shown in Figure 13and activate the Cross
Section worksheet (i.e., shXsection). The mpControl method also calls the macro
moduleXsection.buildXsectionListBox which creates the list shown in lbXsectionNames
as discussed below.
The X-Section view of RSAP Controls shown in Figure 13 Figure 4 includes four
command buttons and a selection-list dialog box which will be described below. The
C-30
user can either select buttons on the RSAP control form or select a “yellow” or “rose”
user input cell on the worksheet in order to enter information.
Activate Method
Selecting the “X-Section” tab on the RSAP Dialog Controls or the “CrossSection” tab in the Excel worksheet tabs instantiates the shXsection.Activate() method.
The method first disables event handling, unprotects the sheet, sets mpControls=4 and
hides columns AF:BR. The number of alternatives is read from
shAlternatives.Range(“C3”).value, the highway type is read from
shRdSegs.Range(“E5”).value and the number of segments is read from
shRdSegs.Range(“D64”).value. These values are used in formatting the input area.
The input areas in D5:H24 and columns J:Z are first set to style “Normal 2” to
prevent user input and any values are cleared. Next,
For i=1 to Number of Alternatives
The default value shown of shAlternatives for that Alternative is copied
The cell style is set to “Input 2” to allow for user input
Next Alternative
‘Show segment characteristics for segment 1 initially
Copy the data in shRdSegs row 71 to D26:D31
Once the formatting is complete, event handling is re-enabled, the sheet is reprotected and cell D5 is initially selected.
Change() Method
Whenever a value on the Cross-Section worksheet is changed the
shXsection.Change method is activated. As usual event handling is disabled and the
sheet is unprotected.
‘If the user selects a cells in the range D5:H24 do this
If 4>Target.Row<25 and the 3>Target.Column < 9 then
Copy segment information from shRdSegs
Write it into cells D26:D31
End if
Event handling is then re-enabled and the sheet is re-protected and controls is
passed back to the user.
C-31
Figure 13. RSAP Controls Dialog – Cross-Section.
btnDefaultXsection_Click()
This macro copies the default cross-sections defined on the Alternative worksheet
to all segments listed for that alternative. The individual segments for each alternative
can be further modified by selecting the “Assign” button. The procedure is as follows:
Unprotect shXsection
Disable Event Processing
C-32
alts=Read the number of alternatives from shAlternatives.Range(C3)
hwyType= Read the highway type from shRdSegs.Range(E5)
segs=Read the number of segments from sRdSegs.Range(D64)
For iSegs=1 to segs
For iAlt=1 to alts
Copy the name in row3 for that alternative to every row in
the column between 5 and segs+4
Next iAlt
Next iSegs
Delete the validation rules in D5:H24
Set the style in D5:H24 to “Normal 2” to prevent user input
Protect shXsection
Enable event processing
Position the cursor at D5
btnSaveXsection_Click()
This button is initially hidden and is only revealed if the “Assign X-Sections to
Segs and Alts” button is pressed. The purpose of the macro is to save a new or edited
cross-section definition that the user has established in the detailed cross-section input
area. When the user has entered all the information and is satisfied with the crosssection, this button is selected if the user wants to save the cross-section to use in RSAP.
The macro proceeds as follows:
Ask the user for a name for the x-section
Select Case xSectionName
Case “”
Exit Sub
Case frmRSAPcontrols.lbxsectionNames.value
Loop through the name database and find the row associated with
that name.
Case Else
Write the new name at the end of the database list in a new row
End Select
Unprotect shXsection
Disable event processing
Write all the information in the user input area into the database row for
the named slope.
Call moduleXsection.buildXsectionListBox to re-build the list box view
Call moduleXsection.xsectionInList
Enable event processing
Position the cursor to D5
Protect shXsection
C-33
Hide btnSaveXsection
Hide btnDeleteXsection
btnDeleteXsection_Click()
This button is initially hidden and is only revealed if the “Assign X-Sections to
Segs and Alts” button is pressed. The button removes a named cross-section from the
RSAP database of cross-sections and re-builds the list box and validation menus. The
procedure is as follows:
Ask user if they really want to delete the cross section
If YES then
Find the row in column 32 with a name that matches the selection
Unprotect shXsection
Disable event processing
Clear the row in column 32 where matching the cross-section name
Copy the next row to the last row
Paste the selection into the row just cleared
Call moduleXsection.buildXsectionListBox to re-build the list box
Call moduleXsection.xsectionInList to check that the name is valid
Enable event processing
Protect shXsection
Position the cursor in cell D5
Hide the Save and Delete buttons
End if
btnAssign_Click()
This macro allows the user to select different cross-sections for each segment and
each alternative. Each cell in the input area (i.e., D5:H24) represents a different segment
and alternative. The user can choose a cross-section for each cell. The macro proceeds
as follows:
Unprotect shXsection
Disable Event Processing
alts=Read the number of alternatives from shAlternatives.Range(C3)
hwyType= Read the highway type from shRdSegs.Range(E5)
segs=Read the number of segments from sRdSegs.Range(D64)
Set the style of the detail cross-section input area to “normal 2” to prevent input
For iSeg=1 to segs
For iAlt=1 to alts
Set the style to “Input” to allow user input only in cells where a
valid segment and alternative have been defined in
shRdSegs and shAlternatives.
Next iAlt
C-34
Next iSeg
Delete the old validation rules in D5:H24
Create a new validation rule with drop-down menus pointing to the named range
“SlopeNames”
Position the cursor in cell D5
Hide btnDeleteXsection
Hide btnSaveXsection
Enable event processing
Protect shXsection
When this macro finishes the user is in control via the worksheet interface. The
validation rules have been re-set to what is currently in the slope name database. The
user retains control until a button is pressed on the RSAP Controls Dialog.
lblEditXsection
This form component is a simple label with text identifying the list box below.
The user cannot select or affect this label in any way.
lbXsectionNames_DblClick()
This form component is a list box that presents a list of cross-section names that
have been saved in RSAPv3. The list box is actually built when the mpControl value is
set to 5 by calling moduleXsection.buildXsectionListBox. which is discussed next.
Items in this listbox can be selected double clicking the name in the box. Double
clicking initiates this macro. The procedure is as follows:
Unprotect shXsection
Disable Screen Updating
Disable Event Processing
Disable the validation rules in the input area (i.e., Range(D5:H24)
Set the style of the user input area D5:H24 to “Normal 2” to prevent input
Set the style of the Detailed Cross-Section Input area to “Input”
If the name selected <> blank then
Call moduleXsection.writeXsectionInfo
Else
Tell the user to select a cross-section
End if
Enable screen updating
Enable event processing
Make btnSaveXsection visible
Make btnDeleteXsection visible
Protect shXsection
C-35
When the macro finishes executing the user input area for detailed cross-section
information is prepared with the appropriate cells being highlighted yellow indicating
user input is needed. Control stays with the user on the worksheet until either the Save or
Delete buttons are selected.
lbxXsectionNames_Change()
This macro simply repaints the list box whenever anything is changed such that
the view is always current.
MODULEXSECTION
While the macros in this module are not a part of frmRSAPcontrols, they are
discussed here because their only function is to support the control buttons on the XSection tab of frmRSAPcontrols. The module consists of the following four macros:
buildXsectionListBox()
This macro is called whenever mpControls is set to 4 and …. . It builds the list
that is displayed in the lbXsectionNames shown in Figure 13. The list is stored in a
hidden portion of shXsection in column 32 starting in row 15.
Starting in row 15 of column 32
Look at each row until a blank cell is found
The cell above the blank is the last row
Name the range from row 14 to the last row in column 32 “SlopeNames”
Set the Rowsource of lbxsectionNames = SlopeNames
Sort the names in alphabetical order
The result of this macro is that the list of names in column 32 appear in the
lbxsectionNames.
writeXsectionInfo()
This macro transfers the cross-section information from the user input area where
new cross-sections can be defined and existing cross-section can be edited to the hidden
database area of shXsection. The macro first looks to see if the name is already in use. If
it is the new information is used to over-write the old data. If the name is not already in
the list it is added and the new cross-section information is associated with the new name.
xsectionlnList()
This macro checks to ensure that the default cross-sections selected in the
segment and alternative cells of shXsection are valid cross-section that are in the list in
column 32. If a name is not found the user is notified and asked to pick a valid crosssection name from lbxXsectionNames. The macro will not allow the user to proceed
until a valid name is selected.
ANALYZE
Unlike most of the tabs on the RSAP Controls Dialog, the “Analyze” tab is not
associated with a particular worksheet. Instead, the buttons available on this form control
C-36
the execution of the analysis. The form has both a simple view and a more complicated
view where analysis settings can be made as will be described shortly.
Selecting the “Analyze” tab in the RSAP Controls Dialog will set the
frmRSAPcontrols.mpControls.Value property to “6” and display the context sensitive
buttons as shown in X and Y .
Figure 14. RSAP Controls Dialog – Analyze (Condensed View).
btnRun_Click()
The “Run” button initiates the RSAPv3 analysis phase. The macro proceeds as
follows:
C-37
Screen updating is turned off
Display status bar is turned off
moduleXsection.finalXsectionWrite is called to write final roadside terrain data
shPOCscratch is unhidden and unprotected
shPOCplots is unhidden and unprotected
Load frmProgressBar
Start timer
Call ModuleMain.Main
End timer
Unload frmProgressBar
If user has not canceled the run then
Activate the Results worksheet
Set mpControls=6 to make the RSAP Controls Results Dialog visible
Print the analysis time information on the Results worksheet
Call moduleResults.FeatureResults
Call moduleResults.SegResults
Else
Set mpControls =5 ‘the Analyze tab
Exit Sub
End if
The call to moduleMain.Main initiates the collision and severity modules of
RSAP and are discussed in the Crash Prediction Module and Severity Module chapters.
The calls to moduleResults.featureResults and moduleResults.segResults initiates the
Benefit-Cost Module as discussed in the Benefit-Cost Module Chapter.
btnSeeTrajSettings_Click()
Selecting the “See Settings” button makes the full settings button panel visible as
shown in Figure 23. The function and use of each of these settings buttons is described in
detail in the Crash Prediction Module Chapter.
btnPrev_Click()
The “< X-Section Info” button sets the control back to the “Cross-Section”
worksheet. Selecting the button executes this method which simply selects the “CrossSection” worksheet (i.e., shXsection), and set the value of
frmRSAPcontrols.mpControls.value=4.
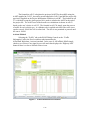
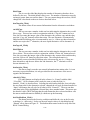
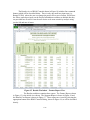
RESULTS WORKSHEET
The “Results” worksheet is used to display the results of the analysis to the user and, in
the background, perform the benefit-cost calculations. Selecting the “Results” tab in the
RSAP Controls Dialog or selecting the “Results” worksheet tab will set the
frmRSAPcontrols.mpControls.Value property to 6 , display the context sensitive buttons
as shown in Figure 18 and activate the Results worksheet (i.e., shResults).
C-38
The Results view of RSAP Controls shown in Figure 18 includes four command
buttons which will be described below. There is only one small user input area (i.e.,
Range(X5:X6)) where the user can change the project life or rate of return. RSAP uses
the values entered previously on the Project Information worksheet as defaults but they
are provided here as well in case the user desires to do some sensitivity analysis using
just the life and rate of return.
Figure 15. Results Worksheet – Feature Report View.
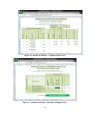
The Results worksheet contains three reports. The Feature Report, shown
in Figure 15, is the initial view shown. The Segment Report is shown in Figure 16 and
the Benefit-Cost Report is shown in Figure 17. These reports are viewed by selecting the
appropriate button in the RSAP Controls Dialog, shown in Figure 18, as will be described
shortly.
C-39
Figure 16. Results Worksheet – Segment Report View.
Figure 17. Results Worksheet – Benefit-Cost Report View.
C-40
The Results worksheet has several built-in formulae as discussed below. All the
formulae are below row 8. ROW in the following list indicates the ROW number.
Column Formula
J
=IF(B[ROW]=””,””,VLOOKUP(D[ROW] ,Severity!A4:H201,3,FALSE)
K
=IF(B[ROW]=””,””,VLOOKUP(D[ROW],Severity!A4:H201,4,FALSE,F[ROW]
W
=IF(V[ROW]=””,””,Alternatives!C7*X7)
X
=IF(V[ROW]=””,””,Alternatives!I7)
Cells in column J below row 8 include the formula shown above. The formula
uses the VLOOKUP function to lookup the annual maintenance cost of each hazard in the
Feature Report. The hazard annual maintenance cost is listed in column C of the Severity
worksheet. Similarly, cells in column K below row 8 use the VLOOKUP formula to
lookup the average repair cost for each feature and then multiply that value by the
number of crashes with the feature shown in column F. In both cases, the lookup is only
performed if the segment value in column B is not blank.
The formulae in columns W and X are part of the Segment Report. Both only
display if the Alternative number shown in column V is not blank. Column W calculates
the annualized construction cost by reading the total alternative construction cost from
row 7 of the Alternatives worksheet and multiplying it by the rate of return value in cell
X7. Similarly, column X reads the maintenance cost for each alternative from the
Alternative worksheet.
The Benefit-Cost Report contains numerous formulae in the worksheet but
discussion of these is deferred until the Benefit-Cost Module Chapter below.
Activate Method
Selecting the “Results” tab on the RSAP Dialog Controls or the “Results” tab in
the Excel worksheet tabs instantiates the shResults.Activate() method. Columns A:K,
L:AI and AL:AR are initially hidden in order to display the “Features Report” as the
default. The value of mpControls is set to 6 which displays the buttons shown in Figure
18. The window is also scrolled to column A and row 1 for the initial view.
The macros that actually calculate the crash costs are executed after the crash
prediction module is complete. The two macros moduleResults.featureResults and
moduleResults.segResults are called at the end of the btnRun macro discussed in the
Analysis section.
C-41
Figure 18. RSAP Controls Dialog -- Results.
Change() Method
Whenever a value on the Results worksheet is changed the shResults.Change
method is activated. The method only looks for changes in cells X5 and X6 which
contain the rate of return and design life values. If either of these are changed, the
subroutine modulesResults.and segResults are re-run to recalculate the economic costs in
the Segment Report.
btnSegReport_Click()
The Segment Report is contained in columns L:Z so this macro simply un-hides
columns L:Z and hides columns A:K and AA:AI. The resulting view is shown in Figure
16.
C-42
btnBCReport_Click()
The Benefit-Cost Report and Table are contained in columns AA:AI so this macro
makes those columns visible and hides columns A:K and L:Z. The resulting view is
shown in Figure 17.
btnFeatureReport_Click()
The Feature Report is the default view shown on the Results worksheet and this
button returns the view to that report. It simply makes columns A:K visible and hides
columns L:AI. The resulting view is shown in Figure 15.
btnPrint_Click()
This macro first unprotects shResults and call the macro
moduleResults.printReports which will be described in the Benefit-Cost Module Chapter.
SETTINGS
Unlike most of the tabs on the RSAP Controls Dialog, the Settings tab is not
associated with a particular worksheet so whatever worksheet is active when the Setting
tab is selected remains active and in view. The Settings tab provides some useful tools
for the user to control the display and functionality of RSAP and has no impact on the
analysis results.
Selecting the “Settings” tab in the RSAP Controls Dialog will set the
frmRSAPcontrols.mpControls.Value property to “7” , display the context sensitive
buttons as shown in Figure 19. The Settings view of RSAP Controls shown in Figure 19
includes three visible command buttons, one of which is a toggle, which will be described
below.
C-43
Figure 19. RSAP Controls Dialog -- Settings.
btnDefaultScreen_Click()
The Excel application window can be maximized, minimized, resized or moved
while RSAP is active. The RSAP Controls Dialog can not be re-sized but it can be
moved interactively anywhere on the desktop. Pressing the “Reset Default Screen
Settings” button returns the display to its default RSAP configuration (i.e., see Figure 1)
with the RSAP controls in the upper left of the application window and the worksheet
view maximized within the application screen.
C-44
btnNextStepHintOff_Click()
Selecting the “Verbose Mode Off” on this form executes this method which hides
the next step hint at the lower left of the RSAP Controls Dialog (i.e., lblNextStepHint). It
also . Selecting this option also hides the message display area of the Progress Bar form
that is shown while the analysis is running.
btnNextStepHintOn_Click()
The verbose mode is actually a toggle so if “Verbose Mode Off” is selected it is
replaced with the initially hidden button “Verbose Mode On” shown in Figure 19.
Selecting this button turns the verbose mode back on by un-hiding the lblNextStepHint
box and re-sizing the frmProgressBar such that the run-time messages appear.
btnHomeDir_Click()
The default condition for RSAP is to be installed in C:\Program Files\RSAPv3.
Sometimes users do not have administrative privileges on their computers so they are not
able to install RSAP in that location. Since RSAP is simply a macro-enabled Excel
workbook it does not really need to be installed, the workbook can be copied to any
location on the user’s computer. The only disadvantage to putting an RSAP workbook in
another location is that RSAP does not know the location of the User’s Manual,
Engineer’s Manual and help file. Selecting the “Change RSAP Home Directory” brings
up a directory selection browser. The user can select any subdirectory and the path to
that subdirectory is saved in cell B24 of the “Project Information” worksheet. As
described earlier, if the User’s Manual, Engineer’s Manual or help files cannot be found
in C:\Program Files\RSAPv3 the directory listed in shPrjInfo.Range(“B24”).value is then
searched.
HAZARDS WORKSHEET
The “Severity” worksheet, shown in Figure 20, is a database of all the hazards
that can be used in RSAPv3. The “Severity” worksheet can be accessed either by
selecting the “Hazard” tab on the RSAP Controls Dialog or selecting the “Severity”
worksheet tab. The user is not allowed to make changes to the “Severity” worksheet but
reviewing it can be useful.
C-45
Figure 20. Seveity Worksheet.
Selecting the “Hazard” tab in the RSAP Controls Dialog or selecting the
“Severity” worksheet tab will set the frmRSAPcontrols.mpControls.Value property to
“8” , display the context sensitive buttons as shown in Figure 21 and activate the
“Severity” worksheet (i.e., shSeverity).
Activate Method
Selecting the “Hazard” tab on the RSAP Dialog Controls or the “Severity” Excel
worksheet tab instantiates the shSeverity.Worksheet_Activate() method. In the case of
shSeverity, RSAP simply sets frmRSAPcontrols.mpControls.value=8 and positions the
view at the row 1, column 1.
Five command buttons are available in the Hazards area as shown in Figure 21.
There is also a hidden key-stroke macro, moduleTools.editSeverities, which can be used
to edit the worksheet as described in the Engineer’s Manual. These macros will be
described below.
C-46
Figure 21. RSAP Controls Dialog -- Hazards.
btnAlpha_Click()
This button, like the following three buttons, simply rearranges the hazard data
base shown in the “Severity” worksheet. In this case the hazards are arranged in
alphabetical order by the hazard name listed in column A. The method uses the
following VBA Excel sort method:
C-47
'first find the bottom row
Count = 4
Do Until shSeverity.Cells(Count, 1) = ""
Count = Count + 1
Loop
botRow = Count - 1
'sort the list in alphabetical order to save on the severity worksheet
With shSeverity.Sort
.SortFields.Clear
.SortFields.Add Key:=Range(Cells(4, 1), Cells(botRow, 1)),
SortOn:=xlSortOnValues, Order:=xlAscending, DataOption:=xlSortNormal
.SortFields.Add Key:=Range(Cells(4, 9), Cells(botRow, 9)),
SortOn:=xlSortOnValues, Order:=xlAscending, DataOption:=xlSortNormal
.SetRange Range(Cells(4, 1), Cells(botRow, 24))
.Header = xlNo
.MatchCase = False
.Orientation = xlTopToBottom
.SortMethod = xlPinYin
.Apply
End With
btnCategory_Click()
This method works exactly like btnAlpha_Click() except the data is sorted by the
hazard category in column 11 (i.e., column K) rather than 1.
btnSeverity_Click()
This method works exactly like btnAlpha_Click() except the data is sorted by the
severity in terms of the EFCCR65 in column 5 (i.e., column E) rather than 1.
btnCapacity_Click()
This method works exactly like btnAlpha_Click() except the data is sorted by the
hazard capacity listed in in column 8 (i.e., column H) rather than 1.
btnBk2Alts_Click()
This button selects the “Alternatives” worksheet and sets the
frmRSAPcontrols.mpControls.value = 3. This returns the view and control to the
“Alternatives” worksheet.
modulesTools.editSeverities()
This is a hidden key-stroke macro meaning that it is not initiated from the RSAP
Controls Dialog user interface and is not mentioned in the User’s Manual. Typical users
will not need to edit the information on the “Severity” worksheet while it is visible it is
C-48
protected against user input. If the information in the hazard data base does need to be
edited or updated, however, this macro can be used to do so.
To execute the macro go to the “Severity” worksheet and use the key stroke
CTRL+SHIFT+H. The macro is a toggle so the first time the key stroke is pressed the
“Severity” worksheet is unprotected and the Excel ribbon interface is turned on. All the
Excel interface features are turned on and the worksheet can be edited like any typical
worksheet. The second time the CTRL+SHIFT+H key stroke is issued the ribbon
interface is turned off, the sheet is re-protected and the internal hazard menus are sorted
and rebuilt using the following code and RSAPv3 is re-started.
shSeverity.Select ‘ select the severity worksheet
‘if the headings are on, turn them off and re-build the hazard menus
‘otherwise turn them off and allow editing.
If ActiveWindow.DisplayHeadings=TRUE Then
Start at row 4
Count the rows until a blank cell is found
The last non-blank cell is the bottomRow
Sort the data fields in the worksheet by hazard category (i.e., column 11)
Unprotect and make visible shPrgData
Clear the old hazard menu definitions in Range(“J3:T48”)
Copy the category names from shSeverity to shPrgData
Rebuild the context sensitive menus by resizing the range names for each
hazard category.
Turn off display headings
Turn off the formula bar
Protect shSeverity
Protect shPrgData
Hide shPrgData
Hide the Excel ribbons interface
Re-start RSAP by calling moduleTools.StartRSAP
Exit
Else
‘turn on the ribbon interface and unprotect the worksheet to allow edits
Turn on display headings
Turn on the formula bar
Unprotect shSeverity
Unprotect shPrgData
Unhide shPrgData
Unhide the Excel ribbons interface
Exit
C-49
End if
ENCROACHMENT MODULE
As discussed earlier, the number of encroachments that can be expected on a
particular road section in a year is given by:
∙ ∙
∙
∙
where the terms are as defined earlier. The encroachment module of RSAPv3 is executed
when the user presses the “Segment Project” button on the “Highway” tab of the RSAP
controls dialog shown earlier in Figure 9. The code for the encroachment module is
contained in module.Encroachments which contains five subroutines and functions.
PROCEDURE
Estimating the number of encroachments is initiated in one of two ways by the
user: either selecting the “Segment Project” button or the “Recalculate Encroachments”
buttons on the RSAP controls dialog as shown in Figure 9. Selecting either button results
in the following:
moduleEncroachments.calcBaseEncr
moduleEncrochments.adjustEncr
RSAP first calculates the expected number of encroachments using the base
conditions (i.e., no adjustments) and then finds the appropriate adjustment factors. The
details of each of these subroutines is discussed below.
adjust()
This function is a linear interpolation lookup function that takes the segment
characteristic to find the appropriate adjustment value based on the characteristic value
and the highway type.
Input Variables
The following five variables are passed to the subroutine:
inSheet is …
startCell is the top left cell in the adjustment factor lookup table being queried.
The legal values of startCell in this version of RSAP are:
o A5 or the base encroachment frequency,
o E5 for the access density adjustment factor,
o I5 for the rumble strip adjustment factor,
o M5 for the multi-lane adjustment factor,
o Q5 for the posted speed limit adjustment factor,
o Y5 for the shoulder width adjustment factor,
o AC5 for the terrain type adjustment factor,
o AG5 for the grade adjustment factor and
C-50
o AK5 for the horizontal curvature adjustment factor.
shift corresponds to the number of columns to the left of the first column of the
queried lookup table and represents the highway type. Shift can have one of the
following values:
o 1 for divided highways,
o 2 for undivided highways and
o 3 for one-way roadways.
Any other value returns an error.
lookUpVal is the value of the particular characteristic that is being adjusted. For
example if the adjustment factor for Lane Width is being sought lookUpVal might
be 12 feet.
debugFlag is a Boolean indicator that will turn on debugging messages that may
be useful to a programmer debugging the procedures.
Procedure
All the encroachment adjustment factors are located on shEncrAdj so the first step
is to select that worksheet.
shEncrAdj.Range(startCell).select
Do Until lookUpVal >= selection and lookUpValue <= selection.off(next Row)
Selection.offset(nextRow).select
Loop
If selection.value=”” then notify user an adjustment could not be found
Else
A=selection
B=selection.offset(1,0)
C=selection.offset(0,shft)
D=selection.offset(1,shft)
E=lookUpVal
Adjustment=C+(D-C)*(E-A)/B-A)
End if
Return (Adjustment)
In setting up the lookup tables on shEncrAdj it is important to be sure that the first
and last rows of the first column have values that are sized such that the input value is
within the range. Using the Lane Width example, the smallest lane width in the table is 0
and the largest is 40. Obviously these are not reasonable values but they are used so that
if a value of, say 8.9 is entered the value will not fall below the first value in the table.
Likewise a maximum value should be identified such that there will never be an input
value larger than that value. If a 14-ft lane is entered the value is still in the range of the
table and the interpolation will work correctly.
C-51
adjustEncr()
After the base encroachment frequency has been determined in calcBaseEncr() it
is modified by any appropriate adjustment factors based on the road characteristics
written by segChars range A71:P90.
Program Variables
spdLim- the posted speed limit,
numLane – the total number of lanes,
p_grade – the grade in the primary direction,
p_hcurv – radius of horizontal curvature in the primary direction,
numLanePrim- number of lanes in the primary direction,
lnwidth – lane width,
access- access density,
rumble – Boolean value indicating presence/absence of edge-line rumble strips,
hwyType – character indicating the highway type:
D for divided highways,
U for undivided highways and
O for one-way roads and ramps.
Terrain – character indicating the general terrain type:
F for flat,
R for rolling and
M for mountainous.
Seg – segment number,
Procedure
adjustEncr() proceeds by reading in the highway characteristics from shRdSegs,
performing some error checking appropriate to each characteristics and then looking up
the appropriate adjustment factor on shEncrAdj using the adjust() function.
The subroutine has logic to account for the directionality of some of the
adjustments. For example, the grade in the primary direction is used to find the
adjustment in the opposing direction by taking the negative. If the primary grade is +2
percent then the opposing grade must be -2 percent. Similarly, if the total number of
lanes are known and the number of lanes in the primary direction are known the number
of lanes in the opposing direction can be calculated and the appropriate adjustment found.
shRdSegs.Range("A71").Select
Do Until Selection.value = ""
seg = Selection.value
'Work through the encroachments adjustments segment by segment.
spdLim = Selection.offset(0, 4).value column 5
C-52
numLane = Selection.offset(0, 6).value column 7
p_grade = Selection.offset(0, 7).value column 8
p_hcurv = Selection.offset(0, 8).value column 9
'Protect against characters in the field
If LCase(p_hcurv) = "t" Then
p_hcurv = 9999
End If
'Protect against large radii curves
If Abs(p_hcurv > 9999) Then
p_hcurv = (p_hcurv / Abs(p_hcurv)) * 9999
End If
numLanePrim = Selection.offset(0, 9).value column 10
'shldrWidth = Selection.Offset(0, 18).Value column 19
lnwidth = Selection.offset(0, 12).value column 13
access = Selection.offset(0, 13).value column 14
rumble = Selection.offset(0, 14).value column 15
hwyType = shRdSegs.Range("E5").value
terrain = shRdSegs.Range("E6").value
'check to be sure terrain value is legal
If LCase(terrain) = "flat" Or LCase(terrain) = "f" Then
terrain = "F"
ElseIf LCase(terrain) = "mountainous"
Or LCase(terrain) = "m" Then
terrain = "M"
ElseIf LCase(terrain) = "rolling" Or LCase(terrain) = "r" Then
terrain = "R"
Else invalid terrain, set terrain=”F”and notify user
End If
shRdSegs.Range("E6").value = terrain
Col = 2
' Undivided highway data is offset 1
' Divided highway data is offset 2
' One-way highway data is offset 3
' All others return an error
Select Case UCase(hwyType)
Case "U"
Col = 1
Case "D"
C-53
Col = 2
Case "O"
Col = 3
If Not (shRdSegs.Range("E3").value) = 100 Then
‘make sure 100% of volume is in primary direction for one-way
Userchoice tell user RSAP is changine the primary vol to 100
If userchoice = vbOK Then
shRdSegs.Range("E3").value = 100
Else
Exit Sub
End If
End If
Case Else
MsgBox ("Error, illegal highway type")
Exit Sub
End Select
'Primary Direction Grade Adjustment
p_gradeAdj = adjust(shEncrAdj, "AG5", 1, p_grade, debugFlag)
'Primary Direction Horizontal Curve Adjustment
p_hcurvAdj = adjust(shEncrAdj, "AK5", 1, p_hcurv, debugFlag)
'Speed Limit Adjustment
spdLimAdj = adjust(shEncrAdj, "Q5", Col, spdLim, debugFlag)
'Lane Width Adjustment
lnWidthAdj = adjust(shEncrAdj, "U5", Col, lnwidth, debugFlag)
If numLanePrim >= numLane And numLane > 1 Then
MsgBox ("Number of lanes in the primary direction on" & vbCrLf & _
"segment " & CStr(seg) & "cannot be equal to or greater
than the" & vbCrLf & _
"total number of lanes. Dividing lanes " & vbCrLf & _
"equally between directions.")
numLanePrim = numLane / 2
End If
'Number of Lanes Adjustment for primary direction
p_numLaneAdj = adjust(shEncrAdj, "M5", Col, numLanePrim,
debugFlag)
' find the adjustments for the opposing directions but only if
not a one-way highway
C-54
If Not (hwyType = "O") Then
'Number of Lanes Adjustment for opposing direction
o_numLaneAdj = adjust(shEncrAdj, "M5", Col, (numLane –
numLanePrim), debugFlag)
'Opposing Direction Grade Adjustment
o_gradeAdj = adjust(shEncrAdj, "AG5", 1, -p_grade, debugFlag)
'Opposing Direction Horizontal Curve Adjustment
o_hcurvAdj = adjust(shEncrAdj, "AK5", 1, -p_hcurv, debugFlag)
Else
o_numLaneAdj = 0#
o_gradeAdj = 0#
o_hcurvAdj = 0#
End If
'Shoulder Width Adjustment
'shldrWidthAdj = adjust(shEncrAdj, "Y5", col, shldrWidth,
debugFlag)
'Access Density Adjustment
accessAdj = adjust(shEncrAdj, "E5", Col, access, debugFlag)
'Rumble Strip Adjustment
shEncrAdj.Select
Range("I5").Select
Do Until Selection.value = rumble
Selection.offset(1, 0).Select
Loop
rumbleAdj = Selection.offset(0, Col)
If debugFlag = True Then
MsgBox ("For " & CStr(rumble) & ", adjustment is = " &
CStr(rumbleAdj) & ".")
End If
'Terrain Adjustment
shEncrAdj.Select
Range("AC5").Select
Do Until Selection.value = terrain
Selection.offset(1, 0).Select
Loop
terrainAdj = Selection.offset(0, 1)
C-55
If debugFlag = True Then
MsgBox ("For " & CStr(terrain) & ", adjustment is = " &
CStr(terrainAdj) & ".")
End If
'Write the adjustments back on shRdChar
shRdSegs.Select
shRdSegs.Unprotect (shPrgData.Range("B6").value)
Range("A71").Select
Selection.offset(seg - 1, 0).Select
Selection.offset(-30, 1).value = p_gradeAdj
Selection.offset(-30, 2).value = p_hcurvAdj
Selection.offset(-30, 3).value = p_numLaneAdj
Selection.offset(-30, 4).value = o_gradeAdj
Selection.offset(-30, 5).value = o_hcurvAdj
Selection.offset(-30, 6).value = o_numLaneAdj
Selection.offset(-30, 7).value = spdLimAdj
Selection.offset(-30, 8).value = lnWidthAdj
'Selection.Offset(0, 30).Value = shldrWidthAdj
Selection.offset(-30, 9).value = accessAdj
Selection.offset(-30, 10).value = rumbleAdj
Selection.offset(-30, 11).value = terrainAdj
Selection.offset(-30, 12).value = shRdSegs.Range("E8").value
'increment for the next row
Selection.offset(1, 0).Select
Loop
calcBaseEncr()
The road characteristics will have been previously written into
shRdSegs.Range(A71:P90) by the segChars subroutine so this subroutine starts by
selecting cell A71, the top-left cell of the road characteristics table.
Procedure
The procedure is to read in the start and end station for each segment, its ADT
and the highway type and call the adjust() function to find the appropriate base
encroachment frequency in the Base Encroachment Frequency lookup table on
shEncrAdj.
shRdSegs.Range(A71).select
do until selection.value=”” ‘the segment number is in col A
segment=selection.value
C-56
startSta=selection.offset(0,1).value
endStat=selecton.ofset(0,2).value
segmentLength=endSta-startSta
if segmentLength is blank or negative then
Display error message and exit
Else
ADT=selection.offset(0,3).value
hwyType=range(E5).value
Select Case hwyType
Case “U” Col=1
Case “D” Col=2
Case “O” Col=3
Case Else
Invalid highway type Exitt
End select
baseEncr=adjust(shEncrAdj, “A5”, Col, ADT, FALSE)
‘this calls the adjust function which looks up the appropriate base
‘encroachment rate from the look up table on shEncrAdj
baseEncr=baseEncr*segmentLength/5280
‘the lookup table value is in units of encr/mi/yr so this adjusts the
‘rate based on the actual segment length.
Write baseEncr in column 5
End if
Loop ‘ proceed to the next segment until there are no segments left
segChars()
This subroutine is activated by pressing the “Segment project” button on the
“Highway” tab of the RSAP controls dialog. Prior to calling this subroutine the style of
the input area (i.e., shRdSegs.Range(A98:B587)) is changed to “Normal 2” to prevent
further use input and the Road Characteristics Table (i.e., shRdSegs.Range(B71:C90,
G71:V90)) is cleared to prepare it for new data. The macro sortRoadChars() is then called
to sort the characteristics into homogeneous segments and then this macro is called.
sortRoadChars()
This subroutine is activated by pressing the “Segment project” button on the
“Highway” tab of the RSAP controls dialog. Prior to calling this subroutine the style of
the input area (i.e., shRdSegs.Range(A98:B587)) is changed to “Normal 2” to prevent
further use input and the Road Characteristics Table (i.e., shRdSegs.Range(B71:C90,
G71:V90)) is cleared to prepare it for new data.
Procedure
The purpose of the macro is to sort the characteristics of the roadway into order of
increasing station number in the primary direction. The sort first sorts by start station
C-57
and then by end station. This sometimes takes several iterations until the list is
contiguous (i.e., the end station of one segment is the same as the start station of the
next). The macro will split over-lapping characteristic definitions and fill-in missing
segments. If any row has a start station that is greater than the end station the row is
deleted and the user is notified. Negative stations are allowed.
If shRdSegs.range(A98) is blank then
Notify the user there are not segment characteristics
Exit the sub
Else
Do Until the Begin Station value is blank
If End Station <= Begin Station then
Notify the user. Ask if this row should be deleted
If User says “NO” then
Exit Sub
Else
Copy the range from the next row to the last
Paste the copied range over the active row
Increment the row
End if
Loop
allOK=FALSE ‘allOK is a flag indicating a problem has been found
CheckNo =0 ‘checkNo is an interation counter
maxChecks=10 ‘maxChecks is the maximum no. of iterations
Do While allOK=FALSE and CheckNo<maxChecks
Sort shRdSegs.Range(A98:D587) by Begin Station and End Station
If Begin and End stations of this row are the same as the next then
The characteristics are on the same segment
Else if Begin Stations are the same but the Ends are different then
Copy the longer segment and add a row
Set the End Station of the first row to the smaller value
Set the Begin station of the 2nd row to the end station of 1st
Else if 1st Begin Sta < the next and next End Sta > 1st Begin Sta
Split segment into two rows and adjust the begin and end
End if
Increment the row
Loop
‘Check to be sure all segments are contiguous
allOK=TRUE
Do Until Begin Sta is blank
C-58
If current Begin Sta > current End Sta then
allOK=FALSE
End if
if current Begin Sta > next Begin Sta then
allOk=FALSE
end if
if current and next Begin Sta are same but Ends are not then
allOK=FALSE
End if
Increment row
Loop
Seg=1 ‘stating segment is 1
Do Until Begin Sta is blank or number of segments >20
If begin and end stations of current and next row are same then
Write seg into row E
Else
Seg=seg+1
End if
CRASH PREDICTION MODULE
INTRODUCTION
This macro computes the probability of a collision, given that a vehicle has
encroached onto the roadside or median in order to accomplish the following portion of
the main RSAP governing equation:
|
1
∩
|
This is accomplished by directly projecting encroachments from the reconstructed
trajectory paths in the NCHRP 17-22 crash database onto the roadside or median and
looking for intersections between the trajectories and hazard locations. This approach
uses crash data directly to determine probability of impact and probable impact
conditions (e.g., speed, angle, orientation, etc.) and is thus a deterministic method (i.e.,
given the same input it will always provide the same result). Each trajectory path in the
database is examined point-by-point to determine if it intersects the location of a hazard.
RSAP then computes the probability of impact based on the ratio of total number of
impacts divided by total number of trajectory paths.
C-59
MODULE POCMAIN
ModulePOCmain is the Probability of Collision module and serves as the main
program that controls the program flow for computing probability of collision. The
probability of collision is determined by assessing each reconstructed trajectory path
point-by-point for interaction with each roadside hazard and terrain feature. The flow
chart for this program module is shown in Figure 22. The first step in the calculations is
to read in basic project information including, roadway type, roadway characteristics and
traffic data for each roadway segment.
The second step is to read in the roadside cross-section geometry and the type and
location of each hazard to be analyzed for each set of alternatives. This task is performed
in Module POChaz.
The third step is to select relevant trajectories from the crash reconstruction
database in RSAPv3. This task is performed in Module POCtraj. The database is
searched to identify crash cases that have roadway and roadside characteristics that most
closely match those of the current analysis case (i.e., for current segment, roadside, and
alternative), then the vehicle trajectories from that subset of crash cases are mapped onto
the roadside and/or median.
The fourth step is to examine each trajectory for a possible interaction (i.e.,
collision) with a modeled hazard. This task is performed in Module POCanalysis. When
examining a trajectory, there are many possible outcomes. For example, a trajectory may
interact with a roadside barrier, then either stop in contact, penetrate, rollover the barrier
or be redirected. The probability of each of these events is then calculated and the
outcome of each of these events is evaluated. Continuing with the same example, if the
vehicle penetrates the barrier, the trajectory is followed further to determine if it interacts
with any other modeled hazards or results in rollover. If the trajectory is redirected, then
redirection paths are evaluated for secondary collision events. After all of the
possibilities have been exhausted, the selected trajectories are incremented forward a
predetermined amount (default value is four feet) along the segment to continue the
analysis. The following sections discuss the steps of the analysis process in more detail.
C-60
Figure 22. Flow Chart for ModulePOCMaine.
C-61
Input Variables
oNum_Hazards: Number of hazards
oHzrd_Type: Hazard type (line, area, point)
oHzrd_Name: Hazard name (e.g., Strong Post Guardrail, Concrete Median
Barrier, etc.)
oHzrd_EFCCR65: EFCCR65 for hazard type
oHzrd_Prcnt_PRV: Percent Penetration/Rollover/Vault for hazard
oHzrd_Prcnt_RR: Percent redirection for hazard: including rollover after
redirection
oHzrd_Capacity: Energy capacity for hazard (ft-lb)
oHzrd_Height: Barrier height (in)
oHzrd_Connection: Identifies LON hazard attached to END TERMINAL
oHx: Longitudinal coordinates of hazard (ft)
oHy: Lateral coordinates of hazard (ft)
oPDG: Vertical grade (percent)
oPDCR: Horizontal curve radius in primary direction
oPSL: Posted speed limit (mph)
DP_inc: Increment of departure points along segment (ft)
SegStart: Longitudinal start point of segment (ft)
SegEnd: Longitudinal end point of segment (ft)
oMedianHW: Median half-width (ft)
hwyType: Highway type (divided, undivided or one-way)
NOS: Total number of segments
Program Variables
Analysis: Flag for conducting analysis for current roadside section
Col_EFCCRi: Column position on worksheet “POC Scratch” for analysis output
count_pene: Number of penetrations
count_RR: Number of rollovers after redirection from a hazard
CSglob: User defined X-section
o CSglob(*,1): y-coordinate
o CSglob(*,2): z-coordinate
o CSglob(*,3): Relative slope
o CSglob(*,4): Baseline probability of rollover as a function of slope
o CSglob(*,5): Probability of rollover adjustment factor for Grade
o CSglob(*,6): Probability of rollover adjustment factor for horizontal curve
CSloc: User defined X-section (y,z) data in local coordinates
d0: Distance from previous trajectory location to Hazard
decel: Deceleration of trajectory path
C-62
EFCCR_RR: Total of all EFCCRs for rollover after collision with hazard
EFCCR_tot: Total of all EFCCRs for each hazard
EFCCRi: Total of all EFCCRs for each trajectory computed for each segment
grid_inc: x-increments for trajectories
HM: Slope of line between hazard coordinates
Hy0: Lateral coordinate of hazard at longitudinal coordinate x
Hy1: Lateral coordinate of hazard at longitudinal coordinate x+1
impact_Count_NTS: Non-traffic-side impacts on each hazard
impact_Count_tot: Total count of all impacts on each hazard
impact_Count_TS: Traffic-side impacts on each hazard
MaxL: Maximum length of vehicle trajectory path
Max_num_traj: Maximum number of possible trajectory paths for the analysis
MaxX: Maximum x-coord value for vehicle trajectory
MinY: Minimum y-coord value for vehicle trajectory
NCgrade: Number of columns of data in the “Slope-Grade Adjustment” table
NChorcuv: Number of columns of data in the “Slope-Horizontal Curvature (1/R)
Adjustment” table
NCslope: Number of columns of data in the “Rollover Probability” table
nopc: Number of data points used in defining trajectory paths
NRgrade: Number of rows of data in the “Slope-Grade Adjustment” table
NRhorcurv: Number of rows of data in the “Slope-Horizontal Curvature (1/R)
Adjustment” table
NRslope: Number of rows of data in the “Rollover Probability” table
num_Departure_Incs: Total number of departure points for a given segment
num_Dir: Number of directions (e.g., Primary and/or Opposing) for each
segment
num_LDS: Number of lane departure sides (e.g., left and/or right) for each
direction
num_pre: Number of data columns preceding the trajectory path information in
the trajectory databases
num_traj: Number of trajectories evaluated at each increment for the current
roadside segment
num_traj_seg: Current trajectory path number being analyzed on segment
num_traj_tot: Total number of trajectories evaluated for the current roadside
segment
num_traj5: Number of trajectory cases used in analysis
num_veh: Total number of vehicle types for analysis
PHIgrade: Table of Adjustment factors for rollover based on vertical grade
C-63
PHIhorcurv: Table of Adjustment factors for rollover based on horizontal
curvature
POC: Probability of occurrence used as a weight factor for collision costs
PRslope: Table of baseline probability for rollover
R: Radius of point hazards
SegLength: Length of segment
SegRow: Row number for input of segment data on worksheet “Road Segements”
Shift: For use in identifying column position on worksheet “Cross-Section” for
input of roadside cross-section data
Row: Row number for output to worksheet “POC Scratch”
TrajectoryGrid: Name of trajectory-grid sheet for current vehicle type
trajx: Vehicle trajectory path x-coord data (Trajectory Grid)
trajy: Vehicle trajectory path y-coord data (Trajectory Grid)
v0: Trajectory velocity data (Velocity Grid)
VehCharac: Vehicle characteristics
X0: Longitudinal coordinate of current encroachment location
Ymax: Maximum lateral coordinate for roadside cross-section in local coordinate
frame
C-64
Traffic Information
The traffic mix for the roadway segment and the vehicle characteristics (e.g.,
mass, dimensions, etc.) are read from the RSAPv3 worksheet “Traffic Information”.
Twelve columns of information are read from this sheet and are stored in the array
variable called “VehCharac”, where:
VehCharac(*,1): RSAP Vehicles Types by name (Motorcycles, Passenger
Vehicles, Trucks)
VehCharac(*,2): FHWA Vehicle Class Designation
VehCharac(*,3): Percent of Traffic Mix
VehCharac(*,4): RSAP Vehicle Type Designator (M, C, or T)
VehCharac(*,5): Vehicle weight (lbs)
VehCharac(*,6): Vehicle length (ft)
VehCharac(*,7): Vehicle width (ft)
VehCharac(*,8): Longitudinal distance from front of vehicle to center of gravity
(ft)
VehCharac(*,9): Vertical distance from ground to center of gravity (ft)
VehCharac(*,10): Crash cost adjustment factor
VehCharac(*,11): RSAP worksheet name containing trajectory information
VehCharac(*,12): RSAP worksheet name containing redirection trajectory
information
Do Until … {all traffic data has been read}
If {vehicle mix is not 0} Then
num_Veh = num_Veh + 1
For j = 1 To 12
VehCharac(num_Veh, j) = {data in column j}
Next j
End If
Loop
Define Hazard Information
Information about each of the hazards including hazard name, hazard type and
geometric coordinates are read from the RSAPv3 worksheet called “Alternatives”. The
program calls “ModulePOChaz” to perform this task which returns the following
information:
Number of alternatives (Num_Alt)
Number of hazards associated with each alternative (oNum_Hazards)
Hazard Type (oHzrd_Type)
Hazard name (oHzrd_Name)
General Type of Hazard (oHzrd_GenType)
The EFCCR65 for the hazard (oHzrd_EFCCR65)
C-65
The percent penetration/rollover/vault for the hazard (oHzrd_Prcnt_PRV)
derived from crash data
The percent rollovers after redirection from the hazard (oHzrd_Prcnt_RR)
derived from crash data
The structural capacity of the hazard (oHzrd_Capacity) in units of ft-lb
The height of the hazard (oHzrd_Height) for longitudinal barriers
The longitudinal barrier that an end-terminal is attached to (oHzrd_Connection)
The longitudinal coordinate of the nearest upstream point of the hazard (oHx)
The lateral coordinate of the nearest upstream point of the hazard (oHy)
The slope of the line defining line-hazards (HM)
Radius of point hazards (R)
Lookup Tables for Probability of Terrain Rollover
The probability of rollover is computed in RSAPv3 based on sideslope, horizontal
curve radius, and highway grade. The data which RSAPv3
Table 1. Lookup
uses for computing the probability of rollover were adopted
Table
for probability
from the NCHRP 17-11 study conducted by Bligh, Miaou and
of
rollover
as a
Mak [Bligh04] and from the FHWA supplement to the
function of roadside
Roadside Design Guide [FHWA91]. More detail on the
slope.
development of the rollover model is discussed in the
ENGINEER’S MANUAL.
There are currently three lookup tables in RSAPv3 related to
the probability of rollover on terrain slopes. These tables are
listed on the “Encr Freq and Adj” worksheet under the
headings “Rollover Prob.”, “Slope-Grade Adjustment”, and
“Slope-Horizontal Curvature (1/R) Adjustment”, as shown in
Table 1, Table 2 and Table 3, respectively.
C-66
Table 1 provides the baseline probability of rollover for straight, level roadways
with speed limit of 50 mph and constant roadside slopes. The left column in the table is
the roadside slope and the right column is the corresponding probability of rollover. The
program reads this table by calling the subroutine “subRollInput”.
Call subRollInput(PRslope, NRslope, NCslope, "Rollover Prob.")
The input to subroutine subRollInput is simply the name of the table heading
under which the data is found in worksheet “Encr Freq and Adj”. The subroutine then
searches the table headings in worksheet “Encr Freq and Adj” for the name “Rollover
Prob.” It then determines how many columns of data are in the table (e.g., there are two
columns of data in Table 1). The data in the table is read one row at a time until a blank
row is found. The data that is read from the worksheet is stored in the variable array
name “PRslope” which is passed back to the main program. The routine is programed
this way to facilitate changes and updates to the probability of rollover data, which can be
made directly to the worksheet without any modifications needed in the program. For
example, not only can the values in the table be easily changed, but also the number of
rows and columns of data can be easily expanded or reduced as well. It is important that
that the names of these table headings are not changed, however, since the program uses
these names to identify the appropriate table on the worksheet.
Table 2. Adjustment Factor Lookup Table for probability of rollover as a function
of roadside slope and vertical grade.
C-67
Table 3. Adjustment Factor Lookup Table for probability of rollover as a function
of roadside slope and horizontal curve radius.
The program reads the adjustment factor tables for vertical grade and horizontal
curve using the same procedure that was used to read the table of baseline probability for
rollover discussed above. The name of the table headings for the vertical grade
adjustment factors and the horizontal curve adjustment factors are named “Slope-Grade
Adjustment” and “Slope-Horizontal Curvature (1/R) Adjustment”, respectively. The
routine “subRollInput” is used to locate and read in the adjustment factor tables which
will be used later in the analysis. As mentioned previously, the adjustment table data can
be readily modified to include or reduce the number of rows and columns of data without
requiring any modifications to the program; however, it is important that that the names
of these table headings are not changed, since the program uses these names to identify
the appropriate table on the worksheet.
Call subRollInput(PHIgrade, NRgrade, NCgrade, "Slope-Grade Adjustment")
Call subRollInput(PHIhorcurv, NRhorcurv, NChorcurv, "Slope-Horizontal Curvature
(1/R) Adjustment”)
C-68
Segment Characteristics and Analysis Settings
This section of the program (1)
reads in starting and ending
coordinates for each segment in the
project and (2) reads in various
analysis settings from the RSAPV3
CONTROL FORM including, the
distance between encroachment points
along the roadway segment and the
encroachment sides that are to be
evaluated in the analysis, as illustrated
in Figure 23.
DP_inc = {distance between
encroachment locations (ft) read from
RSAPv3 Control Form}
If {no value is provided for DP_inc}
then {a default value of 4 ft is used}
NOS = {number of segments read
from RSAPv3 worksheet “Road
Segments”}
For iSeg = 1 To NOS
SegStart = {Start station for segment
from RSAPv3 worksheet “Road
Segments”}
SegEnd = {End station for segment
from RSAPv3 worksheet “Road
Segments”}
Figure 23. RSAP Controls Dialog – Analyze
SegLength = SegEnd - SegStart
(Expanded View Showing Settings).
' total length of segment
num_Departure_Incs = {Integer Value of (SegLength / DP_inc)}
The number of directions, the number of departure sides and the median width is
determined based on Highway type. There are three roadway types in RSAPv3: (1)
divided roadway, (2) undivided roadway and (3) one-way roadway, as illustrated in
Figure 24, Figure 25, and Figure 26, respectively.
A divided highway, as shown in Figure 24, has two directions of traffic (Primary
and Opposing), separated by a median, whose width is determined from the RSAPv3
worksheet named “Road Segments”. For each direction of traffic there are two possible
encroachment options (left-side encroachments and right-side encroachments). Right-side
encroachments initiate from the edge-line of the right-most lane of traffic, with respect to
C-69
the direction of traffic, and encroach directly onto the roadside. Likewise, left-side
encroachments initiate from the edge-line of the left-most lane of traffic, with respect to
the direction of traffic, and encroach directly onto the median. The lateral offset for
divided highways is measured with respect to the center-line of the median.
Figure 24. Illustration of encroachment locations for a divided roadway.
An undivided highway, as shown in Figure 25, also has two directions of traffic
(Primary and Opposing); however, there is no separation distance between the opposing
lanes (e.g., median width is zero). For each direction of traffic there are again two
encroachment possibilities, left-side encroachments and right-side encroachments. Rightside encroachments initiate from the edge-line of the right-most lane of traffic, with
respect to the direction of traffic, and encroach directly onto the roadside. Left-side
encroachments initiate from the edge-line of the left-most lane of traffic, with respect to
the direction of traffic, and encroach directly into the opposing traffic lanes. Thus, for
undivided roadways the lateral extent of the vehicle trajectory must exceed the total
width of all opposing lanes before it reaches the left roadside. The lateral offset for
undivided highways is measured with respect to the center-line (yellow line) separating
the two traffic directions. While left encroachments depart from the centerline of the
highway there is no provision in RSAPv3 for examining the probability that the vehicle
will strike a vehicle in the opposing direction.
C-70
Figure 25. Illustration of encroachment locations for an undivided roadway.
A one-way roadway, as shown in Figure 26, has only one direction of traffic (i.e.,
primary) and two encroachment locations, left-side encroachments and right-side
encroachments. Right-side encroachments initiate from the edge-line of the right-most
lane of traffic and encroach directly onto the right-roadside. Left-side encroachments
initiate from the edge-line of the left-most lane of traffic and encroach directly into the
left-roadside. The lateral offset for one-way roads is measured with respect to the left
edge-line of the roadway.
Figure 26. Illustration of encroachment locations for a one-way roadway.
C-71
The maximum number of roadside encroachments for each segment is defined in
the program via the following procedure:
Divided Roadway
For iSeg = 1 To NOS
If {roadway type} = "D" Then
num_LDS = 2
num_Dir = 2
oMedianHW = shRdSegs.Cells(SegRow, "K").value / 2
Undivided Roadway
ElseIf {roadway type} = "U" Then
num_LDS = 2
num_Dir = 2
oMedianHW = 0
One-Way Roadway
Else
num_LDS = 2
num_Dir = 1
oMedianHW = 0
End If
The next step in the analysis is to determine which encroachments (e.g., PrimaryRight, Primary Left, etc.) to evaluate based on user-selection information from the
RSAPv3 Control Form.
In some cases, only certain roadsides will be of interest in an analysis. For
example, a highway engineer may want to know the best alternative for a median along a
specific section of a divided highway where the roadside in both the primary and
opposing directions are to remain unchanged. For each new roadway segment and traffic
direction, the program will read from the RSAPv3 Control Form to determine which
roadsides to analyze (refer to Figure 23Error! Reference source not found.). In the
following lines of the program, iDir = 1 corresponds to the primary direction of traffic
and iDir = -1 represents opposing traffic direction. Likewise, iLDS = 1 corresponds to
right side encroachments and iLDS = -1 corresponds to left-side encroachments.
For iSeg = 1 To NOS
For iDir = 1 To 2 Step -2
For iLDS = 1 To 2 Step -2
Primary-Right Encroachments
If iDir = 1 And iLDS = 1 Then
C-72
If {check-box for primary-right} = False Then {skip analysis}
Primary-Left Encroachments
ElseIf iDir = 1 And iLDS = -1 Then
If {check-box for primary-left = False} Then {skip analysis}
Opposing-Right Encroachments
ElseIf iDir = -1 And iLDS = 1 Then
If {check-box for opposing-right} = False Then {skip analysis}
Opposing-Left Encroachments
ElseIf iDir = -1 And iLDS = -1 Then
If {check-box for opposing-left = False} Then {skip analysis}
Else … {Continue with analysis for the current encroachment side}
End If
Define Roadway and Roadside Characteristics
For each alternative, the program (1) reads in specific roadway characteristics:
posted speed limit, highway grade and horizontal curve radius, (2) reads in the roadside
cross-section geometry corresponding to the roadside or median at the current
encroachment location, (3) and then converts the cross-section coordinates from the
global coordinate reference frame to a local coordinate system relative to the
encroachment point. The information processed in this section of the program is used
primarily for selecting trajectories for the analysis, which will be discussed in a later
section.
Determine Posted Speed Limit, Roadway Grade and Horizontal Curve Radius
Three roadway characteristics, i.e., posted speed limit, roadway vertical grade,
and horizontal curve radius, are read from worksheet “Road Segments.” These
characteristics will be used later in the trajectory selection process. The values for vertical
grade and horizontal curve radius are defined with respect to the primary direction of
traffic and must be redefined to correspond to the current encroachment conditions. For
example, a positive value for highway grade defined in the worksheet “Road Segments”
corresponds to an “up-hill” grade for vehicles traveling in the primary traffic direction
and, consequently, to a “down-hill” grade for vehicles traveling in the opposing traffic
direction. So, when evaluating encroachments in the opposing traffic direction, the sign
of the vertical grade from the worksheet must be reversed for the analysis.
Similarly, a positive value for horizontal curve radius as defined in worksheet
“Road Segments” corresponds to a roadway curving to the right for traffic moving in the
Primary traffic direction. Thus, when a vehicle traveling in the primary direction
encroaches to the right, the road curves back toward the encroachment path as the vehicle
advances. Such encroachments tend to remain relatively close to the roadway. On the
other hand, when a vehicle traveling in the primary direction encroaches to the left, the
roadway curves away from the encroachment path. These encroachments tend to extend
farther and farther from the roadway as the trajectory advances. Similar situations exist
C-73
for vehicles traveling in the opposing direction. The following lines of code read in
values for the roadway characteristics from the worksheet “Road Segments” and redefine
them according to the current encroachment conditions.
oPSL = {posted speed limit read from worksheet “Road Segments”}
oPDG = {vertical grade}* iDir
oPDCR = {horizontal curve radius}* iDir * iLDS
Roadside Cross-Section Geometry for Use in Trajectory Selection
The trajectory cases in the crash reconstruction database are all normalized to
correspond to primary-right departures. That is, the cross-section coordinates in the crash
reconstruction database are based on a local reference frame relative to the departure
point which starts at lateral offset y=0 and extends from that point with lateral coordinate
values increasing monotonically.
An important criterion used in the selection of trajectories for the analysis is based
on a point to point comparison of the roadside cross-section profile to those in the crash
reconstruction database. Therefore, the roadside cross-section coordinates for the current
encroachment location must be converted to the local reference frame of the crash cases
in the database to enable a direct comparison of the cross-section profiles.
For example, consider a primary-left encroachment onto a median with crosssection defined by the coordinates listed in Figure 27. In order to compare the median
cross-section to those in the database, the median cross-section profile must be
transformed from global coordinates (e.g., as shown in the upper table in Figure 27) to
the local coordinate reference frame (e.g., as shown in the lower table in Figure 27).
Figure 27. Illustration of transforming the median cross-section coordinates from
the global reference frame to the local reference frame.
C-74
The following section of the program performs the task of reading the roadside
cross-section coordinates corresponding to the current encroachment location and
converting them from global coordinates to the local reference frame of the trajectory
database.
For iSeg = 1 To NOS
For iDir = 1 To 2 Step -2
For iLDS = 1 To 2 Step -2
For iAlt = 1 To num_Alts
The following lines of code define the location (i.e., starting row and column
position) of the cross-section data on the RSAPv3 worksheet named “Profile”
corresponding the current roadside encroachment location (e.g., PR, PL, OR, or OL) and
reads in the cross-section coordinates.
SegOffset = {row position on worksheet “Alternative”}
AltOffset = {column offset on worksheet “Alternative” based on
alternative num}
Shift = {column offset on worksheet “Alternative” based on encroachment
side}
For i = 1 To 8
If {data exists in cell (iSeg, Altoffset+shift+2(i-1))} <> "" Then
iXsect = iXsect + 1 ‘ count number of x-section data points
CSloc(iXsect, 1) = {lateral coordinate of X-section}
CSloc(iXsect, 2) = {vertical coordinate of X-section}
End If
Next i
The next step is to transform the cross-section coordinates from the global to local
coordinates. This task is generally carried out via the coordinate transformation matrix;
however, since the angle between the global and local reference frames will always be
either 0 or 180 degrees, the task can also be achieved by simply resorting the data in
descending order for Primary-Left and Opposing-Right encroachments (i.e., iDir * iLDS
= -1). It is also necessary to resort the data for Primary-Right and Opposing-Left
encroachments (i.e., iDir * iLDS = 1) in order to guard against data being input out of
order and to eliminate any data with “null” values. For example, the worksheet provides
the option of using up to eight data points to define a cross-section profile. In most cases,
however, only a few data points will be necessary to completely define the roadside, in
which case many of the data cells in the worksheet will have no data.
If iDir * iLDS = 1 Then
Call MatrixSort {and sort cross-section coordinates in ascending
order with respect to local reference frame}
If iDir * iLDS = -1 Then
C-75
Call MatrixSort {and sort cross-section coordinates in descending
order with respect to local reference frame}
The next step is to determine starting lateral coordinate for roadside cross-section
corresponding to the edge of the roadway at the point of encroachment. This point
(CSy0, 0) represents the origin for the local coordinate system of the roadside crosssection.
oRoadWPR = {Primary road width read from worksheet “Road
Segments”}
oRoadWOP = {Opposing road width read from worksheet “Road
Segments”}
If hwyType = {Divided}
If {Encroachment Side = Primary Right} Then
CSy0 = (oMedianHW + oRoadWPR) * iDir
If {Encroachment Side = Opposing Right} Then
CSy0 = (oMedianHW + oRoadWOP) * iDir
If {Encroachment Side = Primary or Opposing Left} Then
CSy0 = (oMedianHW) * iDir *
ElseIf hwyType = {Undivided} Then
If {Encroachment Isde = Primary or Opposing Right} Then
CSy0 = oRoadWPR * iDir
If {Encroachment Side = Primary Left} Then
CSy0 = oRoadWOP * iDir
If {Encroachment Side = Opposing Left} Then
CSy0 = oRoadWPR * iDir
ElseIf hwyType = {One-Way} Then
If {Encroachment Side = Primary Right} Then
CSy0 = oRoadWPR * iDir
If {Encroachment Side = Primary Left} Then
CSy0 = 0
End If
The final steps are to translate the cross-section coordinates so that it starts at the
local origin and to calculate the vertical slope between each cross-section break point.
Note that the vertical slope CSloc(i,3) is only used for resampling the cross-section data
in ModulePOCtraj so that a point-to-point comparison can be made with crash cases in
the crash reconstruction database when selecting trajectories for the analysis.
For i = 1 To iXsect
If CSloc(i, 1) <> "" Then
CSloc(i, 1) = CSloc(i, 1) * iLDS * iDir - CSy0 * iDir
‘ --- compute slope values --C-76
If i = 1 Then
CSloc(1, 3) = 0
Else
CSloc(i, 3) = {vertical slope}
End If
End If
Next i
ymax = {maximum lateral extent of the cross-section data}
Global Cross-Section Geometry and Corresponding Baseline Probability of Rollover
The following lines of code read in and process the complete cross-section profile
of the current roadway segment and terrain alternative, including all roadsides, roadways
and road shoulders; and then uses this information to determine the baseline probability
of rollover corresponding as a function of slope, vertical grade and horizontal curve
radius. This information is later used in the probability-of-collision analysis. In
particular, each trajectory path is monitored at every increment during the analysis and its
position is continuously cross-checked against the terrain profile to determine the
probability of rollover.
Determine Cross-Section Coordinates and Slope
The first step of this task is to read in all roadside cross-section coordinates from
the RSAPv3 worksheet named “Profiles” and store them in the array variable “CSglob”.
For i = 1 To 8 * 3 'eight columns of data for each possible roadside
(primary
roadside, opposing roadside and median)
CSglob(countX, 1) = {y-coord of X-section}
CSglob(countX, 2) = {z-coord of X-section}
Next i
The next step is to sort all the coordinates in ascending order with respect to the
lateral offset coordinate values in order to guard against data being input out of order and
to eliminate any data with “null” values. The slope between each breakpoint is then
computed and stored as part of the CSglob array for quick access during the analysis.
Call ModulePOCtraj.MatrixSort(CSglob, countX, "ascend", 3, 1)
The “apparent” direction of the slope (i.e., up-hill or down-hill slope) is
dependent on approach path of the vehicle. For example, Figure 28 shows a median
cross-section with a vehicle encroaching from the left. In this scenario the vehicle would
be going down-hill on the left slope and up-hill on the right slope; thus the slope of the
terrain is effectively negative on the left and positive on the right for this encroachment
condition. On the other hand, when a vehicle encroaches onto the median from the right
side, the vehicle would be going down-hill on the right slope and up-hill on the left slope;
in which case, the slope of the terrain would effectively be negative on the right and
positive on the left.
C-77
Figure 28. Illustration of “apparent” sign of roadside slope relative to
encroachment path of vehicle.
The next step is to define the lateral coordinate of the encroachment point (i.e.,
y0) for the current trajectory path in the global reference frame. Recall that for divided
roadways the origin of the global coordinate system is the center of the median; for
undivided roadways the global origin is at center of the yellow line(s) separating the
opposing traffic lanes; and for one-way roadways the origin is at the left edge of the
roadway. The following lines of code define the lateral coordinate of the encroachment
point based on departure side (iLDS) and direction (iDir).
If hwyType = {divided} Then
If iLDS = 1 And iDir = 1 Then y0 = (oMedianHW + oRoadWPR) *
iDir
If iLDS = 1 And iDir = -1 Then y0 = (oMedianHW + oRoadWOP) *
iDir
If iLDS = -1 Then y0 = (oMedianHW) * iDir
ElseIf hwyType = {undivided} Or hwyType = {one-way} Then
If iLDS = 1 And iDir = 1 Then y0 = oRoadWPR * iDir
If iLDS = 1 And iDir = -1 Then y0 = oRoadWOP * iDir
If iLDS = -1 Then y0 = 0
C-78
End If
The following lines of code compute the slope between each breakpoint of the
cross-section terrain and determine the sign of the slope based on its location relative to
the encroachment point.
For i = 1 To (number of slope break points)
'CSglob(i, 3) = 1
If CSglob(i, 1) > y0 Then ' negative slopes go downhill as y
increases
CSglob(i, 3) = (CSglob(i, 2) - CSglob(i - 1, 2)) / _
(CSglob(i, 1) - CSglob(i - 1, 1))
Else
' Negative slopes go downhill as y decreases.
If i = 1 Then
' Slope is equal to adjacent slope at extents _
beyond the most negative defined point.
CSglob(i, 3) = (CSglob(i, 2) - CSglob(i + 1, 2)) / _
(CSglob(i + 1, 1) - CSglob(i, 1))
Else
CSglob(i, 3) = (CSglob(i - 1, 2) - CSglob(i, 2)) / _
(CSglob(i, 1) - CSglob(i - 1, 1))
End If
End If
Baseline Probability and Adjustment Factors
The next step is to determine the baseline probability of rollover for each crosssection slope. This task is accomplished using linear interpolation of the “probability of
rollover table”, which was previously stored in array PRslope. The value of the baseline
probability of rollover is then stored in the array CSglob(*,4).
Call subInterpolate()
The adjustment factors for the probability of rollover for vertical grade and
horizontal curve radius is then determined using bi-linear interpolation of the “adjustment
factor tables” (e.g., stored in arrays PHIgrade and PHIhorcurv, respectively). The values
for the vertical grade adjustment factor and the horizontal curve adjustment factor are
stored in array CSglob(*,5) and CSglob(*,6), respectively.
Call subBiInterpolate()
Call subBiInterpolate()
Next i
Select Trajectories for Analysis
The next step in the analysis is to select trajectories that are representative of the
vehicle type and roadway/roadside characteristics. The probability of collision given that
C-79
a vehicle has encroached onto the roadside or median is determined by directly projecting
encroachment trajectories from reconstructed crash cases onto the roadside or median and
evaluating their probability of collision with each roadside hazard. Three databases of
trajectories are stored on RSAPv3 worksheets “TrajectoryGrid1”, “TrajecotryGrid2” and
TrajectoryGrid3, for motorcycle trajectories, passenger vehicle trajectories and truck
trajectories, respectively. Currently, all three trajectory databases are identical, which
assumes that encroachment paths for all vehicle types are of similar form. This of course
is not likely true, but at the present time, there is insufficient data for the development of
accurate trajectory paths for motorcycles and trucks; when such data becomes available,
however, the trajectory database worksheets can be readily updated.
The trajectory data currently included in RSAPv3 corresponds to trajectories
taken from the NCHRP 17-22 crash reconstruction database and are based on
reconstructed crashes involving passenger vehicles. The database is composed of 787 of
the 890 crash cases collected from the FHWA rollover study, NCHRP Project 17-11 and
NCHRP Project 17-22.[Bligh04; Mak10] Since each trajectory case in the 22-27
database is linked directly to its corresponding crash conditions and roadway and
roadside characteristics, it is a simple process to filter the trajectory data directly and
select only the trajectory cases with roadway and roadside characteristics similar to those
for the given project case. This eliminates the need to have multiple layers of trajectory
tables corresponding to numerous roadway and roadside conditions.
Select Trajectory Path Database
The name of the worksheet containing the database of trajectories for each vehicle
type is read from column 11 on the “Traffic Information” worksheet in RSAPv3.
For iVeh = 1 To {number of vehicle types in analysis}
TrajectoryGrid = {name of trajectory worksheet}
Select Relevant Trajectory Paths for the Analysis
RSAPv3 searches the trajectory database to identify relevant cases based on
similarity to the given road-segment characteristics; that is, the program selects all
trajectory cases that have characteristics which fall within a specified range of those
defined for a given segment of roadway. Refer to the ENGINEER’S MANUAL for more
information regarding trajectory selection methodology.
The program calls ModulePOCtraj to gather trajectory information which will be
used in the analysis, such as number of trajectory cases (num_traj), coordinates of the
trajectory path (trajx and trajy), the number of data columns preceding the trajectory path
information (num_pre), the longitudinal increments of the path data (grid-inc), the
minimum and maximum lateral extents of each trajectory path (MinY and MaxY) and the
maximum length of each trajectory path (MaxL).
Call ModulePOCtraj.TrajectorySelect()
Initialize Variables for Collision-Statistics
During the analysis various types of data relevant to the probability of collision
are collected. These data include number of traffic-side impacts on each hazard, number
C-80
of non-traffic side impacts on each hazard, total number of all impacts on each hazard,
total crash cost (EFCCR) for collisions with each hazard, total crash cost associated with
rollovers after redirection with each hazard, number of rollovers after redirection and
number of penetrations of each hazard. These data are stored until the current roadside
encroachment location has been analyzed for the full length of the segment for the current
vehicle type; the variables are then re-initialized for the next vehicle type and for each
encroachment-side location. The following lines of code are used to initialize the
variables for collision statistics:
For K = 1 To {total number of hazards including rollovers}
impact_Count_TS(K) = 0
impact_Count_NTS(K) = 0
impact_Count_tot(K) = 0
EFCCR_tot(K) = 0
EFCCR_RR(K) = 0
count_RR(K) = 0
count_pene_RSAP(K) = 0
Next K
impact_total = 0
Search Selected Trajectory Paths for impact with Hazard(s) and Compute POC
The cost of collision is then determined based on the impact conditions, hazard
severity and probability of the collision event. The program calls ModulePOCanalysis to
perform the collision-analysis task, where each trajectory is individually examined for
possible collisions with hazards; the collision statistics are computed and stored in the
appropriate data collectors; and these data are then returned to the main program (i.e.,
ModulePOCmain) for processing. The programming details of the Probability-ofCollision analysis module will be presented in a subsequent section of this Manual.
The first step in this task is to determine the longitudinal coordinate of the
encroachment point. When the encroachments are being evaluated for the primary traffic
direction, the analysis starts at the beginning of the segment and evaluates each
preselected trajectory path for collisions; then increments forward along the segment by a
predefined increment length (i.e., DP_inc) and again evaluates each trajectory path for
collisions; this process continues until the end of the segment is reached.
For iSeg = 1 To NOS
For iDir = 1 To 2 Step -2
For iLDS = 1 To 2 Step -2
For iAlt = 1 To num_Alts
For iDP = 0 To num_Departure_Incs
If iDir = 1 Then
x0 = iDP * DP_inc * iDir + SegStart
' start at beginning of segment for primary direction
C-81
Else
x0 = iDP * DP_inc * iDir + SegEnd ' start at end of segment for
‘ opposing direction
End If
For itraj = 1 To {number of trajectories}
WF = 1
num_traj_seg = num_traj_seg + 1
nopc = {number of path coordinate points}
' --- initialize EFCCR for this trajectory
EFCCRi(num_traj_seg, 1) = 0
' --- Record Vehicle Type (M, C, or T) for this segment
EFCCRi(num_traj_seg, 2) = VehCharac(iVeh, 4)
' --- Record Alternative number for the segment
EFCCRi(num_traj_seg, 3) = iAlt
Call ModulePOCanalysis.sub_Impact_Search()
Next itraj
Some additional variables are defined in this section of the program, including
POC, num_traj_seg, and EFCCRi. The variable POC represents the probability of
collision and is applied as a weight factor to the crash cost of each collision. As an
example, refer to the sequence of possible crash events illustrated in Figure 29. At the
beginning of each trajectory path (Point A) the probability of occurrence is 1.0. In other
words, each trajectory case is an encroachment event, so there is a 100 percent chance of
an encroachment during the first increment of each trajectory path. As the encroachment
continues, the likelihood of rollover increases. So, the probability of a collision at Point B
is dependent on the vehicle getting to Point B without rolling over first. The crash cost of
an impact at Point B is computed based on impact conditions and the severity rating of
the hazard. Then the average expected cost of the collision is determined by multiplying
the baseline crash cost by its probability of occurrence (POC). Likewise, for the
encroachment to result in a second collision at Point E a sequence of three specific events
must happen: (1) the vehicle must get to Point B without rolling over, (2) the vehicle
must penetrate or vault the line hazard (Point D), and (3) the vehicle must then get to
Point E without rolling over or stopping first. Thus the probability of collision for each
possible collision in the sequence of events continuously reduces with each collision. So
even though the severity rating for the hazard at Point E may be very high, the average
crash-cost on the hazard will be reduced according to the likelihood of the sequence A-BD-E occurring.
C-82
C
A
Line Hazard
B
D
F
E
Point Hazard
Figure 29. Illustration of a possible sequence of crash events for a given trajectory
scenario
The variables num_traj_seg and EFCCRi are used to compute percentile costs for
each segment, where num_traj_seg is a running count of the total number of trajectories
being evaluated for each segment, and EFCCRi is an array variable that stores the
individual crash cost of each trajectory path.
Calculate and Write Average Crash Costs to Worksheet
The following lines of code compute the average crash costs associated with each
hazard at the end of each segment analysis, as well as other collision statistics. For
example, the average crash cost on a particular hazard is computed as the total crash cost
of all collision on that hazard divided by the total number of encroachments. These
values are written to the “POC Scratch” worksheet and are later used for generating the
“Feature Report”, “Segment Report”, and “B/C Report” on the “Results” worksheet in
RSAPv3. An example of the output to the “POC Scratch” worksheet is shown in Table 4.
For iSeg = 1 To NOS
For iDir = 1 To 2 Step -2
For iLDS = 1 To 2 Step -2
For iAlt = 1 To num_Alts
For iVeh = 1 To num_veh
For iDP = 0 To num_Departure_Incs
If iDP = num_Departure_Incs Then
For K = 1 To oNum_Hazards(iAlt) + 1
shPOCscratch.Cells(Row, "A").value = iSeg
shPOCscratch.Cells(Row, "B").value = iAlt
If iDir = 1 Then
shPOCscratch.Cells(Row, "C").value = "P"
Else
C-83
shPOCscratch.Cells(Row, "C").value = "O"
End If
If iLDS = 1 Then
shPOCscratch.Cells(Row, "D").value = "R"
Else
shPOCscratch.Cells(Row, "D").value = "L"
End If
shPOCscratch.Cells(Row, "E").value = VehCharac(iVeh, 4)
shPOCscratch.Cells(Row, "F").value = num_traj_tot
shPOCscratch.Cells(Row, "G").value = oHzrd_Name(iAlt, K)
shPOCscratch.Cells(Row, "H").value = K ‘ hazard number
shPOCscratch.Cells(Row, "I").value = EFCCR_tot(K)
shPOCscratch.Cells(Row, "J").value = impact_Count_TS(K)
shPOCscratch.Cells(Row, "K").value = impact_Count_NTS(K)
If impact_Count_tot(K) <> 0 Then
shPOCscratch.Cells(Row, "L").value = EFCCR_tot(K) / _
impact_Count_tot(K)
End If
shPOCscratch.Cells(Row, "M").value = impact_Count_tot(K) /
_
num_traj_tot
shPOCscratch.Cells(Row, "N").value = EFCCR_tot(K) /
num_traj_tot
If K <= oNum_Hazards(iAlt) Then
shPOCscratch.Cells(Row, "P").value = count_pene(K)
' rollover-after-redirection from hazard k statistics
If count_RR(K) <> 0 Then
shPOCscratch.Cells(Row, "Q").value = count_RR(K)
shPOCscratch.Cells(Row, "R").value = EFCCR_RR(K)
shPOCscratch.Cells(Row, "S").value = EFCCR_RR(K) / _
count_RR(K)
shPOCscratch.Cells(Row, "T").value = count_RR(K) / _
num_traj_tot
shPOCscratch.Cells(Row, "U").value = EFCCR_RR(K) / _
num_traj_tot
End If
C-84
End If
Row = Row + 1
Next K ' next hazard
End If
Next iDP
' next departure point/station
Next iVeh
' next vehicle type
Next iAlt
' next roadside alternative
Next iLDS
' next encroachment side
Next iDir
' next traffic direction
Next iSeg
' next segment
End Sub
C-85
Table 4. Example Output to POC Scratch worksheet
SCRATCH SHEET FOR COLLISION PROBABILITY AND COST
Encroachment Location
Veh
SEG ALT DIR
1
1P
1
1P
1
1P
1
1P
1
1O
1
1O
1
1O
1
1O
1
1P
1
1P
1
1P
1
1P
1
1O
1
1O
1
1O
1
1O
1
1P
1
1P
1
1P
1
1P
1
1O
1
1O
1
1O
1
1O
1
2P
1
2P
1
2P
1
2P
1
2O
1
2O
1
2O
1
2O
1
2P
1
2P
1
2P
1
2P
1
2O
1
2O
1
2O
1
2O
1
2P
SIDE
R
R
L
L
R
R
L
L
R
R
L
L
R
R
L
L
R
R
L
L
R
R
L
L
R
R
L
L
R
R
L
L
R
R
L
L
R
R
L
L
R
Type
T
C
T
C
T
C
T
C
T
C
T
C
T
C
T
C
T
C
T
C
T
C
T
C
T
C
T
C
T
C
T
C
T
C
T
C
T
C
T
C
T
Num of Encroach
10
10
40
40
10
10
40
40
10
10
40
40
10
10
40
40
10
10
40
40
10
10
40
40
10
10
40
40
10
10
40
40
10
10
40
40
10
10
40
40
10
Hazard
Name
EdgeOfMedian
EdgeOfMedian
EdgeOfMedian
EdgeOfMedian
EdgeOfMedian
EdgeOfMedian
EdgeOfMedian
EdgeOfMedian
EdgeOfMedian
EdgeOfMedian
EdgeOfMedian
EdgeOfMedian
EdgeOfMedian
EdgeOfMedian
EdgeOfMedian
EdgeOfMedian
Rollover
Rollover
Rollover
Rollover
Rollover
Rollover
Rollover
Rollover
EdgeOfMedian
EdgeOfMedian
EdgeOfMedian
EdgeOfMedian
EdgeOfMedian
EdgeOfMedian
EdgeOfMedian
EdgeOfMedian
EdgeOfMedian
EdgeOfMedian
EdgeOfMedian
EdgeOfMedian
EdgeOfMedian
EdgeOfMedian
EdgeOfMedian
EdgeOfMedian
TL3FShapeGR
Statistics
Num.
1
1
1
1
1
1
1
1
2
2
2
2
2
2
2
2
3
3
3
3
3
3
3
3
1
1
1
1
1
1
1
1
2
2
2
2
2
2
2
2
3
EFCCR
0.00000
0.00000
1.33781
1.11484
0.00000
0.00000
0.00000
0.00000
0.00000
0.00000
0.00000
0.00000
0.00000
0.00000
1.33781
1.11484
0.00000
0.00000
0.00945
0.00788
0.00000
0.00000
0.00945
0.00788
0.00000
0.00000
1.29183
0.01131
0.00000
0.00000
0.00000
0.00000
0.00000
0.00000
0.00000
0.00000
0.00000
0.00000
1.29183
0.01131
0 00000
Collisions
TS
NTS
0.0000 0.0000
0.0000 0.0000
17.4979 0.0000
17.4979 0.0000
0.0000 0.0000
0.0000 0.0000
0.0000 0.0000
0.0000 0.0000
0.0000 0.0000
0.0000 0.0000
0.0000 0.0000
0.0000 0.0000
0.0000 0.0000
0.0000 0.0000
17.4979 0.0000
17.4979 0.0000
0.0000 0.0000
0.0000 0.0000
0.7805 0.0000
0.7805 0.0000
0.0000 0.0000
0.0000 0.0000
0.7805 0.0000
0.7805 0.0000
0.0000 0.0000
0.0000 0.0000
15.7967 0.0000
0.1433 0.0000
0.0000 0.0000
0.0000 0.0000
0.0000 0.0000
0.0000 0.0000
0.0000 0.0000
0.0000 0.0000
0.0000 0.0000
0.0000 0.0000
0.0000 0.0000
0.0000 0.0000
15.7967 0.0000
0.1433 0.0000
0 0000 0 0000
EFCCR/C
0.0765
0.0637
0.0765
0.0637
0.0121
0.0101
0.0121
0.0101
0.0818
0.0789
0.0818
0.0789
C/E
EFCCR/E
0.00000
0.00000
0.43745
0.43745
0.00000
0.00000
0.00000
0.00000
0.00000
0.00000
0.00000
0.00000
0.00000
0.00000
0.43745
0.43745
0.00000
0.00000
0.01951
0.01951
0.00000
0.00000
0.01951
0.01951
0.00000
0.00000
0.39492
0.00358
0.00000
0.00000
0.00000
0.00000
0.00000
0.00000
0.00000
0.00000
0.00000
0.00000
0.39492
0.00358
0 00000
0.00000
0.00000
0.03345
0.02787
0.00000
0.00000
0.00000
0.00000
0.0000000
0.00000
0.0000000
0.00000
0.00000
0.00000
0.03345
0.02787
0.00000
0.00000
0.00024
0.00020
0.00000
0.00000
0.00024
0.00020
0.00000
0.00000
0.03230
0.00028
0.0000000
0.00000
0.00000
0.00000
0.00000
0.0000000
0.00000
0.00000
0.00000
0.00000
0.0322958
0.00028
0 00000
C-86
# of Penetrations
capacity
0.0000
0.0000
0.0000
0.0000
0.0000
0.0000
0.0000
0.0000
0.0000
0.0000
0.0000
0.0000
0.0000
0.0000
0.0000
0.0000
0.0000
0.0000
0.0000
0.0000
0.0000
0.0000
0.0000
0.0000
0.0000
0.0000
0.0000
0.0000
0.0000
0.0000
0.0000
0.0000
0 0000
RSAP # of rollovers 0.0000
0.0000
17.4979
17.4979
0.0000
0.0000
0.0000
0.0000
0.0000
0.0000
0.0000
0.0000
0.0000
0.0000
17.4979
17.4979
0.0000
0.0000
15.7967
0.1433
0.0000
0.0000
0.0000
0.0000
0.0000
0.0000
0.0000
0.0000
0.0000
0.0000
15.7967
0.1433
0 0000
Rollover after Redirection EFCCR
EFCCR/C
C/E
EFCCR/E
MODULEPOCHAZ
This module is called by ModulePOCmain to gather information about each
hazard and then processes the hazard data so that it can be readily accessed during the
analysis. The program (1) reads hazard information from worksheet “Alternatives”, such
as hazard type and location; (2) searches for the hazard type on worksheet “Severity” to
gather data necessary for the analysis, such as severity, capacity, repair cost, etc.; (3)
defines the longitudinal barrier associated with each end-terminal; and (4) stores the data
in arrays for ready-access during the analysis. The flow chart for this program module is
shown in Figure 30.
C-87
Figure 30. Flow chart for ModulePOChaz.
C-88
Program Variables
max_num_haz: maximum number of hazards for any alternative
num_ALTS: number of alternatives in the analysis
HM: slope of line segment connecting hazard ends
HazRow: Current row number with hazard information on worksheet
“Alternatives”
AltOffset: Current column number with hazard information on worksheet
“Alternatives”
R: Radius of Point hazards (inches)
oHx:
oHy:
oHzrd_Capacity:
oHzrd_Connection: Identifies LON hazard attached to END TERMINAL
oHzrd_EFCCR45:
oHzrd_Height:
oHzrd_GenType:
oHzrd_Prcnt_PRV:
oHzrd_Prcnt_RR:
oHzrd_Type:
oNum_Hazards:
Procedure
The number of alternatives is read directly from the RSAPv3 worksheet
“Alternatives” and the maximum array size for the hazard variables is based on the
maximum number of hazards for any alternative case. The total number of hazards also
includes the area hazard “rollover” which is automatically added to the hazard list for
each alternative case. This increases the number of columns in the array size by one.
num_ALTS = (read number of alternatives from Alternatives worksheet)
max_num_haz = (number of hazards in the alternative with the most hazards)
ReDim oNum_Hazards(num_ALTS)
ReDim oHzrd_Type(num_ALTS, max_num_haz + 1)
ReDim oHzrd_Name(num_ALTS, max_num_haz + 1)
ReDim oHzrd_GenType(num_ALTS, max_num_haz + 1)
ReDim oHzrd_EFCCR45(num_ALTS, max_num_haz + 1)
ReDim oHzrd_Prcnt_PRV(num_ALTS, max_num_haz + 1)
ReDim oHzrd_Prcnt_RR(num_ALTS, max_num_haz + 1)
ReDim oHzrd_Capacity(num_ALTS, max_num_haz + 1)
ReDim oHzrd_Height(num_ALTS, max_num_haz + 1)
C-89
ReDim oHzrd_Connection(num_ALTS, max_num_haz + 1)
ReDim oHx(num_ALTS, max_num_haz + 1, 2)
ReDim oHy(num_ALTS, max_num_haz + 1, 3)
ReDim HM(num_ALTS, max_num_haz + 1)
ReDim R(num_ALTS, max_num_haz + 1)
The hazard information on worksheet “Alternatives” is then read for each
alternative case. The first step is to determine which side (i.e., left or right) of the baseline
the hazard is located (i.e., “Start Side” and “End Side” on worksheet “Alternatives”).
HazRow = 10 ' starting row for hazard data on worksheet "Alternatives"
For iAlt = 1 To {number of alternatives}
AltOffset = iAlt * 11
oNum_Hazards(iAlt) = {read number of hazards from worksheet
“Alternatives”}
For K = 1 To oNum_Hazards(iAlt) + 1
' find out which side of the baseline the hazard is on
If (“Start Side”) = "L" Then
sideStart = -1
Else
sideStart = 1
End If
If (“End Side”) = "L" Then
sideEnd = -1
Else
sideEnd = 1
End If
The next step is to determine the type and name of each hazard in each
alternative. This information is read directly from the worksheet “Alternatives” except for
rollover hazards, which are defined explicitly in the program.
If K > oNum_Hazards(iAlt) Then
oHzrd_Name(iAlt, K) = "Rollover"
Else
oHzrd_GenType(iAlt, K) = {read general hazard type}
oHzrd_Name(iAlt, K) = {read hazard name}
End If
The repair cost, severity, penetration-rollover-vault statistics, redirection-afterrollover statistics, capacity, height, and category are then read from the worksheet
C-90
“Severity. RSAPv3 searches each row of the “Severity” worksheet until it finds the
corresponding hazard, then reads the pertinent information.
m = 4 ‘ Starting row with data in the “Severity” worksheet
Do Until shSeverity.Cells(m, 1).value = oHzrd_Name(iAlt, K)
m=m+1
Loop
oHzrd_Type(iAlt, K) = {read hazard type}
oHzrd_EFCCR65(iAlt, K) = {read hazard severity EFCCR65}
oHzrd_Prcnt_PRV(iAlt, K) = {read percent of PRV}
oHzrd_Prcnt_RR(iAlt, K) = {read percent rollover after redirection}
oHzrd_Capacity(iAlt, K) = {read hazard capacity}
oHzrd_Height(iAlt, K) = {read hazard height}
The next step is to determine the location of the hazard. If the hazard is a line
hazard then the program reads the start- and end-coordinates of the hazard from
worksheet “Alternatives”; computes the slope between the two points; and reads in the
width of the hazard from worksheet “Alternatives”. A sketch of a line hazard with
dimensions is illustrated in Figure 31.
Line Hazard
Width
(oHx2, oHy2)
HM: slope
(oHx1, oHy1)
Figure 31. Sketch of line-hazard dimensions.
If oHzrd_Type(iAlt, K) = "L" Then
oHx(iAlt, K, 1) = {read longitudinal coordinate, oHx1}
oHy(iAlt, K, 1) = {read lateral coordinate, oHy1}* sideStart
oHx(iAlt, K, 2) = {read longitudinal coordinate, oHx2}
oHy(iAlt, K, 2) = {read lateral coordinate, oHy2} * sideEnd
oHy(iAlt, K, 3) = {read hazard width} / 12 ' convert to feet from inches
'
--- Compute slopes of piecewise linear segment defining hazard --C-91
If oHx(iAlt, K, 2) = oHx(iAlt, K, 1) Then
oHx(iAlt, K, 2) = oHx(iAlt, K, 2) + 0.1 ‘ guard against undefined
slopes
End If
HM(iAlt, K) = (oHy2 – oHy1) / (oHx2 - oHx1)
Point hazards are defined by a point and radius. The coordinates of the center of
the hazard and the hazard diameter are read from the worksheet “Alternatives”.
ElseIf oHzrd_Type(iAlt, K) = "P" Then
oHx(iAlt, K, 1) = {longitudinal coordinate of hazard center point}
oHy(iAlt, K, 1) = {lateral coordinate of hazard center point} *
sideStart
R(iAlt, K) = ({Diameter} / 2) /12
' converted from inches to
feet
End If
oHzrd_Connection(iAlt, K) = 0
Next K
After all the hazards have been defined, the final task is then to associate
terminal-ends to their mating longitudinal barriers (e.g., guardrail). The program goes
back and looks for hazards named “end-terminal”. It then searches the end coordinates of
all line hazards to find the one that is coincident with the location of the end-terminal.
The end-terminal and the line hazard are then associated by setting oHzrd_Connection
(iAlt,K) = j, where iALT is the alternative containing the hazard pair, K is the hazard
number for the end-terminal, and j is the hazard number for the line-hazard. If a mate
cannot be found RSAPv3 will terminate the analysis; then place the cursor on the
“alternative” worksheet in the data cell corresponding to the end-terminal; and show a
pop-up window with the message, “Guardrail terminal not connected to guardrail”. The
coordinates will have to be corrected on the “Alternative” sheet and the analysis restarted.
For K = 1 To oNum_Hazards(iAlt)
If oHzrd_GenType(iAlt, K) = "TerminalEnds" Then
oHzrd_Connection(iAlt, K) = 0 ‘ initialize association to 0
For j = 1 To oNum_Hazards(iAlt)
If oHzrd_Type(iAlt, j) = "L" Then
If {oHx1 of end-terminal = oHx1 or oHx2 of linehazard} _
And _
{oHy1 of end-terminal = oHy1 or oHy2 of linehazard} _
Then
oHzrd_Connection(iAlt, K) = j
C-92
End If
End If
Next j
If oHzrd_Connection(iAlt, K) = 0 Then
shAlternatives.Select
Cells(HazRow + (K - 1), AltOffset - 8).Select
MsgBox ("Guardrail terminal not connected to
Guardrail")
End
End If
End If
Next K
Next iAlt
End Sub
MODULEPOCTRAJ
This module is called by ModulePOCmain to select trajectories from the crash
reconstruction database (trajectory database) to be used in the analysis. The primary
function of this module is search the database to identify relevant cases based on
similarity to the given road-segment characteristics; that is, the program selects all
trajectory cases that have characteristics which fall within a specified range of those
defined for the given project. The selection methodology involves examining and
scoring each individual trajectory case based on a quantitative comparison of the four
critical roadway characteristics (i.e., Roadside cross-section profile, Horizontal curve
radius, Highway vertical grade, and Posted speed limit) to those in the current project
section. The individual scores for each of the four criteria are then combined into a single
representative composite score for the trajectory case. After all trajectories have been
assigned a score, RSAPv3 then selects the trajectories with the highest scores for use in
the analysis. Figure 32 shows the flow chart for this program module. The following
sections discus the various programming tasks. Additional information on the
methodology for trajectory selection is provided in the ENGINEER’S MANUAL.
C-93
Figure 32. Flow chart for Module POCtraj.
C-94
Input Variables
The following are a list of variables passed from Module POCMain.
CSloc: roadside cross-section profile in local coordinates
iALT: alternative number
iDirection: traffic direction (i.e., 1= primary, -1 = opposing)
iLDS: encroachment side (1 = right, -1 = left)
iSeg: segment number
iVeh: vehicle type number
grid_inc: longitudinal increments of trajectory path
oPDCR: horizontal curve radius
oPDG: roadway vertical grade
oPSL: posted speed limit
SheetName: name of the worksheet containing the database of reconstructed
trajectories
num_veh: total number of vehicle types
ymaxp: maximum extent of cross-section profile in local coordinates
Program Variables
The following are a list of variables defined in the Module.
TrajectoryData: variable array that stores the entire trajectory database to
facilitate quick access to the data
delta_y: lateral increment for resampling cross-section profiles
myrow: first row with data on the trajectory grid worksheets
num_pre: Number of data columns preceding the trajectory path information in
the trajectory databases
num_traj: total number of trajectories selected for the analysis
SumErrSq: sum of the errors squared for comparing roadside cross-section
profiles
TrajScore:
trajx:
trajy:
traj_select:
y: lateral coordinate of resampled cross-section profile of project road segment
z: vertical coordinate of resampled cross-section profile of project road segment
yt: lateral coordinates of cross-section profile from trajectory database
zt: vertical coordinates of cross-section profile from trajectory database
st: slopes of cross-section profile from trajectory database
yy: lateral coordinate of resampled cross-section profile from trajectory database
C-95
zz: vertical coordinate of resampled cross-section profile from trajectory database
Read all Data from Trajectory Grid Worksheet
The number of rows of data in the trajectory database is determined and the
variable array traj_select is re-dimensioned. The name of the trajectory database is passed
in from Module POCMain as SheetName. The program then reads in the complete
trajectory database and stores it in the array variable TrajectoryData to facilitate quick
access to the data.
Count = 0
Do Until {a blank row is found, indicating the end of data}
Count = Count + 1
Loop
ReDim traj_select(Count)
TrajectoryData = Sheets(SheetName).Range(Cells(4, "A").Address, Cells(Count
+ 3, num_pre(iVeh) + 300).Address).value
Compute Roadside Cross-Section Profile Score
In order to perform a point-to-point comparison of the similarity of a given
roadside cross-section to those from the trajectory database, the lateral coordinates must
be sampled at the same increments. The program first resamples the cross-section
coordinates for the project segment at lateral increments of delta_y using linear
interpolation.
delta_y = 1 'ft
y(0) = CSloc(1, 1)
z(0) = CSloc(1, 2)
i=2
For j = 1 To ymaxp / delta_y
y(j) = y(j - 1) + delta_y
If y(j) > CSloc(i, 1) Then ' if y>y0 then a slope change occurs between
these two
positions
z(j) = CSloc(i + 1, 3) * (y(j) - CSloc(i, 1)) + CSloc(i, 2)
i=i+1
Else
z(j) = CSloc(i, 3) * delta_y + z(j - 1)
End If
zmaxp = Application.Max(zmaxp, Abs(z(j)))
Next j
C-96
The program then reads in the cross-section profile for each case in the trajectory
database and computes the slope between break-points. Note that there are eight (y, z)
coordinate pairs defining each cross-section profile case in the database. The lateral
coordinates start at column 29 (“AC”) and the vertical coordinates start at column 37
(“AK”).
num_traj(iVeh) = 0
N=1
For i = 1 To Count
iXsect = 1
yt(0) = 0
zt(0) = 0
Do While TrajectoryData(i, 29 + iXsect) <> "" And iXsect < 8
yt(iXsect) = TrajectoryData(i, 28 + iXsect) 'y-coord of X-section
zt(iXsect) = TrajectoryData(i, 36 + iXsect) 'z-coord of X-section
ymaxt = yt(iXsect)
If iXsect <> 0 Then
' -- check and correct infinite slopes
delta_yt = (yt(iXsect) - yt(iXsect - 1))
If delta_yt < 0.01 Then
delta_yt = 0.01
End If
' -- compute slope
st(iXsect) = (zt(iXsect) - zt(iXsect - 1)) / delta_yt
End If
iXsect = iXsect + 1
Loop
The next step is to resample each of these cross-section profiles at increments of
delta_y using linear interpolation and then perform a point-to-point comparison of each
cross-section to the project’s cross-section profile by summing the square of the errors at
each point.
For i = 1 To Count
yy(0) = yt(0)
zz(0) = zt(0)
SumErrSq = 0
' initialize the "sum of the errors squared" value
ii = 1
st(iXsect) = 0
C-97
' set lateral extent beyond known data to a very large number (to make
sure yy(j)
can never be greater than this value)
yt(iXsect) = 1000000#
For j = 1 To ymaxp / delta_y
yy(j) = yy(j - 1) + delta_y
' if y>y0 then a slope change occurs between these two positions
If yy(j) > yt(ii) Then
zz(j) = st(ii + 1) * (yy(j) - yt(ii)) + zt(ii)
ii = ii + 1
Else
zz(j) = st(ii) * delta_y + zz(j - 1)
End If
SumErrSq = (z(j) - zz(j)) ^ 2 + SumErrSq
Next j
The roadside cross-section for each crash case in the trajectory database is
compared directly to that of roadway being analyzed and is given a score which
represents its degree of similarity. The similarity score, S1score, is calculated based on
the square root of the sum of the residual errors squared divided by the total width of the
roadside cross-section, as defined below
For i = 1 To Count
S1score = 1-(SumErrSq ^ 0.5) / ymaxp
Compute Post Speed Limit Score
The posted speed limit for each case in the trajectory database is then compared with the
posted speed limit of the current road segment and a similarity score is determined based
on the following relationship:
For i = 1 To Count
If {no speed limit was reported for a given case in the trajectory
database} Then
TrajectoryData(i, 7) = 55 ‘Set value to 55 mph
End If
S2score = 1 - Abs(oPSL - TrajectoryData(i, 7)) / 50
C-98
The above calculation for S2score basically deducts 0.1 point from the score for
every 5 mph difference between the posted speed limit of the segment and the value in
the ith trajectory case from the database.
Compute Vertical Grade Score
The scoring criteria for vertical grade is based on the assumption that slight
differences in vertical grade would have less influence on trajectory characteristics for
cases of flat and uphill grades than it would for downhill grades. Accordingly, the vertical
grade for each crash case in the database is compared to the value for each segment using
the following relationships:
For i = 1 To Count
If {no vertical grade was reported for a given case in the database} Then
TrajectoryData(i, 21) = 0
‘ set grade to “flat”
End If
If oPDG >= -2 Then
S3score = -0.02392 * Abs(TrajectoryData(i, 21) - oPDG) ^ 2
- 0.0257 * Abs(TrajectoryData(i, 21) - oPDG) + 1
ElseIf oPDG >= -10 And oPDG < -2 Then
S3score = -0.2 * Abs(TrajectoryData(i, 21) - oPDG) + 1
Else
S3score = -0.1 * Abs(TrajectoryData(i, 21) - oPDG) + 1
End If
Compute Horizontal Curve Score
The criteria for the similarity score for horizontal curve radii, S4score, is based on
the absolute difference between the reciprocal of the curve radius of each segment in the
project (i.e., curvature) and the reciprocal of the curve radius for ith trajectory from
database. This value is then multiplied by a factor of 1,079 which converts the score to
the same scoring scale used in the previous scoring criteria.
Horizontal curves are defined by curve radius and by the relative direction of the
curve (e.g., positive curves to right and negative to left relative to the direction of travel).
Accordingly, the horizontal curve radius for each crash case in the database is compared
to the value for each segment using the following relationships:
For i = 1 To Count
If {no value for horizontal curve was reported for a given case in the
database} _
Or If {a value of 0 was mistakenly entered} Then
C-99
TrajectoryData(i, 16) = 100000
' set to straight
End If
If departure is to the right then the curvature relative to the vehicle departure is positive
If TrajectoryData(i, 28) = "R" Then
curvature = 1 / TrajectoryData(i, 16)
oPDcurvature = 1 / oPDCR
If departure is to the left then the curvature relative to the vehicle departure is negative
Else
curvature = -1 / TrajectoryData(i, 16)
oPDcurvature = 1 / oPDCR
End If
S4score = 1 - 1079 * (Abs(curvature - oPDcurvature))
The one exception is if both the oPDCR and the curve for the trajectory case are
“tangent” (i.e., |>10,000|), then the score is set to 1.0.
If Abs(oPDcurvature) <= (1 / 10000) And Abs(curvature) <= (1 / 10000)
Then
S4score = 1
End If
Compute Composite Score for Each Case in the Database
The individual scores for each of the four criteria presented above are then
combined into a single representative composite score for the trajectory case, where the
composite score is a weighted average of the four individual scores. In some cases, the
similarity scores might be very high for certain characteristics and low for others. In these
cases the weighted average score may result in a relatively high value. To reduce the
likelihood of such a trajectory case being selected for the analysis, a “cutoff” value is set
for each characteristic score. When an individual score falls below the cutoff value then
its value is reduced by half in order to sufficiently lower the composite score and
minimize its chance for selection. The cutoff values for each characteristic are defined on
the RSAPv3 Control Form, as shown in Figure 33. The default value is 0.7.
C-100
Figure 33. RSAPv3 Controls Dialog -- Default Analysis Settings.
The following lines of code read the cutoff values from the RSAPv3 Control Form.
For i = 1 To Count
S1cutoff = CDbl(frmRSAPcontrols.{Read cutoff value for x-section score}
S2cutoff = …{Read cutoff value for posted speed limit score}
S3cutoff = …{Read cutoff value for vertical grade score}
S4cutoff = …{Read cutoff value for Horizontal Curve score}
If S1score < S1cutoff Then
S1score = S1score / 2
End If
If S2score < S2cutoff Then
S2score = S2score / 2
End If
If S3score < S3cutoff Then
S3score = S3score / 2
End If
If S4score < S4cutoff Then
S4score = S4score / 2
End If
C-101
The weight assigned to each of the characteristic scores is also defined on the
RSAPv3 Control Form shown in Figure 33. It was determined that the roadside crosssection has a greater influence on the vehicle’s trajectory path than the other roadway and
roadside characteristics and was therefore assigned a higher weight in the calculation of
the composite score. Likewise, the horizontal alignment of the roadway was also
considered to have a significant effect on trajectory path and was assigned a relatively
higher weight as well. The default value of the weight assigned to each criterion is listed
below. Refer to the ENGINEER’S MANUAL for further discussion regarding these
values.
W1 = 3, (weight assigned to roadside cross-section)
W2 = 2, (weight assigned to horizontal curvature)
W3 = 1, (weight assigned to vertical grade)
W4 = 1, (weight assigned to posted speed)
The following lines of code read the weight values from the RSAPv3 Control Form;
compute the composite score for the ith trajectory case; and store the score values in the
array Trajscore.
WS1 = CDbl(frmRSAPcontrols.{Read weight for cross-section slope
profile}
WS2 = …{Read weight for posted speed}
WS3 = …{Read weight for vertical grade}
WS4 = …{Read weight for horizontal curve radius}
Trajscore(i, 1) = i
Trajscore(i, 2) = (WS1 * S1score + WS2 * S2score + WS3 * S3score _
+ WS4 * S4score) / (WS1 + WS2 + WS3 + WS4)
Trajscore(i, 3) = S1score
Trajscore(i, 4) = S2score
Trajscore(i, 5) = S3score
Trajscore(i, 6) = S4score
Next i
Select Trajectories for the Analysis
Once the individual scores for each of the four criteria have been computed and
combined into a single representative composite score for the trajectory case, RSAPv3
then sorts the trajectory cases in descending order based on their composite score and
selects the trajectory cases with the highest scores for use in the analysis. RSAPv3
selects only those trajectories that have a composite score of 0.93 or higher or until the
minimum number of desired trajectory cases are obtained. The minimum number of
trajectories is defined on the RSAPv3 Control Form shown in Figure 33 and the default
value is 10.
For some road segments with very common roadside characteristics, there may be
a relatively large number of trajectory cases with a score higher than 0.93– particularly as
C-102
more and more cases are added to the database. Although the accuracy of the analysis is
expected to increase as the number of “applicable” trajectories increases, the time for
completing the analysis will also increase. It is assumed that a maximum of forty
trajectories will provide sufficient accuracy with acceptable analysis time; however, the
maximum number of trajectory cases is defined on the RSAPv3 Control Form, where it
can be readily changed. The following lines of code (1) sort the composite scores in
descending order, (2) selects the trajectories cases with the highest scores for use in the
analysis, (3) determines the lowest composite score and the average composite score of
the selected trajectory cases.
Call MatrixSort({sort trajectory scores in descending order})
sumTrajscore = 0 ' initialize sum of trajectories scores
Do While {number of selected cases} < {min number} Or {composite score} >
0.93_
And {number of selected cases} < Application.Max({min number}, {max
number})
num_traj(iVeh) = num_traj(iVeh) + 1 ‘ increase count of selected
trajectory cases
sumTrajscore = sumTrajscore + {current trajectory score}
Loop
minTrajscore = {minimum value of selected trajectory scores}
avgTrajscore = sumTrajscore / num_traj(iVeh)
Redefine the Selected Trajectory Cases Based on Traffic Direction and Departure
Side
As discussed earlier, the trajectory paths in the trajectory database have all been
normalized to a local reference frame with positive path coordinates (e.g., consistent with
primary-right encroachments). The trajectory path data must be transformed to the global
coordinate frame for application in the analysis. The following lines of code re-dimension
the trajectory path variables and transform the trajectory path coordinates from local to
global coordinates for each trajectory case selected for the analysis.
ReDim trajx(num_veh, num_traj(iVeh), num_pre(iVeh) + 300)
ReDim trajy(num_veh, num_traj(iVeh), num_pre(iVeh) + 300)
ReDim MaxL(num_veh, num_traj(iVeh))
ReDim MinY(num_veh, num_traj(iVeh))
ReDim MaxY(num_veh, num_traj(iVeh))
For i = 1 To {total number of selected trajectories}
MinY(iVeh, i) = 1000000#
MaxY(iVeh, i) = -1000000#
C-103
For j = 1 To num_pre(iVeh) + 300
The longitudinal path coordinates are not explicitly defined in the database;
instead, the lateral trajectory path coordinates are defined at specified longitudinal
increments equal to grid_x. The following line of code determines the x-coordinate of
the of trajectory path based on the increment value, grid_x and the number of data
columns preceding the trajectory path coordinates (i.e, num_pre). The value of trajx starts
at zero when j = num_pre.
trajx(iVeh, i, j) = (j - 1 - num_pre(iVeh)) * grid_inc(iVeh) *
iDirection
The next lines of code read in and define the trajectory coordinates. The lateral
coordinate data is preceded by various other trajectory data, which are read from the
trajectory database and stored in the variable array traj_y. The lateral coordinates are
then transformed from local to global reference frame (i.e., they are multiplied by
iDirection and iLDS).
If j <= num_pre(iVeh) Then
trajy(iVeh, i, j) = {read crash cases data preceding path _
coordinates}
ElseIf TrajectoryData(Trajscore(i, 1), j) = "" Then
trajy(iVeh, i, j) = "" ‘Blank cells remain blank
Else
trajy(iVeh, i, j) = {read coordinate data} * iDirection *
iLDS
The minimum and maximum lateral extents of the trajectory paths are also
computed for use later in the analysis in deciding if a trajectory path will be assessed for
collision with each hazard. For example, if the hazard lies outside the extent of the
trajectory path, then the path is not checked for collision with the hazard. The maximum
length of the path is also computed for use in the determining the probability of rollover.
MinY(iVeh, i) = {check if current path coordinate is less
than the
previous minimum value and keep the lesser of
the two}
MaxY(iVeh, i) = {check if current path coordinate is
greater than
the previous maximum value and keep the greater of
the
two}
If j = num_pre(iVeh) + 1 Then
MaxL(iVeh, i) = trajy(iVeh, i, j)
Else
C-104
MaxL(iVeh, i) = {compute maximum length of trajectory
path}
End If
End If
Next j
Next i
MODULEPOCANALYSIS
This module is called by ModulePOCMain to compute the probability of impact
for a given trajectory case and to compute the associated crash costs. The basic procedure
is to (1) map the trajectory path onto the roadside or median; (2) examine the trajectory
point-by-point for collision with each hazard; (3) if collision occurs compute collision
cost (i.e., call subTrajectory_Statistics), check for penetration (call subPenetrate), and
check for redirection (call subRedirect); (4) return cost statistics back to Module
POCMain.
Input Variables
The following are a list of variables passed from Module POCMain.
i:trajectory path number
iALT: alternative number
iDirection: traffic direction (i.e., 1 = primary, -1 = opposing)
iDP: departure point
iLDS: encroachment side (1 = right, -1 = left)
iSeg: segment number
iVeh: vehicle type number
grid_inc: longitudinal increments of trajectory path
oHzrd_Name: Name of hazard
oHzrd_GenType:
oHzrd_Type:
oHzrd_EFCCR65:
oHzrd_Prcnt_PRV:
oHzrd_Prcnt_RR:
oHzrd_Capacity:
oHzrd_Height:
oHzrd_Connection:Identifies LON hazard attached to END TERMINAL
oPDCR: horizontal curve radius
oPDG: roadway vertical grade
oPSL: posted speed limit
SheetName: name of the worksheet containing the database of reconstructed
trajectories
C-105
num_veh: total number of vehicle types
ymaxp: maximum extent of cross-section profile in local coordinates
Program Variables
The following are a list of variables defined in the Module.
POC: probability of collision
C-106
Figure 34. Flow Chart for Module POCanalysis.
C-107
Figure 35. Flow chart for detecting collisions with line hazards in Module
POCanalysis.
C-108
Figure 36. Flow chart for detecting collisions with point hazards in Module
POCanalysis.
C-109
Initialize Variables
Several variables are initialized at the beginning of this analysis procedure:
end_pen_flag = 0
VE = V0
v = V0
decel = decel0
For K = 1 To {total number of hazards for current alternative}
d0(K) = {distance from current path position to first hazard coord.}
Next K
The variable end_pen_flag is initialized to zero, which indicates that the path is
not a redirection path and that terrain rollovers should be considered (i.e., rollovers after
redirection are handled separately). The variables VE and v are defined as the initial
velocity; the variable decel is defined as the average deceleration of the trajectory path.
The variables v and decel may change during the analysis, depending on various factors,
and therefore must be renamed at the start of the analysis to prevent any changes from
being passed back to the parent module.
Determine if Trajectory Path Falls Within Extents of the Hazard
The next step in the analysis is to determine if a hazard is located within the
lateral extents of the trajectory path. If it is not, then it will not be checked for impact
with the hazard. If the hazard is located outside the extents of the trajectory path, then a
flag is set, logic_1(k) = “false”, which tells the program that it can skip the collision
analysis for hazard k. If the hazard is located within the extents of the trajectory path then
the program sets logic_1(k) = “true”, which tells the program that it must check that
trajectory for impact with hazard k. It also sets another flag, logic_2 = “true”, which tells
the program that at least one hazard is located within the extents of the trajectory path.
The probability of roadside rollovers is checked for all cases unless it is a redirectiontrajectory.
max_extent = {maximum lateral extent of trajectory path}
min_extent = {minimum lateral extent of trajectory path}
For K = 1 To {total number of hazards for current alternative}
If {hazard type} = {Point} Then
If oHy(iAlt, K, 1) < min_extent Or oHy(iAlt, K, 1) > max_extent Then
Logic_1(K) = "false"
Else
Logic_1(K) = "true"
logic_2 = "true"
End If
ElseIf {hazard type} = {Line} Then
C-110
If {both ends of the hazard are less than the minimum lateral extents of
trajectory} _
Or _
{if both ends of the hazard exceed the maximum lateral extents of trajectory}
_
Or _
{if hazard is Opposing median edge And encroachment is from Primary
Direction} _
Or_
{if hazard is Primary median edge And encroachment is from Opposing
Direction} _
Then
logic_1(K) = "false"
Else
logic_1(K) = "true"
logic_2 = "true"
End If
End If
Next K
Evaluate Trajectory Path
This section of the module checks for impacts when the following three
conditions are met: (1) the hazard is within the lateral extents of the trajectory path or
terrain rollover is possible, (2) the velocity is greater than zero, and (3) the probability of
occurrence is greater than 0.1%.
The program examines each point of the trajectory path starting at x0, which is the
current encroachment location being evaluated for all the trajectory paths as illustrated in
Figure 37.
Increment of
departure points
along segment,
Ending station
of segment
Starting station
of segment
SegStart
SegEnd
Segment Length
SegLength
DP_inc
Current departure point
Departure increment, iDP = 0 1 2 3 4 5
x0 = iDP * DP_inc *iDir + SegStart
(oHx1,oHy1)
Hazard
(oHx2,oHy2)
Figure 37. Illustration of roadway segment showing definition of x0.
C-111
The following lines of code perform the following tasks: (1) define the current xcoordinate relative to the departure point x0, (2) define the longitudinal increment of the
trajectory path, and (3) computes the velocity based on initial velocity, deceleration and
distance traveled.
j=1
Do While j < nopc And logic_2 = "true" And v <> 0 And POC > 0.001
j=j+1
x = trajx(iVeh, i, j + num_pre) + x0 ' x-coordinate
If j = 1 Then
dx = trajx(iVeh, i, j + num_pre)
Else
dx = trajx(iVeh, i, j + num_pre) - trajx(iVeh, i, j + num_pre - 1)
End If
If the lateral coordinate at x is blank, then the end of path is reached and the
velocity is zero; otherwise, compute velocity.
If traj(iVeh, i, j + num_pre) <> "" Then
Lj =
‘ length of current increment
TL = TL + Lj ‘cummulative length of path
Deceleration is pre-defined for each trajectory case in Trajectory database. In
some of those cases, however, the deceleration is considered to be unreasonably low,
particularly for the case of long trajectory paths. It is assumed that if a person is not
braking before the vehicle leaves the roadway, then braking should initiate as soon as the
driver is aware of the situation. The original value for deceleration (from the trajectory
database) is used to compute velocity until the encroachment reaches a critical distance.
At that point, if the deceleration is less than the 20th percentile deceleration value of 6.4
ft/s2, then the velocity from that point on is computed using 20th percentile value. The
critical length is the distance that the vehicle travels during typical perception-reaction
time, t, of one second.
t = 1 ‘perception-reaction time
If TL > -decel / 2 * t ^ 2 + V0 * t Then decel = Application.Max(decel,
6.4)
' prevent overflow in max length calculation below
If decel = 0 Then decel = 0.001
The maximum length of the trajectory path, MaxL, was computed earlier;
however, its value will decrease if the value for deceleration is increased and must be
recomputed (note: this variable is used for computing probability of rollover in a later
task).
C-112
MaxL = Application.Min(MaxL0, (VE ^ 2 / decel) * (1 / 2))
If the velocity is less than zero for the current increment, then set the velocity to
zero.
If (V0 ^ 2 - 2 * decel * TL) > 0 Then
v = (V0 ^ 2 - 2 * decel * TL) ^ 0.5
Else
v = 0 ‘ deceleration was increased and path ended prior to
reaching the
‘ end of original path definition.
End If
Else
v = 0 ‘ velocity set to zero at end of path definition
End If
Compute Rollover Statistics and Check for Rollover
Before checking the path for impact with roadside features, the program first
computes the probability of rollover at the current path increment, unless the current
trajectory is a redirection event. The probability of rollover for a given trajectory path is
modeled in RSAPv3 using the following relationship, which is based on the average
probability of rollover as the vehicle traverses multiple sideslopes along its trajectory
path:
1
|
∗
∗
,
,
∗
Where:
|
,
,
.
The program calls subroutine subRolloverM2a to update the values in the rollover
equation at each increment. If the current increment is the last increment of the trajectory
path, then the program calls subroutine subrolloverM2b to compute the probability of
rollover and the associated crash cost. The subroutines are presented in a later section of
this Manual and the details of the rollover model are provided in the ENGINEER’S
MANUAL.
Do While j < nopc And logic_2 = "true" And v <> 0 And POC > 0.001
C-113
If redir_flag <> 1 Then
N=N+1
' number of increments in rollover count
Call subRolloverM2a()
If the current increment is the end of trajectory and probability of occurrence is
greater than 0.1% then compute probability of rollover.
If j = nopc Or traj(iVeh, i, j + num_pre + 1) = "" Or v = 0 And POC >
0.001
Then
Call subRolloverM2b()
When a rollover event has been determined, the statistical variables must be reinitialized.
SumV2 = 0
V2avg = 0
N=0
End If
End If
Check for Collision with Hazards
At each increment of the trajectory, the coordinates of the path are checked to
determine if they have encountered any of the hazards. If, however, it was predetermined
that the hazard is not located within the extents of the trajectory path then the evaluation
for that hazard is skipped.
Do While j < nopc And logic_2 = "true" And v <> 0 And POC > 0.001
If {yj} <> "" Then
For K = 1 To {total number of hazards for the current alternative}
If logic_1(K) = "true" Then
Line Hazards
The basic procedure for identifying impact with “line” hazards is to compare the
lateral coordinate of the trajectory at the current and previous increment with the
corresponding lateral coordinates of the hazard. If the trajectory path at the previous
increment (j-1) is on the left-side of the hazard and the path at the current increment (j) is
on the right-side of the hazard, then the hazard was struck from the left side, as illustrated
in Figure 38(a). Likewise, if the trajectory path at the previous increment (j-1) is on the
right-side of the hazard and the path at the current increment (j) is on the left-side of the
hazard, then the hazard was struck from the right side, as illustrated in Figure 38(b).
C-114
increment (j – 1) (j)
Line Hazard
a) Impact on left-side of hazard
increment (j – 1) (j)
Line
b) Impact on right-side of hazard
Figure 38. Illustration. Trajectory path (a) crossing hazard from left side and (b)
crossing hazard from right side.
C-115
The following lines of code check for impacts with line hazards unless it is
connected to an end-terminal that has already been struck. Recall that when an endterminal is struck, the end_pen_flag value is set to the hazard-number corresponding to
the line hazard which is attached to the end-terminal.
Do While j < nopc And logic_2 = "true" And v <> 0 And POC > 0.001
If {yj} <> "" Then
For K = 1 To {total number of hazards for the current alternative}
If logic_1(K) = "true" Then
If oHzrd_Type(iAlt, K) = "L" And end_pen_flag <> K Then
The following lines of code determine which end of the hazard is passed first. For
example, in the primary direction the hazard coordinate oHx1 is passed first; whereas
from the opposing direction of traffic the hazard coordinate oHx2 would be passed first.
If iDir = 1 Then
loc_check1 = x + dx
loc_check2 = x
Else
loc_check1 = x
loc_check2 = x + dx
End If
There are cases when the longitudinal length of a hazard (e.g., line hazard
perpendicular to roadway) is less than the longitudinal increment of the trajectory (e.g., 1
ft). To avoid passing over such hazards, the path position at a x+dx is checked to see if it
has passed the upstream end of the hazard and the path position at x is checked to see if it
has passed the down-stream end of the hazard. If TRUE, then check for collision.
If loc_check1 >= oHx(iAlt, K, 1) And loc_check2 <= oHx(iAlt, K, 2)
Then
The first step of this task is to compute the lateral coordinate value of the line
hazard at x and at x+1. The collision flag is set to Collision = “checking”. When a
collision has been determined this flag will then be set to “true”, in which case rollover
statistics will be computed prior to the analysis of the collision.
Hy0 = HM(iAlt, K) * (x - oHx(iAlt, K, 1)) + oHy(iAlt, K, 1)
Hy1 = HM(iAlt, K) * ((x + dx) - oHx(iAlt, K, 1)) + oHy(iAlt, K, 1)
Collision = "checking"
' initialize collision flag
The criteria for collision on the left side of the barrier is defined as follows: If
lateral trajectory at previous point is less than lateral position of hazard and the lateral
trajectory at the current point is greater than lateral position of hazard and if there is no
C-116
rollover or end of trajectory path, then path crossed barrier from left side. The width of
the barrier is accounted for when determining the hazard location.
BHW = {barrier width} / 2
If {yj} <= Hy0 - BHW _
And {yj} <= Application.Max{oHy1, oHy2} - BHW _
And {yj+1} > Hy1 - BHW _
And {yj+1} > Application.Min{oHy1, oHy2} - BHW Then
CSRL = "left" ' collision side "left" used for determining
‘sign of angle for redirection trajectories
Collision = "true"
The criteria for collision on the right side of the barrier is defined as follows: If
lateral trajectory at previous point is greater than lateral position of hazard and the
lateral trajectory at the current point is less than the lateral position of hazard and if
there is no rollover or end of trajectory path, then path crossed barrier from right side.
ElseIf {yj} >= Hy0 + BHW _
And {yj} >= Application.Min{oHy1, oHy2} + BHW _
And {yj+1} < Hy1 + BHW _
And {yj+1} < Application.Max{oHy1, oHy2} + BHW Then
CSRL = "right" ' collision side "right" used for determining
‘sign of angle for redirection trajectories
Collision = "true"
End If
If a collision has occurred on either side of the hazard, then (1) compute
probability and associated costs of a rollover occurring prior to the collision with the
hazard, (2) compute crash statistics and associated costs for collision with the hazard, (3)
determine probability of PRV, (4) evaluate redirection trajectories for secondary
collisions and (5) continue evaluating current path (post penetration) for secondary
collisions.
(1) Compute Rollover Statistics and Cost
If the trajectory is not a redirection trajectory then the program calls subroutine
subRolloverM2b to calculate rollover statistics. The subroutines are presented in a later
section of this Manual and the details of the rollover model are provided in the
ENGINEER’S MANUAL.
If Collision = "true" Then
If redir_flag <> 1 Then
Call subRolloverM2b()
'Initialize Rollover Variables
SumV2 = 0
V2avg = 0
C-117
N=0
End If
(2) Compute Crash Statistics for Collision with Hazard
The program first determines which side of the hazard was struck, which is stored
in the variable CS.
y = traj(iVeh, i, j + num_pre) + y0 ' lateral impact location
Call sub_CS(oHy(iAlt, K, 1), oHy(iAlt, K, 2), iDir, CS, y0, y)
A median edge line is considered to be a hazard only when a vehicle is crossing
into opposing lanes of traffic. So, if the hazard is not a median edge and the vehicle is
not crossing from the non-traffic side, then it is considered a collision and the subroutine
subCollision_Statistics is called to compute the crash-cost statistics. The subroutines are
presented in a later section of this Manual and the details of computing crash statistics are
presented in the ENGINEER’S MANUAL.
If Not (oHzrd_Name(iAlt, K) = "EdgeOfMedian" And CS =
"NTS")
Call subCollision_Statistics()
The initial velocity for subsequent redirection trajectories is equal to the current
velocity. The angle of impact relative to the barrier is also computed for use in computing
impact severity and redirection paths.
vR0 = v
' impact velocity stored for use in evaluating
‘redirection paths in subRedirect
Impact angle with respect to roadway:
If dx = 0 Then
Theta_traj = Atn{y1 / x1}
Else
Theta_traj = Atn{(yj - yj-1) / dx}
End If
Angle of hazard with respect to roadway:
Theta_Haz = Atn(HM(iAlt, K))
Impact angle with respect to hazard:
Theta = Theta_traj - Theta_Haz ' Impact angle w.r.t. barrier
(3) Determine Probability of Penetration, Rollover Barrier and Vault
The subroutine subPenetrate is called to compute the probability of penetration
due to exceeding structural capacity of the barrier, rolling over the barrier, and vaulting
the barrier. Along with the crash statistics (e.g., probability of penetration, probability of
redirection, etc.), the subroutine also passes back the updated velocity which is reduced
C-118
according to the amount of energy expended in penetrating the barrier. The subroutines
are presented in a later section of this Manual and the details of determining penetration
are presented in the ENGINEER’S MANUAL.
Call subPenetrate()
V0 = v
TL = 0
' trajectory length is reset to correspond to the new
v0
(4) Evaluate Redirection Paths for Secondary Collisions
When a collision occurs with a line hazard there is generally a probability of
redirection (some exceptions would be a tree-line hazard or a water hazard). For
longitudinal barriers in particular the probability of redirection is dependent upon the type
of vehicle and whether or not the vehicle penetrated the barrier. Impacts with
motorcycles are not evaluated for redirection since it is likely that the passengers would
have been ejected upon impact.
Penetration is determined using a combination of crash statistics and the
mechanics of the impact event which are discussed in detail in the ENGINEER’S
MANUAL. If the probability of redirection is greater 1 percent and the vehicle type is not
a motorcycle, then the program calls subroutine subRedirect to evaluate redirection paths
for secondary collisions. Recall that the probability of redirection was determined in step
(3) from subroutine subPenetrate. The subroutines are presented in a later section of this
Manual. Since the following lines of code conclude the analysis for the line hazard, all
the preceding program loops and nested If statements associated with the analysis of the
line hazard are presented in gray font for convenience.
Do While j < nopc And logic_2 = "true" And v <> 0 And POC > 0.001
If {yj} <> "" Then
For K = 1 To {total number of hazards for the current alternative}
If logic_1(K) = "true" Then
If oHzrd_Type(iAlt, K) = "L" And end_pen_flag <> K Then
If loc_check1 >= oHx(iAlt, K, 1) And loc_check2 <= oHx(iAlt, K, 2)
Then
If Collision = "true" Then
If Not (oHzrd_Name(iAlt, K) = "EdgeOfMedian" And CS =
"NTS")
If POR > 0.01 And {vehicle type} <> "M" Then
Call subRedirect()
End If
End If
End If
C-119
End If
End If
Move to the next hazard and continue evaluating current path for collisions.
Next K
Point Hazards
To determine if a vehicle following a given trajectory path will encounter a
“Point” hazard, the program increases the effective radius of the hazard to account for the
“swath” of the vehicle. The effective radius of the hazard is then defined as
/2, where is the radius of the hazard and w is the width of vehicle, as illustrated in
Figure 39. The vehicle swath is read from the RSAPv3 worksheet named “Traffic
Information”.
R = rH + ½w
Radius of Hazard, rH
Swath Width of Vehicle, w
w/2
Figure 39. Illustration. Defining the effective radius, R, of a "Point" hazard.
The basic procedure for identifying impact with “Point” hazards is to compute the
distance, d from the path at the current increment, j, to the center-point of the hazard and
compare it to the effective radius of the hazard, R. If the distance to the hazard is less than
R then the path is inside the boundaries of the hazard and impact has occurred, as
illustrated in Figure 40. It is possible that the path may fall inside the radius of the hazard
at several consecutive increments along the path, as illustrated in Figure 6. To avoid
counting these as subsequent impacts, the program checks to see if the path was inside
the hazard at the previous increment (j-1). If so, the current increment (j) is not
considered a collision.
C-120
(j – 1) (j) (j + 1)
R
Point Hazard
Figure 40. Illustration. Trajectory path crossing a point hazard.
The following lines of code check for impacts with point hazards. The first step
of this task is to compute the lateral coordinate value of the line hazard at x and at x+1.
Do While j < nopc And logic_2 = "true" And v <> 0 And POC > 0.001
If {yj} <> "" Then
For K = 1 To {total number of hazards for the current alternative}
If logic_1(K) = "true" Then
If oHzrd_Type(iAlt, K) = "P" Then
Hy0 = oHy(iAlt, K, 1)
The program only looks for collisions when the longitudinal coordinate of the
path is within the effective radius of the hazard (i.e., radius of hazard plus swath width of
vehicle). It then computes the lateral coordinate of the trajectory path (based on the
current increment of the path and the encroachment point) and the distance from the
current path location to the center of the hazard.
If x >= {oHx1} – {effective radius of hazard} _
And x <= {oHx1} + {effective radius of hazard} _
And yj <> "" Then
yp = traj(iVeh, i, j + num_pre) + y0
D = ((x - oHx(iAlt, K, 1)) ^ 2 + (yp - Hy0) ^ 2) ^ (0.5)
The criterion for impact is then: If current trajectory point (D) is found to be
within the effective radius of the hazard and the previous trajectory point (d0) was
outside this radius then impact occurred. Otherwise impact has not occurred or the
impact occurred during a previous increment and has already been accounted for.
If D <= {effective radius of hazard} _
And d0(K) > {effective radius of hazard} Then
C-121
If a collision has occurred and the current path is not a redirection path, then (1)
compute probability and associated costs of a rollover occurring prior to the collision
with the hazard, (2) compute crash statistics and associated costs for collision with the
hazard, (3) determine probability of penetration, and (4) continue evaluating current path
(post penetration) for secondary collisions.
(1) Compute Rollover Statistics and Cost
If the trajectory is not a redirection trajectory then the program calls subroutine
subRolloverM2b to calculate rollover statistics.
If redir_flag <> 1 Then
Call subRolloverM2b()
'Initialize Rollover Variables
SumV2 = 0
V2avg = 0
N=0
End If
(2) Compute Crash Statistics for Collision with Hazard
All collisions with point hazards are considered traffic-side impacts, so the
program sets:
CS = "TS"
The subroutine subCollision_Statistics is called to compute the crash-cost
statistics.
Call subCollision_Statistics()
(3) Determine Probability of Penetration
The subroutine subPenetrate is called to compute the probability of penetration
due to exceeding structural capacity of the hazard.
Call subPenetrate()
If the hazard is an end-treatment for a LON barrier then set end_pen_flag value to
the hazard number corresponding to the mating LON barrier and ignore subsequent
impacts on that barrier.
If oHzrd_GenType(iAlt, K) = "TerminalEnds" Then
end_pen_flag = oHzrd_Connection(iAlt, K)
End If
Along with the crash statistics (e.g., probability of penetration), the subroutine
subPenetrate also passes back the updated velocity, which is reduced according to the
amount of energy expended in penetrating the hazard. The initial velocity for postC-122
penetration is re-initialized along with the value for the trajectory length (TL) used in
computing the probability of rollover.
Do While j < nopc And logic_2 = "true" And v <> 0 And POC > 0.001
If {yj} <> "" Then
For K = 1 To {total number of hazards for the current alternative}
If logic_1(K) = "true" Then
If oHzrd_Type(iAlt, K) = "P" Then
If x >= {oHx1} – {effective radius of hazard} _
And x <= {oHx1} + {effective radius of hazard} _
And yj <> "" Then
If D <= {effective radius of hazard} _
And d0(K) > {effective radius of hazard} Then
V0 = v
TL = 0
End If
' v0 is reset corresponding to change in velocity
‘after penetration
' trajectory length is reset to correspond to the new v0
Reset distance d0 for next increment.
d0(K) = D
' redefine distance from previous trajectory point to
hazard
End If
End If
End If
Move to the next hazard and continue evaluating current path for collisions.
Next K
If the velocity of the current increment is zero (e.g., due to kinetic energy
expended during a penetration or redirection) or the trajectory path has ended then set j =
nopc which will end the analysis for the current increment.
Do While j < nopc And logic_2 = "true" And v <> 0 And POC > 0.001
If {yj} <> "" Then
ElseIf v = 0 Or {yj}= "" Then
j = nopc
End If
Loop
End Sub
C-123
SubCollision_Statistics
This subroutine is called by ModulePOCAnalysis, and the subroutines
subPenetrate and subRolloverMB2 to compute crash-cost statistics variables. The
program passes impact conditions, vehicle characteristics and hazard severity information
into the subroutine; these data are used to compute the crash costs for the current impact
which are added to the cumulative cost of impacts on the hazard. The details of the
development of this procedure are provided in the ENGINEER’S MANUAL.
Input Variables
The following are a list of variables passed from the parent modules and subroutines.
cost_adj: cost adjustment factor for current vehicle type
CS: collision side
iALT: current alternative
num_traj_seg: cumulative number of trajectories for this segment
oHzrd_EFCCR65:
POC: probability of collision
v: impact velocity
veh_type: vehicle type
Program Variables
The following are a list of variables defined in the subroutine.
EFCCR: Equivalent Fatal Crash Cost Ratio (e.g., normalized crash cost)
EFCCRi(num_traj_seg,1): total cumulative EFCCR the current trajectory
EFCCRi(num_traj_seg,2): vehicle type
EFCCRi(num_traj_seg,3): alternative
EFCCR_tot: total cumulative EFCCR for this hazard
Impact_Count_tot: cumulative number of impacts on current hazard
Impact_Count_NTS: cumulative number of impacts on non-traffic side of
hazard current hazard
Impact_Count_TS: cumulative number of impacts on traffic side of hazard
current hazard
Procedure
Compute EFCCR for current collision based on vehicle type, hazard severity, and
impact conditions.
EFCCR = VehCharac10 * (oHzrd_EFCCR65 / 274625) * (v * 60 / 88) ^ 3
The EFCCR value is a normalized crash cost defined as the ratio of the crash cost
divided by the cost of a fatal crash. The EFCCR is weighted based on the probability of
the collision occurring (i.e., POC). The value for POC is determined in subPenetrate and
C-124
subRollover based on probability of penetration and rollover, respectively. The
cumulative crash cost for the current hazard and the total number of impacts on the
hazard are then computed. This information is later used to compute the average crashcost for impacts with the hazard.
EFCCR_tot = EFCCR_tot + EFCCR * POC
impact_Count_tot = impact_Count_tot + POC
The following information is not used in computing crash costs, but is computed
here and later written to the RSAPv3 “POC scratch” worksheet for information purposes
only.
If CS = "TS" Then
impact_Count_TS = impact_Count_TS + POC
Else
impact_Count_NTS = impact_Count_NTS + POC
End If
End Sub
SubPenetrate
This subroutine is called by ModulePOCAnalysis to determine the probability of
penetration of a hazard during collision. The basic procedure is to (1) determine
probability of penetration due to structural failure or vaulting of hazard, (2) determine
probability of penetration due to rolling over the barrier (i.e., analysis for trucks only), (3)
determine probability of rollover after redirection and compute crash statistics for the
rollover event, (4) determine probability of redirection and (5) pass this information back
to parent module. The details of the development of this procedure are provided in the
ENGINEER’S MANUAL.
Input Variables
The following are a list of variables passed from the parent module.
iALT: current alternative
EFCCRi: total cumulative EFCCR the current trajectory
EFCCR_RR: cumulative EFCCR for rollover-after-redirection for current hazard
K: hazard number
num_traj_seg: cumulative number of trajectories for this segment
oHzrd_Capacity: hazard capacity
oHzrd_EFCCR65: hazard severity (Effective Fatal Crash Cost Ratio for impact
speed of 65 mph)
oNum_Hazards: number of hazards in current alternative
oHzrd_Height: height of hazard
oHzrd_Prcnt_RR: percent of rollover after redirection from crash statistics
oHzrd_Type: hazard type
C-125
POC: probability of occurrence for this trajectory increment (e.g. probability of
collision)
Theta0: impact angle
v: impact velocity
VehCharac(*,1): RSAPv3 vehicle name
VehCharac(*,2): FHWA vehicle class
VehCharac(*,3): percent of traffic mix
VehCharac(*,4): RSAPv3 vehicle type (M, C, T)
VehCharac(*,5): vehicle weight
VehCharac(*,6): vehicle length
VehCharac(*,7): vehicle width
VehCharac(*,8): distance from cg to front of vehicle
VehCharac(*,9): cg height
VehCharac(*,10): crash cost adjustment factor
Program Variables
The following are a list of variables defined in the Module.
POR: effective probability of redirection given collision conditions and
probability of collision event
PORV: effective probability of truck rolling over hazard given collision
conditions and probability of collision event
POC: probability of collision and/or occurrence of current trajectory path
PRB: probability of rolling over hazard given current impact conditions (ignoring
probability of penetration)
PRR: probability of rollover after redirection given current impact conditions
(ignoring probability of penetration and rolling over the barrier)
KE: kinetic energy of vehicle
KK: hazard number set for rollovers
Capacity: barrier capacity in units of energy
ISeverity: impact severity
m: vehicle mass
Count_pene_RSAP: number of penetrations on current hazard
V0rv: modified post-impact velocity die to loss of energy during redirection and
rollover)
WRR: probability of rollover after redirection (considering probability of
penetration, and rolling over the hazard)
WRV: probability of rolling over barrier given current impact conditions
(considering probability of penetration)
C-126
WR: probability of redirection (considering probability of penetration, rollover
barrier and rolling over after redirection)
WP: probability of penetration given current impact conditions
Procedure
Probability of Penetration due to Structural Failure or Vaulting
The program uses two different approaches for determining penetration:
Criterion A
If impact severity is greater than the structural capacity of the barrier and the
structural capacity is greater than or equal to zero, then the probability of penetration is
determined based on a combination of impact mechanics and a pseudo-probabilistic
model, where the probability of penetration up to capacity is based on crash statistics
(i.e., PRV from RSAPv3 “severity” worksheet) and increases toward 100% as impact
severity values increase beyond hazard capacity. In this case, it is assumed that the
probability of penetration can be described by the hyperbolic tangent function defined
below. More details on the development of the hyperbolic-tangent probability model are
presented in the ENGINEER’S MANUAL.
|
1
2
∗ tanh 5
1.5
1
2
Theta = Abs(Theta0)
' impact angle
Capacity = {hazard capacity} * Convert
'(ft-lb) energy
m = {vehicle weight} / 32.2 'lb-ft/s2
' vehicle mass
KE = (1 / 2) * m * v ^ 2
' kinetic energy
ISeverity = (1 / 2) * m * (v * Sin(Theta)) ^ 2 ' Impact Severity
If capacity >= 0 And ISeverity > capacity Then
s = oHzrd_Prcnt_PRV(iAlt, K) / 100 ' s = PRV
B=5
shift = 1.5
If s < 1 And capacity > 0 Then
WP = (1 - s) / 2 * Application.Tanh((ISeverity / capacity - shift) _
* B) + (1 - s) / 2 + s ' Percent penetration
Else
WP = s
End If
'
--- modified velocity due to loss of energy during penetration
vp = ((2 / m) * (ke - capacity)) ^ 0.5
Criterion B
Else, (i.e., If the impact severity is less than the structural capacity of the barrier
or if the structural capacity of the barrier is zero or unknown), the probability of
penetration is defined solely based on crash statistics (i.e., PRV) and this value is used to
C-127
“weight” the crash cost of any subsequent impacts. This value is provided on the Severity
worksheet in RSAPv3.
Else
WP = oHzrd_Prcnt_PRV(iAlt, K) / 100
'
--- Energy loss is assumed to be 30% for PRV penetrations
DeltaE = ke * 0.3
vp = ((2 / m) * (ke - DeltaE)) ^ 0.5
End If
Probability of Penetration due to Rolling Over Barrier (Trucks Only)
If the vehicle does not penetrate the barrier upon impact, the next possibility is
rolling over the barrier as the vehicle is trying to redirect. The probability of rolling over
the barrier is only considered in the analysis of truck trajectories and only when the
center-of-gravity of the truck is higher than the top of the barrier. An additional criterion
is used for only considering longitudinal barriers with heights ranging from 2.0 ft to 7.5 ft
height. The program calls the subroutine subRolloverBarrier to compute the rolloverratio parameter, which is used to determine the probability of the truck rolling over the
barrier. The equations in subroutine subRolloverBarrier are presented in the
ENGINEER’S MANUAL. The probability of rolling over the barrier is then computed
using the hyperbolic tangent model, as shown in Figure 41.
Probability of Rollover Barrier
1
0.9
0.8
0.7
0.6
0.5
0.4
0.3
0.2
0.1
0
0
0.2
0.4
0.6
0.8
1
Rollover Ratio
1.2
1.4
1.6
Figure 41. Probability model for trucks rolling over longitudinal barriers.
If {vehicle type} = {truck} _
And {hazard type} = {line} _
And {vehicle c.g.} > {hazard height} _
And {hazard height} > 2.0 _
And {hazard height} < 7.5 _
C-128
And v > 0 Then
Call subRolloverBarrier()
s=0
B=8
shift = 1.4
PRB = (1 - s) / 2 * Application.Tanh((ratio - shift) * B) + (1 - s) / 2 + s
‘ Compute change in velocity due to loss of energy during impact
‘ … change in energy during redirection along barrier
DeltaKEred = ke * Sin(Abs(Theta))
If ke - DeltaKEred - PEroll > 0 Then
v0rv = ((2 / m) * (ke - DeltaKEred - PEroll)) ^ 0.5
Else
v0rv = 0
End If
Else
PRB = 0
End If
The probability of rolling over the barrier is dependent on whether or not the
vehicle penetrated the barrier upon impact.
WRV = PRB * (1 - WP)
Probability of Rollover After Redirection
If the vehicle doesn’t penetrate the barrier and doesn’t roll over the barrier during
redirection, the next possibility is that the vehicle rolls over as it is redirecting from the
barrier. Redirection is not considered for Point hazards or for motorcycles. The
probability of passenger vehicles rolling over after redirection is determined solely from
crash statistics; whereas, the probability of trucks rolling over after redirection is
determined based on impact conditions, vehicle characteristics and barrier height. An
additional criterion is implemented which only considers rollover if the height of the
hazard is within the range of 2.25 to 7.5 ft.
WRR = 0
If {hazard type} = {line} And v > 0 Then
It was determined from review of full-scale crash tests that the typical loss of
kinetic energy could be approximated by multiplying the impact energy by the sine of the
impact angle.
DeltaKE = KE * Sin(Abs(Theta))
' reduction in energy during
redirection
Vr = ((2 / m) * (KE - DeltaKE)) ^ 0.5 ' redirection velocity
C-129
The following lines of code compute the probability of rollover after redirection
for trucks.
If {vehicle type} = {truck} _
And {hazard height} >= 2.25 _
And {hazard height} < 7.5 _
Then
The program calls the subroutine subRolloverTafficSide to compute the rolloverratio parameter, which is used to determine the probability of the truck rolling over the
barrier. The probability of rolling over the barrier is then computed using the same
hyperbolic tangent model that was shown in Figure 41.
Call subRolloverTrafficSide()
s=0
B=8
shift = 1
PRR = (1 - s) / 2 * App.Tanh((ratio - shift) * B) + (1 - s) / 2 + s
The probability of rolling over after redirection is dependent on whether or not the
vehicle penetrated the barrier upon impact or rolled over the barrier during redirection.
WRR = PRR * (1 - WP - WRV)
Trucks tend to only roll a quarter-turn onto their side, whereas' passenger vehicles
tend to roll multiple quarter-turns. The severity of rollovers for trucks is, therefore, likely
to be less than severity of rollovers for passenger vehicles; however, the baseline severity
(EFCCR65) for rollovers is currently the same value for all rollover events. The variable,
scalePOC, was defined here to scale the severity for truck rollovers if/when data warrant
it. The scale factor is applied to the EFCCR65 value as it is passed to
subCollision_Statistics for use in computing rollover-cost statistics.
scalePOC = 1 '
KK = {set hazard type to rollovers}
Call subCollision_Statistics(…, oHzrd_EFCCR65(iAlt, KK) *
scalePOC,…)
The following lines of code compute the probability of rollover after redirection
for passenger vehicles.
ElseIf VehCharac(iVeh, 4) = "C" Then
KK = {set hazard type to rollovers}
The probability of rollover after redirection is taken as the lesser value between:
One minus the percent of rollover-after-redirection provided on the RSAPv3
“Severity” worksheet and
the probability that penetration did not occur.
C-130
For example, if it was determined that the probability of penetrating the barrier was 0.99
and the percent of rollovers after redirection provided on the RSAPv3 “Severity”
worksheet was 0.04, then WRR would be taken as (1 - 0.99) = 0.01.
WRR = App.Min(1 - WP - WRV, oHzrd_Prcnt_RR(iAlt, K) / 100)
Call subCollision_Statistics()
End If
End If
Probability of Redirection
If the vehicle does not penetrate the barrier, and does not roll over the barrier
during redirection, and does not rollover after redirection, then final possibility is that the
vehicle exited from the hazard and its exit trajectory will have to be evaluated for
possible secondary collisions. As mentioned previously, redirection is not considered for
Point hazards or for motorcycles.
If {vehicle type} = {motorcycle} Then
WR = 0
Else
WR = 1 - (WP + WRV + WRR)
End If
Compute Effective Probability Statistics and Pass Back to Parent Module
The final step of this subroutine is to compute the effective probability of
redirection and penetration, which will be passed back to ModulePOCanalysis for use in
evaluating secondary collisions. For example, the effective probability of redirection is
computed as the probability of redirection given the current collision conditions times the
probability of the impact occurring.
Probability of Redirection
POR = WR * POC
Probability of Rollover after Redirection
PORV = WRV * POC
Probability of Penetration
POC = WP*POC
count_pene_PRVcapacity(K) = {cumulative capacity penetrations for hazard
K}
count_pene_rollvault(K) = {cumulative penetrations of hazard K from rollovervault}
SubRedirect
This subroutine is called by ModulePOCAnalysis to determine redirection paths
to be evaluated for subsequent impacts after redirection from the current hazard. The
redirection path is influenced by many factors including, impact angle, impact speed,
C-131
vehicle type, barrier type (i.e., rigid, semi-rigid, flexible, etc.), vehicle damage (e.g.,
wheel assembly damage), vehicle-to-barrier interaction (e.g., snagging), and driver
reaction, to name a few. In the context of an RSAPv3 analysis, however, only three
factors are considered: impact angle, barrier type and vehicle type. The influence of each
of these factors is discussed in more detail in the ENGINEER’S MANUAL.
The basic procedure is to (1) Determine the redirection speed, (2) Select
redirection paths (path coordinates relative to barrier’s local reference frame), (3) convert
path coordinates to the global reference frame and (4) send each selected path to
ModulePOCanalysis to evaluate for secondary collisions.
Input Variables
The following are a list of variables passed from the parent module and used in this
subroutine.
CSRL: collision side of barrier (right or left)
K: hazard number
iALT: current alternative
iVeh: current vehicle number
iDir: current traffic direction
oHzrd_GenType: general type of hazard (e.g., bridge rail, Guardrails_Rigid, etc)
POR: probability of redirection
Theta: impact angle
Theta_Haz: angle of hazard relative to roadway
v: impact velocity
VehCharac(*,1): RSAPv3 vehicle name
VehCharac(*,2): FHWA vehicle class
VehCharac(*,3): percent of traffic mix
VehCharac(*,4): RSAPv3 vehicle type (M, C, T)
VehCharac(*,5): vehicle weight
VehCharac(*,6): vehicle length
VehCharac(*,7): vehicle width
VehCharac(*,8): distance from cg to front of vehicle
VehCharac(*,9): cg height
VehCharac(*,10): crash cost adjustment factor
x: x-coordinate of initial redirection point
y: y-coordinate of initial redirection point
grid_inc: longitudinal increment of original trajectory path
Max_L: maximum length of original trajectory path
C-132
Program Variables
The following are a list of variables defined in the Module.
Grid_incR:
Max_Traj_xR:
nopcR:
num_preR:
POC: probability of occurrence for this trajectory path
Pass-Through Variables
The following are a list of variables that are not directly used in this subroutine but are
required in the probability of collision analysis of the redirection paths (i.e., call of
ModulePOCanalysis).
CountCSg: number of cross-section coordinates in CSglob
count_pene_RSAP:
count_RR:
CS: collision side (e.g. traffic side, non-traffic side)
CSglob: coordinates of global terrain cross-section
d0: distance to hazard coordinate
EFCCRi: total cumulative EFCCR the current trajectory
EFCCR_RR: cumulative EFCCR for rollover-after-redirection for current hazard
EFCCR_tot: cumulative EFCCR for the current hazard
iDP: departure point
iLDS: lane departure side
impact_Count_NTS:
impact_Count_tot:
impact_Count_TS:
oNum_Hazards: number of hazards in current alternative
oHzrd_Capacity: hazard capacity
oHzrd_Connection: Identifies LON hazard attached to END TERMINAL
oHzrd_EFCCR65: hazard severity (Effective Fatal Crash Cost Ratio for impact
speed of 65 mph)
oHzrd_Height: height of hazard (ft)
oHzrd_Name: hazard name (e.g., TL3FShapeBR)
oHzrd_Prcnt_PRVR: percent of penetration/vault from crash statistics
oHzrd_Prcnt_RR: percent of rollover after redirection from crash statistics
oHzrd_Type: hazard type
oHx: longitudinal coordinate of hazard with respect to global reference frame
oHy: lateral coordinate of hazard with respect to global reference frame
C-133
HM: slope of hazard with respect to global reference frame
num_traj_seg: cumulative number of trajectories for this segment
R: radius of hazard
Procedure
First, the new array variables which will be defined in these calculations are
dimensioned.
Dim xR(13, 100, 500)
Dim yR(13, 100, 500)
Dim thetaR(2)
Dim d0R()
ReDim d0R(total number of hazards, including rollover)
Redirection Speed
When vehicles impact against longitudinal barriers, some of the kinetic energy is
expended through various mechanisms. The result is a reduced velocity of the vehicle as
it redirects from the barrier system.
It is not possible to accurately calculate the exact reduction in kinetic energy of the
vehicle without conducting a detailed analysis of the crash event (e.g., finite element
analysis). It was determined from review of full-scale crash tests that the typical loss of
kinetic energy could be approximated by multiplying the impact energy by the sine of the
impact angle.
m = {vehicle weight} / 32.2 'lb-ft/s2 ' vehicle mass
KE = (1 / 2) * m * v ^ 2
' kinetic energy computed from impact
velocity
DeltaKE = KE * Sin(Abs(Theta)) ' change in energy during redirection from
hazard
vR0 = ((2 / m) * (KE - DeltaKE)) ^ 0.5
' redirection velocity
Select Redirection Paths
Determine Name of Worksheet with Redirection Trajectories
The redirection trajectory paths are selected based on vehicle type and barrier type and
are obtained directly from the predefined paths on the RSAPv3 worksheets.
redirection = {worksheet containing redirection trajectories, based on vehicle
type}
The direction of the local x-coordinate for the redirection trajectories is initialized to be in
the same direction as the impact trajectory.
grid_incR = Sheets(redirection).Cells(2, "E").value * (grid_inc / Abs(grid_inc))
Max_Traj_xR = 300
' Max trajectory length on Redirection
Grid
C-134
nopcR = Max_Traj_xR / Abs(grid_incR) - 1 ' number of path coordinates (nopc)
num_preR = 3
' number of data columns preceding path coordinates
Compute the sign of the slope for the redirection paths, where negative slopes change the
sign of lateral coordinates. For example:
negative slope:
o traffic-side impact on right-side of road (CSRL="left" side of hazard)
o non-traffic-side impact on left-side of road (CSRL="left" side of hazard)
positive slope:
o non-traffic-side impact on right-side of road (CSRL="right" side of
hazard)
o traffic-side impact on left-side of road (CSRL="right" side of hazard)
Where CSRL is an acronym for “Collision-Side-Right-or-Left”.
If CSRL = "left" Then
SignY = -1
Else
SignY = 1
End If
If the impact angle is greater than 90 degrees, then the x-coordinate of the redirection
path in the local reference frame (i.e., relative to the hazard) changes sign.
If Abs(Theta) > 90 * 3.14159 / 180 Then
SignX = -1
Else
SignX = 1
End If
Determine total number of redirection paths to be used in analysis
MyrowR = 4
' first row with path data
Do Until {there are no more rows of data}
If {hazard general type} = "BridgeRails" _
Or {hazard general type} = "Guardrails_Rigid" _
Or {hazard general type} = "MedianBarriers_Rigid" Then
BarrierType = "Rigid"
Else
BarrierType = "Non-Rigid"
End If
If the hazard type on the current row in the redirection trajectory database is equal to
BarrierType, then it will be included in the analysis.
C-135
If {barrier type in database} = BarrierType Then
trajR_tot = trajR_tot + 1 ' cumulative count of trajectories
End If
MyrowR = MyrowR + 1 ' next redirection trajectory
Loop
Read redirection path coordinates from RSAPv3 worksheet
MyrowR = 4
' first row with path data
Do Until {there are no more rows of data}
If {hazard general type} = "BridgeRails" _
Or {hazard general type} = "Guardrails_Rigid" _
Or {hazard general type} = "MedianBarriers_Rigid" Then
BarrierType = "Rigid"
Else
BarrierType = "Non-Rigid"
End If
If the hazard type on the current row in the redirection trajectory database is equal to
BarrierType, then include its trajectory path in the analysis.
If {barrier type in database} = BarrierType Then
A constant deceleration of 12 ft/s2 is assumed for all the redirection paths.
decelR = 12
' (ft/s2)
Initialize the minimum and maximum extents of the redirection trajectory paths. Recall
that these parameters are used in ModulePOCanalysis to determine if a hazard is within
reach of the path; if not, the path is not evaluated.)
MinY = 1000000#
MaxY = -1000000#
Initialize starting coordinates of redirection path.
x0 = x
y0 = y
Read in the redirection path coordinates for the currently selected row of data and correct
for local path direction relative to the hazard’s local reference frame.
For j = 1 To {total number of path coordinates}
xL = {x-coordinate value} * SignX
yL = {y-coordinate value} * SignY
C-136
Transform from Local to Global Reference Frame
The local x-coordinate direction of each trajectory is co-linear with the line of the hazard.
The following lines of code transforms the coordinates from the local reference frame to
the global coordinate system for the analysis.
xR(iVeh, i, j) = xL * Cos(-Theta_Haz) + yL * Sin(-Theta_Haz)
yR(iVeh, i, j) = -xL * Sin(-Theta_Haz) + yL * Cos(-Theta_Haz)
Determine minimum and maximum extent of redirection paths, and determine the
maximum length of the path.
If yR(iVeh, i, j) < MinY Then
MinY = yR(iVeh, i, j)
End If
If yR(iVeh, i, j) > MaxY Then
MaxY = yR(iVeh, i, j)
End If
If j = 1 Then
MaxL = (yR(iVeh, i, j) ^ 2 + xR(iVeh, i, j) ^ 2) ^ 0.5
Else
MaxL = MaxL + {((yRj - yRj-1))2 + (xRj - xRj-1))2 ) ^ 0.5}
End If
Next j
Each selected trajectory path is assigned equal probability of occurrence. Thus, the
probability of occurrence (i.e., POC) for a given trajectory path is computed as: the
probability that a redirection event occurred (i.e., POR) times the probability that the
current path will occur (i.e., 1/number of paths)
POC = POR * (1 / trajR_tot)
Set redirection-flag to 1 to indicate that this is a redirection path. This flag is used in
ModulePOCanalysis to determine if various collision events will be considered (e.g.,
rollovers are not considered for redirection trajectories since they were already accounted
for in subroutine subPenetrate).
redir_flag = 1
Call ModulePOCanalysis to Evaluate Path for Secondary Collisions.
The program calls ModulePOCanalysis to perform the collision-analysis task, where each
trajectory is individually examined for possible collisions with hazards; the collision
statistics are computed and stored in the appropriate data collectors; and these data are
then returned to the main program (i.e., ModulePOCmain) for processing. The
programming details of ModulePOCMain were presented earlier.
Call sub_Impact_Search()
End If
C-137
Move to next trajectory case in the database and repeat analysis procedure.
MyrowR = MyrowR + 1 ' next redirection trajectory
Loop
End Sub
SubRolloverM2a
This module is called by ModulePOCanalysis to update the variables in the rollover
algorithm at each increment of the trajectory path. The probability of rollover at each
increment is a function of the incremental length of the trajectory, Li. The general
procedure is as follows: At each increment, the program (1) determines the probability of
rollover for the current increment (i.e.,
|
∗
, ∗
, , (2) updates the
effective probability of rollover for the trajectory path and (3) updates the average
velocity cubed at each increment for use later in subroutine SubRoloverM2b for
computing rollover costs. The flow chart for this program module is shown in Figure
42.
C-138
Figure 42. Flow chart for subroutine subrolloverM2a.
C-139
Input Variables
The following are a list of variables passed from the parent module and used in this
subroutine.
CountCSg: number of coordinates in global cross-section profile
CSglob(*,1): y-coordinate value of global cross-section profile
CSglob(*,2): z-coordinate value of global cross-section profile
CSglob(*,3): slope of global cross-section
CSglob(*,4): baseline probability of rollover
CSglob(*,5): vertical-grade adjustment factor for rollover
CSglob(*,6): horizontal-curve-radius adjustment factor for rollover
Program Variables
The following are a list of variables defined in the subroutine.
Lj: length of trajectory increment
POR: probability of rollover
SumPRslopexL: cummulative sum of P(R|CSslope)*Lj
SumV3:cumulative sum of cubed-velocities
V3avg: average cubed-velocity
Procedure
Initialize probability of rollover to a value of zero.
POR = 0 ' initialize Probability to 0
The baseline probability of rollover (POR) is determined by associating the location of
the current increment with the probability of rollover statistics in the array variable
CSglob.
i=1
Do While POR = 0 And i <= CountCSg
If y < CSglob(i, 1) Then POR = CSglob(i, 4) * CSglob(i, 5) * CSglob(i, 6)
i=i+1
Loop
The next step is to update the effective probability of rollover for the trajectory path,
which is computed as the cumulative sum of the probability of rollover at each increment.
SumPRslopexL = SumPRslopexL + POR * Lj
The following lines of code update the average cubed-velocity at each increment for use
in later in subroutine SubRoloverM2b for computing rollover costs.
SumV3 = SumV3 + v ^ 3
V3avg = SumV3/ N
C-140
End Sub
SubRolloverM2b
This subroutine is called by ModulePOCanalysis to compute the probability of
rollover and associated rollover-crash costs. When a collision is detected in
ModulePOCanalysis, the probability of occurrence must be determined in order to
compute the statistical cost of the collision event. The probability of occurrence (POC) is
dependent on the complete history of trajectory path up to the current path coordinate,
including impact with previous hazards and the probability of rollover occurring prior to
impact with the current hazard. For example, if a trajectory path first intersects one
hazard and then another, then the probability of the second impact occurring is dependent
on the vehicle getting to the first hazard without rolling over, penetrating the first hazard,
not rolling over after the penetration, and not reaching zero velocity prior to collision
with the second hazard.
This section of the program computes the probability of the trajectory resulting in
a rollover before reaching the hazard. The basic procedure is to (1) compute the
probability of a rollover based on trajectory path length since the last collision event,
roadway/roadside conditions and probability of getting to the current path location, (2)
compute the expected crash cost for the rollover event based on the average velocity
cubed and probability of occurrence, and (3) return relevant statistical information to
ModulePOCanalysis. The flow chart for this program module is shown in Figure 43.
C-141
Figure 43. Flow chart for subroutine subRolloverM2b.
Input Variables
The following are a list of variables passed from the parent module and used in this
subroutine.
CS: collision side (i.e., traffic or non-traffic side)
Haznum: total number of defined hazards
LT: total length of trajectory path computed from Trajectory Grid in
ModulePOCtraj
POCroll0: Effective probability of rollover at time of previous collision event
C-142
POC: probability of occurrence
SumPRslopexL: cummulative sum of P(R|CSslope)*Lj
Proll0: Probability of rollover before previous event (e.g., if no prior collision
occurred for this trajectory path, then Proll0 = 0
V3avg: average cubed-velocity
Program Variables
The following are a list of variables defined in the subroutine.
K: hazard number
POCroll: Effective probability of rollover used in crash cost calculations (i.e.,
probability of rollover given roadside and impact conditions times the probability
of the trajectory getting to this point)
Proll2: Probability of rollover since previous event
Vavg: Effective average velocity used in crash cost calculations
Procedure
The first step is to compute the probability of a rollover since the last collision
event based on roadway/roadside conditions (i.e., Proll2). The following line of the code
calculates Proll2 as the total probability for rollover from the point of encroachment to
the current trajectory position minus the probability of rollover from the point of
encroachment to the previous collision event.
Proll2 = SumPRslopexL / LT - Proll0
For example, Figure 44 illustrates a trajectory path intersecting two hazards. In
Figure 44a, the vehicle is about to impact the first hazard at Point B. In this case,
|
∗
,
∗
,
∗
Where SumPRslopexL is the sum of the probabilities for rollover at each
increment of the path from Point A to Point B, LT is the maximum length of the path (i.e.,
length from Point A to Point E) and Proll0 is zero (i.e., there were no events prior to the
encroachment at Point A). In Figure 44b, SumPRslopexL is the sum of the probability for
rollover at each increment of the path from Point A to Point D, LT is the maximum length
of the path (i.e., length from Point A to Point E) and Proll0 is the sum of the probability
for rollover at each increment of the path from Point A to Point B.
C-143
A
Line Hazard
L1
B
E
End of trajectory
Point Hazard
(a) Impact with first hazard
A
Line Hazard
L1
B
C
E
L2
End of trajectory
D
Point Hazard
(b) Impact with second hazard
Figure 44. Illustration of trajectory path intersecting two hazards.
The next step is to compute the “effective probability for rollover” along the
current path segment. The “effective probability for rollover” is defined as the probability
of rollover given the various roadway and roadside conditions (i.e., Proll2) times the
probability that the vehicle penetrated the previous hazard.
POCroll = Proll2 * POC / (1 - POCroll0)
The term POC/(1-POCroll0) in the equation above represents the probability that
the vehicle penetrated the previous hazard, where POC can be defined as:
∗
Where POC0 is the probability of collision with the previous hazard, PenHaz0 is
the probability of penetrating the hazard, and POC is the resulting probability of the
vehicle getting to the current increment. The term POCroll0 = 1 – POC0, thus:
1
0
1
∗
1
C-144
The next step is to compute the average crash-cost for a rollover along the current
segment of the trajectory path. The crash cost is based on the velocity cubed (v3) at the
time of rollover. Recall that in subRolloverM2a the velocity cubed was computed at each
increment along the path and stored in variable V3avg. This value could be used directly
in the calculation of EFCCR; however, the subroutine SubCollision_Statistics, which is
used to compute crash-cost statistics, requires velocity as input. The representative
velocity for computing the crash-costs is then computed as:
vavg = (V3avg) ^ (1 / 3)
The program then calls the subroutine subCollision_Statistics.
K = Haznum + 1 ' sets the array position to rollover hazard
CS = "TS"
' set Colloision Side to CS for counting the number of rollovers
Call subCollision_Statistics()
The probability that the vehicle continues on without rolling over is then computed and
returned to ModulePOCanalysis.
POC = (POC - POCroll)
The variables POCroll0 and Proll0 are computed and saved for subsequent rollover
calculations.
POCroll0 = 1 - POC
Proll0 = SumPRslopexL / LT
End Sub
SEVERITY MODULE
The severity module is interwoven with the crash prediction module since the
severity of each crash predicted must be estimated. The severity module is represented
by the following term in the RSAP governing equation:
|
∩
There are actually relatively few severity calculations within RSAP since the
database of EFCCR values serves as a measure of the severity of each likely crash. As
described in the last chapter, when a collision is detected in the crash prediction module
the EFFCR corresponding to the hazard struck and the speed of the vehicle is obtained
from the Severity worksheet. All the EFCCR values for each hazard interacted with
along the vehicle’s trajectory are summed and this summation is the EFCCR for that
particular trajectory.
Background for developing and adding EFCCR values to the Severity worksheet
database are described in the Engineer’s Manual.
C-145
BENEFIT-COST MODULE
When conducting a benefit-cost analysis a benefit-cost ratio (B/C) for each
feasible alternative with benefits in the numerator and agency costs in the denominator.
Project benefits, in this case, are defined as a reduction in crash costs. Project costs
include the design, construction, and maintenance costs associated with the improvement
as well as repairs required due to crashes predicted on the segment.
RSAPv3 determines the crash costs of each user entered roadside design
alternative as described in the previous chapters. The results of the final module are
converted to a monetary unit of measure for direct comparison with project costs. The
B/C ratio, therefore, is unitless. The benefit-cost ratio (BCR) is defined as follows:
BCRi/j=
Where:
BCRi/j= Incremental BCR of alternative j with respect to Alternative i
CCi , CCj = Annualized crash cost for Alternatives i and j
DCi , DCj = Annualized direct cost for Alternatives i and j
For each alternative, an average annual crash cost is calculated by summing the
expected crash costs for the predicted crashes. Theses crash costs are then normalized to
an annual basis. Any direct costs, as defined by the user (i.e., initial installation and
annual maintenance) are also normalized using the project life and the discount rate to an
annualized basis and the BCR is calculated.
The macros that execute the benefit-cost module are contained in moduleResults.
The actual benefit-cost calculations are done as worksheet functions on the Results
worksheet.
PROCEDURE
featureResults()
This macro is executed automatically when the Results worksheet is activated and
also when the “Feature Report” button is selected as shown in Figure 18. The purpose of
the macro is to process the crash prediction and severity information stored on the
hidden shPOCscrach worksheet and display it as a summarized report of the collisions
with each roadside feature (i.e., hazard) defined in the alternatives. The procedure is as
follows:
Start At row 10
Search Column A until the value is blank
myRow=The row before the blank column is the last row
Sort range A10:myRow21) by :
Column 2: Alternative number
Column 1: Segment number
Column 8: Hazard number
Column 4: Traffic side
C-146
Column 5: Vehicle type
Print the run date, time, Excel version and RSAP version in the Feature Report
Select shPOCscratch.Range(B11) the alternative column
‘Set up initial values
Row=9
Totalcrash=0
Prvcrash=0
Redirectrollcrash=0
Vsl=shPrjInfo.Range(F18).value value of statistical life
Clear shResults.Range(A9:I5000)
Do Until alternative is blank
‘Read the row of data from shPOCscratch
Alt=selection.offset(0,0)
‘the alternative number
Seg=selection.offset(0,-1)
‘the segment number
Haz=selection.offset(0,6)
‘the hazard number
Hazname=selection.offset(0,5)
‘the hazard name
Vehicle=selection.offset(0,3)
‘the vehicle type
numEncr=selection.offset(0,4)
‘number of encroachments
encrType=selection.offset(0,1) & selection.offset(0,2)
‘read the number of expected encroachments for each encr type
Select Case encrType
Case “PR”
Encr=shRdSegs.cells(13+seg,”G”)
Case “PL”
Encr=shRdSegs.cells(13+seg,”H”)
Case “OR”
Encr=shRdSegs.cells(13+seg,”I”)
Case “OR”
Encr=shRdSegs.cells(13+seg,”J”)
Case Else Error message
End Select
‘Find the vehicle cost adjustment and traffic mix
I=14
Do Until shTraffInfo.cells(I,4).value=””
If shTraffInfo(cells(I,4).value=vehicle then ‘look for a match
vehicleMix=shTraffInfo.cells(I,3)
Exit Do
End If
C-147
I=I+1
Loop
‘Read in the number of events for the row
Num_crashes=selection.offset(0,8)+selection.offset(0,9) ‘crashes
Num_prv=selecton.offset(0,14)
‘penetrations, rolls, vaults
Num_reroll=selection.offset(0,15)
‘redirection rollovers
If numEncr>0 then
‘Estimate the total number of crashes and the crash cost
If Num_crashes is not 0 or blank then
Totalcrash=(Num_crashes*encr/NumEncr)*vehicleMix
Crashcost=vsl*selection.offset(0,12)*encr)*vehicleMix
Else
Totalcrash=0
Crashcost=0
End if
‘Estimate the Penetration-Rollover-Vault crashes
If Num_prv is not 0 or blank then
Prv_crash=(Num_prv*encr/NumEncr)*vehicleMix
Else
Prv_crash=0
End if
‘Estimate the Redirection Rollover crashes
If Num_reroll is not 0 or blank then
redirectionrollcrash=(Num_reroll*encr/NumEncr)*vehicleMix
+redirectionrollcrash
Crashcost=(vsl*selecton.offset(0,19)*encr)*vehicleMix
+Crashcost
Else
redirectionrollcrash=0
End if
End if
segResults()
This macro calculates the segment cost information by summing portions of the
feature report by segment and alternative. This macro is activated when the “Segment
Report” button is selected and results in a view similar to that shown earlier in Figure 16.
C-148
printReports()
This macro prints the three reports shown on the Results worksheet using the
worksheet PrintOut and PageSetUp methods. The resulting printouts are identical to
what is displayed in the three reports on the Results worksheet. The procedure is as
follows:
Enable the Excel Ribbon Toolbar
Top Row is 9
Do Until the cell ROW column C is blank
Bottom Row =Row
Set featurerange= shResults.range(cells(1,”B”),cells(BottomRow,”J”)
With shResults
Make all columns visible
Clear PrintArea
‘Print Feature Report
PageSetUp.PrintArea=featurerange
PrintOut to print with1 copy and Preview=TRUE
Print Segment Report
PageSetUp.PrintArea=N1:AA43
PrintOut to print with1 copy and Preview=TRUE
Print Benefit-Cost Report
PageSetUp.PrintArea=AB1:AH15
PrintOut to print with1 copy and Preview=TRUE
End With
Turn off Excel Ribbon Toolbar
DEVELOPMENT AND MAINTENANCE TOOLS
RSAPv3 contains a variety of macros that are used as development and
maintenance tools. These macros are not normally needed by the user but are useful
when adding lookup tables, debugging and other software maintenance tasks.
Auto_Open()
This macro was previously discussed and described in the Project Input and
Control Chapter to which the reader should refer. This macro unloads any currently
running forms to avoid conflicts, hides the Excel toolbars, loads the splash screen for 5
seconds and then unloads it. The macro then calls the macro StartRSAP which starts the
RSAP execution.
C-149
editSeverities()
This macro is a toggle macro that is turned on and off by selecting the key stroke
CTRL+SHIFT+H. The first toggle stops the execution of RSAP and puts Excel into a
conventional editing model. The second toggle removed the standard Excel ribbons, reprotects the worksheet and restarts RSAP. The second toggle also rebuilds the hazard
menusm on shPrgData. The procedure is as follows:
Select the Severity Worksheet
Detect the mode by whether the display headings are on or off
If ActiveWindow.DisplayHeadings = True Then turn off edit mode and re-start
Count number of rows in shSeverity
botRow = Count - 1
Sort the hazard data into hazard category order
Copy hazard names to the Program Data worksheet
Reset the data range names on shPrgData using ActiveWorkbook.Names
Set the display back to usual RSAP mode
shSeverity.Select
ActiveWindow.DisplayHeadings = False
Application.DisplayFormulaBar = False
shSeverity.Protect (shPrgData.Range("B6").value)
shPrgData.Protect (shPrgData.Range("B6").value)
shPrgData.Visible = xlVeryHidden
Application.ExecuteExcel4Macro
"SHOW.TOOLBAR(""Ribbon"",false)"
Re-start RSAP with StartRSAP
Else
Unload frmRSAPcontrols stops execution of RSAP
Restore usual Excel display settings
ActiveWindow.DisplayHeadings = True
Application.DisplayFormulaBar = True
shSeverity.Unprotect (shPrgData.Range("B6").value)
Application.ExecuteExcel4Macro
"SHOW.TOOLBAR(""Ribbon"",true)"
End If
EditSheet()
This macro is very similar to editSeverities, the only difference being that the
hazard validation binding for the menus are not rebuilt. The macro simply turns the
Excel edit mode on and off. This macro is also a toggle where the key stroke
CTRL+SHIFT+E is used. The first toggle returns the control to the usual Excel
functionality and the second toggle puts the system back into RSAP mode and restarts
C-150
RSAP. The marco works on whatever worksheet is active at the time the toggle is
selected. The procedure is as follows:
Select the ActiveWorksheet
Detect the mode by whether the display headings are on or off
If ActiveWindow.DisplayHeadings = True Then turn off edit mode and re-start
Set the display back to usual RSAP mode
shSeverity.Select
ActiveWindow.DisplayHeadings = False
Application.DisplayFormulaBar = False
ActuveWorksheet.Protect (shPrgData.Range("B6").value)
Application.ExecuteExcel4Macro
"SHOW.TOOLBAR(""Ribbon"",false)"
Re-start RSAP with StartRSAP
Else
Unload frmRSAPcontrols stops execution of RSAP
Restore usual Excel display settings
ActiveWindow.DisplayHeadings = True
Application.DisplayFormulaBar = True
ActiveWorksheet.Unprotect (shPrgData.Range("B6").value)
Application.ExecuteExcel4Macro
"SHOW.TOOLBAR(""Ribbon"",true)"
End If
killSplash()
This macro, which is called from the Auto_Open() macro, simply unloads the
splash screen form after it has been displayed for 5 seconds.
RangeisMT()
This macro tests a range to determine if there are any values in the range. The
variable testRange is passed to the macro and tested for blank values using the range
method “Find”. The procedure is:
Set test=testRange.find(“”, LookIn:=xlValues)
If test is nothing then
RangeisMT=FALSE
Else
RangeisMT=TRUE
End if
This function is used in several subroutines to test if there is data in the specified
range.
C-151
showRowsCols()
This is a useful macro for debugging. The macro is a toggle much like
editSeverity() and editSheet(). The macro turns on all Excel toolbar functions, makes all
sheets visible and makes the row and column labels visible.
StartRSAP()
This macro was previously discussed and described in the Project Input and
Control Chapter to which the reader should refer. This macro is called by the
Auto_Open() macro but can also be executed using the key stroke CTRL+S. This is the
macro that actually starts RSAP.
CONCLUSIONS
The preceding chapters and sections have described the architecture of RSAPv3,
it event-control structure and user input facilities. The algorithms used for the analysis
were presented with pseudo-code and flow charts. This manual should provide all that is
necessary for a programmer needing to modify, update or otherwise revise RSAPv3.
C-152
REFERENCES
Bligh04
Bligh, R.P., Shaw-Pin Miaou, and King K. Mak, “Recovery Area
Distance Relationships for Highway Roadside,” National Cooperative
Highway Research Program Project 17-11, Washington, DC, 2004.
FHWA91
Supplemental Information for Use with the ROADSIDE Computer
Program, Federal Highway Administration, Washington, DC, August
1991.
Mak10
Mak, K.K., Sicking, D.L., and B. A. Coon, “Identification of
Vehicular Impact Conditions Associated with Serious Ran-off-Road
Crashes,” National Cooperative Highway Research Program Report
665, Transportation Research Board, Washington, D.C., 2010.
C-153