1
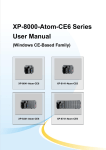
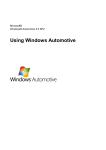
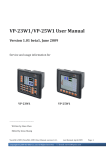
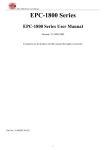
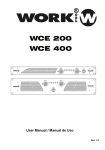
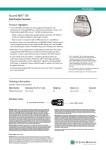
How to Remote Debug on Windows-CE devices with Microsoft Visual Studio Author: Tony Liu Document History: Doc Version Date Author Comment 1.0 2013/9/25 Tony Liu First edition 1.1 2013/11/05 Ryan Tsai Add exception processing 1.2 2014/10/01 Ryan Tsai Modify context and add troubleshooting 1.3 2014/12/26 Quentin Lee Modify context 1. Introduction This manual contains the information you need to remote debug on Windows-CE devices based target device. Advantech provides library and sample code which allows developers and end users to connected I/O modules, perform configurations, and simple testing of the I/O. This manual also supplies information about how to apply Advantech DiagAnywhere software to remote control Advantech controllers, including accessing remote desktop and file transfer. 1.1. Organization of This Manual This user manual is divided into the following sections: Introduction Setup environment Start Debugging Troubleshooting Introduction This section gives the user a basic idea of this manual. Setup environment This section describes how to set up remote debug environment. Start Debugging This section gives the user step-by-step procedures of remote debugging. Troubleshooting This section provides troubleshooting information and procedures for remote debugging. 2. Setup environment This section describes how to set up your remote debug environment on host PC and the target device. 2.1. Target Device You need to copy the CoreCon files to target device. On the development computer, these files are automatically installed when you install Microsoft Visual Studio. They typically install to C:\Program Files\Common Files\Microsoft Shared\CoreCon\1.0\Target\wce400\<Hardware Platform> For APAX-5520/5620, which is based on the ARM hardware platform, these files are in C:\Program Files\Common Files\Microsoft Shared\CoreCon\1.0\Target\Wce400\ armv4i; For APAX-6572 ADAM-5560, copy files in x86 directory. The CoreCon files to copy to target device are: Clientshutdown.exe Cmaccept.exe ConmanClient2.exe DeviceDMA.dll eDbgTL.dll TcpConnectionA.dll Now, we apply Advantech DiagAnywhere to transfer the above files to the target device. For example, we create a folder named “WinCEDebug” under “Harddisk” on target device, and then copy CoreCon files to the folder. 2.2. Host PC You have to configure Microsoft Visual Studio for debugging. In Visual Studio, go to the Tools menu and click Options. You will then be prompted for the options dialog box. Expand Device Tools and click Devices. Under Show devices for platform, select Windows CE. Set Windows CE Device as default device. Select Windows CE Device in Devices list and press Properties to set connection configuration. Set default output location as Program Files Folder. Under Transport, select TCP Connect Transport and click Configure. You will then be prompted for the TCP/IP transport window. Select Use specific IP address, and enter the target device’s IP address. Click OK as needed to exit the dialog box. 3. Start Debugging Now that you have set up Visual Studio to connect to target device, you need to prepare target device to connect to Visual Studio. 3.1. Connect to Visual Studio You can connect to target device by using Advantech DiagAnyhwhere. Click “Start->Programs->Command Prompt” and open a command prompt. Navigate to the directory to which we copied the connectivity files. For more detailed information about directory path, see Chapter 2.1. At the command prompt, type conmanclient2. Open another command prompt, type: cmaccept. Note! Quickly move to the next step because you have only three minutes to initiate a connection between your development computer and your device. 3.2. Start to Debug Now, you can deploy your application for debugging. Open the program you want to debug and set break points. In the Visual Studio, on the Debug menu, click Start Debugging. You will then be prompted for the dialog box. Select Windows CE Device and click Deploy. Visual Studio will connect to your device and download your application onto it. Note! On target device, the system will create the program folder under Program Files and copy your application automaticity while starting to debug. If you encounter the problem below, it means that your program calls functions in DLL file. You have to copy you DLL file from host PC to target device. You can apply Advantech DiagAnywhere to transfer DLL files to program folder on target device. The program folder can be found under Program Files. After the program has been successfully deployed, you will see the program was stopped at break point. On target device, you will see the program halts. You can resume the program by issuing another debugging command, such as continue, step, or next. Now, it is your turn to debug all your stuff. 4. Troubleshooting 4.1 ActiveSync bootstrap initialization failed In host PC, execute the command “del /s "%USERPROFILE%\Local Settings\Application Data\Microsoft\Corecon\*.*” under command prompt. On target device, you have to connect to visual studio again. For more detailed information about how to reconnect, see Chapter 3.1. 4.2 Mapping path failed If you encounter this problem, check the following information on target device: Check whether the program fold exists under Program files. For more detailed information, see Chapter 2.2. Check whether the dynamic link library (.dll) exists in the specified folder. For more detailed information, see Chapter 3.2. 4.3 conmandClient2 execute abnormal On the target device, close command prompt and execute conmandClient2 again.