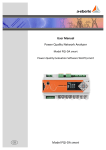
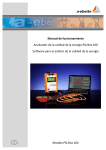
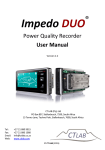
Download User Manual Power Quality Network Analyser Model PQI
Transcript
User Manual Power Quality Network Analyser Model PQI-DA smart Power-Quality Evaluation Software WinPQ smart g Model PQI-DA smart We take care of it. Note: Please note that these operating instructions may not always contain the latest information concerning the device. If, for example, you have changed the firmware of the device to a higher version via the Internet, this description will no longer be completely accurate. In this case, contact us directly or use the latest version of the operating instructions available from our Internet site (www.a-eberle.de). A. Eberle GmbH & Co. KG Frankenstraße 160 D-90461 Nuremberg Telephone: 0911 / 62 81 08 0 Fax: 0911 / 62 81 08 99 E-Mail: [email protected] Internet: www.a-eberle.de A. Eberle GmbH & Co. KG does not accept any liability for damage or losses of any kind arising from printing errors or changes in this manual. Furthermore, A. Eberle GmbH & Co. KG will not accept any liability for loss or damage of any kind resulting from faulty equipment or devices that have been modified by the user. Copyright 2014 A. Eberle GmbH & Co. KG Subject to change without prior notice. Page 2 Table of Contents 1. User prompt .................................................................................................................. 6 1.1 Warnings ...................................................................................................................................6 1.2 Notes .........................................................................................................................................6 1.3 Other symbols ...........................................................................................................................6 2. Scope of Delivery/Order Codes ....................................................................................... 7 2.1 Scope of Delivery ......................................................................................................................7 2.2 Order Codes ..............................................................................................................................7 3. Safety instructions ........................................................................................................10 4. Technical Data ..............................................................................................................11 4.1 PQI-DA smart Description ...................................................................................................... 11 4.2 Technical Data ........................................................................................................................ 13 4.3 Mechanical design ................................................................................................................. 18 4.3.1 Power supply for PQI-DA smart ............................................................................................. 20 4.4 Mains connection for PQI-DA smart ...................................................................................... 21 4.4.1 3-phase / 4-wire connection .................................................................................................. 21 4.4.2 4-wire connection without neutral current ........................................................................... 22 4.4.3 4-wire 1-phase ....................................................................................................................... 23 4.4.4 3-phase / 3-wire connection .................................................................................................. 24 4.4.5 V connection; Aron connection ............................................................................................. 25 4.5 Measurement / Functions...................................................................................................... 26 4.5.1 Continuous Recording: ........................................................................................................... 26 4.5.2 PQ Events ............................................................................................................................... 29 4.5.3 Recorder triggering ................................................................................................................ 29 4.5.4 Output relays ......................................................................................................................... 30 4.5.5 Memory management ........................................................................................................... 30 5. Operation of the PQI-DA smart ......................................................................................32 5.1 Getting started - Wizzard ....................................................................................................... 32 5.2 Display .................................................................................................................................... 36 5.3 Setup display .......................................................................................................................... 40 5.3.1 Parameter .............................................................................................................................. 41 5.3.2 Time settings .......................................................................................................................... 44 5.3.3 Basic setting ........................................................................................................................... 49 5.3.4 Password lock device display ................................................................................................. 50 5.3.5 Memory management ........................................................................................................... 51 Table of Contents Page 3 We take care of it. 5.3.6 Setting up the device interfaces ............................................................................................. 51 6. WinPQ smart software ................................................................................................. 52 6.1 Installing the evaluation software .......................................................................................... 52 6.2 Basic setting for Software ....................................................................................................... 54 6.3 Setting up a new PQI-DA smart .............................................................................................. 55 6.4 Device parameterisation......................................................................................................... 56 6.4.1 Device designation .................................................................................................................. 57 6.4.2 PQ Parameter.......................................................................................................................... 58 6.4.3 General user settings .............................................................................................................. 59 6.4.4 Trigger parameter for disturbance recorder .......................................................................... 61 6.4.5 Oscilloscope recorder ............................................................................................................. 62 6.4.6 ½ cycle recorder ...................................................................................................................... 63 6.4.7 Control of recording via binary inputs .................................................................................... 64 6.4.8 Recordings parameter ............................................................................................................ 65 6.4.9 Disturbance recoder parameter ............................................................................................. 66 6.5 Online measurement values ................................................................................................... 67 6.5.1 Measurement values .............................................................................................................. 67 6.5.2 Vector diagram ....................................................................................................................... 68 6.5.3 Oscilloscope image ................................................................................................................. 68 6.5.4 Harmonic................................................................................................................................. 69 6.5.5 Interharmonics........................................................................................................................ 70 6.5.6 Frequency bands from 2kHz to 9kHz ...................................................................................... 71 6.5.7 Device panel............................................................................................................................ 72 6.5.8 Software trigger ...................................................................................................................... 72 6.6 Measurement data import ..................................................................................................... 73 6.7 Deleting measurement data in the device memory ............................................................... 77 6.8 Evaluating measurement data offline .................................................................................... 78 6.8.1 Edit measurement data .......................................................................................................... 79 6.8.2 EN50160 report ...................................................................................................................... 82 6.8.3 Voltage harmonics - interharmonics ...................................................................................... 82 6.8.4 Currentharmonics – Interharmonics ...................................................................................... 83 6.9 Importing measurement data from an SD card ...................................................................... 85 7. Firmware update for PQI-DA smart ............................................................................... 86 7.1 Firmware update with software WinPQ smart....................................................................... 86 7.2 Firmware update with SD-memory card ................................................................................ 87 8. License Update PQI-DA smart ....................................................................................... 88 Page 4 Table of Contents 9. SCADA ..........................................................................................................................89 9.1 Modbus .................................................................................................................................. 89 9.2 Modbus data list .................................................................................................................... 89 9.3 Modbus settings..................................................................................................................... 89 9.3.1 Modbus RTU........................................................................................................................... 90 9.3.2 Modbus TCP ........................................................................................................................... 90 9.4 IEC60870-104 ......................................................................................................................... 91 9.5 IEC60870-104 Data point ...................................................................................................... 91 10. Intended use .................................................................................................................91 11. Measurement data – measurement methods PQI-DA smart ..........................................92 12. Service ........................................................................................................................ 101 13. Disposal ...................................................................................................................... 101 14. Product Warranty ....................................................................................................... 102 Table of Contents Page 5 We take care of it. 1. User prompt 1.1 Warnings Types of warnings Warnings are distinguished by the type of risk they represent by the following signal words: 0 → Danger warns of a risk of death 0 → Warning warns of physical injury 0 → Caution warns of damage to property Structure of the warnings Nature and source of the danger Actions to avoid the danger. SIGNAL WORD 1.2 Notes Notes on appropriate use of the device 1.3 Other symbols Instructions Structure of the instructions: Guidance for an action. Indication of an outcome, if necessary. Lists Structure of unstructured lists: 0 List level 1 – List level 2 Structure of numbered lists: 1) List level 1 2) List level 1 1. List level 2 2. List level 2 Page 6 User prompt 2. Scope of Delivery/Order Codes 2.1 Scope of Delivery 2.2 0 PQI-DA smart 0 User Manual 0 TCP-IP Cable 0 Calibration certificate 0 CD WinPQ smart Software Order Codes PQI-DA smart This version of the device is used as power quality analyser, sequence of events recorder, data logger and power meter Option IEC61000-4-7 (sampling rate 40.96kHz) 0 10.24kHz sampling rate; without measuring 2kHz to 9kHz 0 Measuring the frequency of voltage and current from 2 kHz to 9 kHz B0 B1 Oscillograph with 40.96kHz sampling rate The 2kHz to 9kHz option (41kHz sampling rate for oscilloscope images) can be upgraded via a licence code. Scope of Delivery/Order Codes LEREF "Verzeichnis Ueberschrift" \* MERGEFORMAT Index Page 7 We take care of it. Characteristic Code Power Quality Interface for Low and Medium Voltage Networks PQI-DA smart 0 0 0 0 0 4 voltage converters, 4 current transformers In accordance with DIN EN-50160 and IEC 61000-4-30 (Class A) 2 digital inputs 2 relay outputs WinPQ smart software for PQI-DA smart Supply voltage 0 AC 90 V..110 V..264 V or DC 100 V..220 V..300 V 0 DC 18 V...60 V...72 V H1 H2 Current inputs 0 4 current inputs for metering circuit 1A/5A (range 10A) 0 4 current inputs for protection circuit 1A/5A (range 100A) C30 C31 Option communication protocol 0 Modbus RTU & TCP 0 IEC 61870-5-104 (RJ45) 0 IEC61850 (RJ45) P0 P1 P2 Option IEC61000-4-7 (40,96kHz sampling) 0 10,24kHz sampling; without 2kHz to 9kHz measurement 0 Frequency measurement of voltage and current from 2 kHz to 9 kHz B0 B1 40.96kHz sampling oscilloscope recorder Rated value of the input voltage 0 100V / 400 V / 690 V (CAT IV 300V) Operating instructions 0 0 0 0 0 0 0 German English French Spanish Italian Chinese Russian Page 8 G1 G2 G3 G4 G5 G6 G7 Scope of Delivery/Order Codes Software WinPQ smart Code Software WinPQ smart WinPQ smart For parameterising PQI-DA smart, as well as reading PQI-DA smart measurement data and online / offline data – sold as a package WinPQ database Code Software WinPQ WinPQ For the parameterisation, archiving and analysis of PQI-D/DA measurement data with the following basic functions: 0 32-bit/64-bit Windows program interface 0 Database for storing measurement data for each measurement point Date access via TCP/IP network 0 Possibility of visualization for all measurement variables accessible from a PQID/DA as a function of time and as a statistical magnitude 0 A second seat license is included in the price Licences 0 Single-user license for 2 x PQI-D/DA/smart 0 Single-user license for 2 - 10 x PQI-D/DA/smart 0 Single-user license for > 10 x PQI-D/DA/smart L0 L1 L2 Operating instructions 0 German 0 English 0 French A1 A2 A3 Additions to PQI-DA smart Code SD-memory card (external): 4 GByte industrial standard 900.9099.4 DIN-rail, wall mounted housing Frame for panel mounting 564.0435 Radio time clock interface DFC 77 111.9024.01 564.0433 GPS clock - H1: AC/DC 88 V...264 V D2: RS485 111.9024.45 GPS clock - H2: DC 18 V...72 V D2: RS485 111.9024.46 Scope of Delivery/Order Codes LEREF "Verzeichnis Ueberschrift" \* MERGEFORMAT Index Page 9 We take care of it. 3. Safety instructions Follow the operating instructions. Keep the operating instructions with the device. Ensure that the device is operated only in a perfect condition. Never open the device. Ensure that only qualified personnel operate the device. Connect the device only as specified. Ensure that the device is operated only in the original condition. Connect the device only with recommended accessories. Ensure that the device is not operated outside the design limits. (Refer to the technical data) Ensure that the original accessories are not operated outside the design limits. Do not use the device in environments where explosive gases, dust or fumes occur. Clean the device only with commercially available cleaning agents. Page 10 Safety instructions 4. Technical Data 4.1 PQI-DA smart Description The new Power Quality Analyser and sequence of events recorder PQI-DA smart for low, medium-voltage grids is the central component of a system with which all measurement tasks in electrical grids can be solved. The PQI-DA smart can be used as either a Power Quality Interface in accordance with grid quality standards or as a measuring device for all physically defined variables in three-phase grids. In addition to standard evaluations, the PQI-DA smart also features a high speed sequence of events recorder with a recording rate of 40.96kHz/10.24kHz as well as an 10ms RMS recorder. This enables a detailed evaluation of faults in the grid. In particular, the component is suitable for monitoring, registering, evaluating and recording special reference quantities or quality agreements between the energy supplier and the customer Modern Power Quality measuring devices operate in accordance with the IEC 61000-4-30 (2008) standard. This standard defines measurement methods in order to create a comparable basis for the user. Devices from different manufacturers that operate according to this standard must give the same results. The standard distinguishes two classes of measuring devices: 0 Class A devices are used mainly for measurements relating to contracts in customersupplier relationships. 0 Class S devices can be used to determine statistical quality values. Technical Data Page 11 LEREF "Verzeichnis Ueberschrift" \* MERGEFORMAT Index We take care of it. The PQI-DA smart meets all demands of the IEC 61000-4-30 (2008) standard for an A-Class device: Parameter IEC61000-4-30 Class Power frequency A Magnitude of the Supply Voltage A Flicker A Supply voltage dips and swells A Voltage interruptions A Supplv voltage unbalance A Voltage harmonics A Voltage interharmonics A Mains signaling voltage A Underdevation and overdeviation A Measurement aggregation intervals A Time-clock uncertainty A Flagging A Transient influence quantities A The PQI-DA smart has been developed for measurements perfromed within public grids as well as for recording PQ data within an industrial environment up to 690V (L-L) measurement voltage. 0 No moving parts (fans, hard drives etc.) 0 CAT IV 0 Extensive storage capability (can be extended up to 32 GB by the user, permitting several years recording without connection to database) 0 Optional “IEC61000-4-7 - 2kHz to 9kHz” (B1) 0 Frequency measurement of voltage and current according IEC 61000-4-7 from 2 kHz to 9 kHz. 0 Standard IEC61000-4-7 describes the measuring of harmonics and interharmonics in power supply grids and connected devices. Page 12 Technical Data 4.2 Technical Data 0 1.7-inch colour display 0 Keypad for basic/direct device configuration 0 1 GB internal memory 0 Input channel bandwidth 20 kHz 0 4 voltage inputs Final value of measurement range: 57/ 230/ 480V L-N, accuracy < 0.1% 0 4 current inputs 1A/5A nominal, Final value of measurement range: 10A 0 Simultaneous processing of sampled and calculated voltages and currents 0 Oscilloscopic voltage and current recorder sampling rate : 40.96kHz / 10.24kHz 0 Half cycle recorder: – power frequency, r.m.s. of voltages and currents, voltage and current phasors – power recording rate : ~10ms(50Hz) / ~8.33ms (60Hz) 0 Powerful recorder triggering 0 Online streaming of voltages and currents at 40.96kHz sampling rate. 0 IEC 61000-4-30 Class A Measurement data processing 0 Recording of the voltage quality faults in accordance with DIN EN 50160; IEC61000-2-2; -2-12;-2-4. 0 Spectral analysis 2 kHz…9 kHz,(35 frequency bands, BW = 200Hz) of voltages and currents according (IEC 61000-4-7) 0 Phase of voltage and current harmonics n=2..50 0 2 general purpose digital inputs with 2 input level options 0 2 relay outputs for protection monitoring and alarm 0 Complex analysis software WinPQ smart (sold as a package) 0 As an option: – Analysis of the data on an MYSQL-based database using the WinPQ software package. Permanent communication with up to 500 devices. Technical Data Page 13 LEREF "Verzeichnis Ueberschrift" \* MERGEFORMAT Index We take care of it. Communication Protocols – – MODBUS RTU MODBUS TCP – – IEC60870-5-104 (Option P1) IEC61850 (Option P2) Time synchronisation protocols (Receive / Slave) – IEEE1344 / IRIG-B000..007 – GPS (NMEA +PPS) – DCF77 – NTP – PTP (IEEE1588) Interfaces Ethernet RJ45 (10/100 Mbit) 2 * RS232/RS485 switchable on terminals Dimensions / Weight LxBxH 160 x 90 x 58 mm Weight 500 g Page 14 Technical Data Voltage inputs Voltage inputs Channels U1, U2, U3, UN/E/4 Electrical safety DIN EN 61010 300V CAT IV Input reference level PE Impedance -> PE 10 MΩ || 25pF Nominal input voltage Un 100V AC /230VAC Full scale range (FSR) 0…480VAC L-E Waveform Any Maximum crest factor @ Un 3 Bandwidth DC…20kHz Nominal power frequency fn Frequency range of the fundamental @ 1%..100%Un Voltage unbalance ±0.15% @ 1%..5% reading Mains signaling voltage (< 3kHz) ±5% of reading @ Us = 3%..15% Un 600V CAT III Current inputs Option C30 Channels I1, I2, I3, IN/4 50Hz / 60Hz Electrical safety DIN EN 61010 300V CAT III fn ± 15% 42.5..50..57.5Hz 51.0..60..69.0Hz Input type Differential, isolated Impedance ≤ 4mΩ Nominal input current In 1 A AC / 5 A AC Full scale range (FSR) 10AAC Overload capacity permanent ≤ 10s ≤ 1s 20 A 100 A 500 A Waveform AC, any Maximum crest factor @ In 4 Bandwidth 25Hz...20kHz Accuracy Fundamental, r.m.s ±0.15% Un @ Us = 1%..3% Un ±0.1% Un (0°C…45°C) ±0.2% Un (-25°C…55°C) @ 10%...150%Un Fundamental, Phase ±0.01° @ 10%...150%Un Harmonics n = 2..50, r.m.s. ±5% of reading @ Uh ≥ 1% Un ±0.05% Un @ Uh < 1% Un C31 100AAC Harmonics n = 2..50, Phase ±n∙0.01° @ Uh ≥ 1% Un Interharmonics n = 1..49, r.m.s. ±5% of reading @ Uih = ≥ 1% Un Fundamental, r.m.s ±0.05% Un @ Uih < 1% Un < 0,1% FSR 5%...100% < 0,2% FSR 5% ... 10% Fundamental, Phase ±0,1° 5%...100% ±0,2° 5% ... 10% Harmonics n = 2..50, r.m.s. 5% 5%...100% 10% 5% ... 10% Harmonics n = 2..50, Phase ±n∙0,1° 5%...100% ±n∙0,2° 5% ... 10% Interharmonics n = 1..49, r.m.s. ±5% 5%...100% ±10% 5% ... 10% Power frequency ±10mHz @ 10%...200%Un Flicker DIN EN 61000-4-15:2011 Class F2 Dip residual voltage ±0.2% Un @ 10%..100%Un Dip duration ±20ms @ 10%..100%Un Swell residual voltage ±0.2% Un @ 100%..150%Un Swell duration ±20ms @ 100%..150%Un Interruption duration ±20ms Accuracy Technical Data Page 15 LEREF "Verzeichnis Ueberschrift" \* MERGEFORMAT Index We take care of it. Storage of measured values Internal memory 1024 MB SD memory card 1 GByte to 32 GByte Binary inputs (BI) Range 48...250 VAC(/DC) 0 H – Level 0 L – Level > 35 V < 20 V Signal frequency DC ... 70 Hz Input resistance > 100kΩ Electrical isolation Optocoupler, electrically isolated Electrical safety DIN EN 61010 300V CAT II Power supply Feature H1 H2 AC 90...264 V - DC 100...300 V 18...72 V Power consumption. ≤ 10 W ≤ 10 Watt Frequency 40...70Hz - External fuse characteristics 6A B 6A B < 20VA Binary outputs (BO) Contact specification (EN60947-4-1, -5-1) : Configuration Rated voltage Rated current Rated load AC1 Rated load AC15, 230VAC Breaking capacity DC1, 30/110/220 V SPDT 250VAC 6A 1500VA 300VA 6/0.2/0.12A No. of switching operations AC1 ≥ 60∙103 electrical Electrical isolation Isolated from all internally potentials Electrical safety DIN EN 61010 300V CAT II Page 16 Technical Data Environmental parameters Ambient temperature : Storage and transport IEC 60721-3-1 / 1K5 -40 ... +70°C Limit range of operation Operation IEC 60721-3-3 / 3K6 -25 ... +55°C IEC 60721-3-2 / 2K4 -40 ... +70°C Ambient temperature : Rated range of operation --- IEC 60721-3-3 / 3K5 mod. -10 ... +45°C Relative humidity: 24h average 5...95 % 5...95 % Solar radiations --- 700W/m2 Vibration, earth tremors IEC 60721-3-1 / 1M1 IEC 60721-3-2 / 2M1 IEC 60721-3-3 / 3M1 No condensation or ice Electrical safety 0 IEC 61010-1 0 IEC 61010-2-030 Protection class 1 Pollution degree 2 Overvoltage category mains supply option : H1 H2 300V / CAT III 150V / CAT III High voltage test Pulse voltage 6 kV 5 sec 5.4kV RMS 1 min 3.6kV RMS Measurement category 300V / CAT IV 600V / CAT III Altitude ≤ 2000m Technical Data Page 17 LEREF "Verzeichnis Ueberschrift" \* MERGEFORMAT Index We take care of it. 4.3 Mechanical design The PQI-DA smart can be wall-mounted (optional DIN-rail), in-panel mounted (optional mounting frame) or used as a DIN-rail housing. All connections are accessible via Phoenix type terminals. The connections are made by using plug-in/clamping technology, except for the current and voltage inputs. For the TCP/IP interface one RJ 45-connector is available. Side view of PQI-DA smart Page 18 Technical Data 1. 2. 3. 4. 5. 6. 7. 8. COM 1 TxD RTS GND RxD CTS RS485 Neg/B RS485 Pos/A Schirmung 1. 2. 3. 4. 5. 6. 7. 8. COM 2 TxD RTS GND RxD CTS RS485 Neg/B RS485 Pos/A Schirmung Pin assignments for RS232 / RS485 COM interfaces Termination resistor for COM-interface (COM1 / COM2) 0 termination resistor„ON“ activated 0 termination resistor„OFF“ turned off OFF – resistor off ON – resistor activated Technical Data Page 19 LEREF "Verzeichnis Ueberschrift" \* MERGEFORMAT Index We take care of it. 4.3.1 Power supply for PQI-DA smart Earthing for PQI-DA smart Always connect the earth for PQI-DA smart. CAUTION Supply the measuring device in the correct voltage range which corresponds to the power supply unit fitted. Page 20 Characteristic H1 H2 AC 90...264 V - DC 100...300 V 18...72 V Technical Data 4.4 Mains connection for PQI-DA smart 4.4.1 3-phase / 4-wire connection Voltage connections Please ensure that the PE conductor (earth) is connected to the PQI-DA smart. If no N conductor is available, connect E and N together. Ensure that switching (4-wire) is selected. (Setting via display or software) Technical Data Page 21 LEREF "Verzeichnis Ueberschrift" \* MERGEFORMAT Index We take care of it. 4.4.2 4-wire connection without neutral current If no neutral current is available in the 3-phase, 4-wire grid, the power inputs of the PQI-DA smart are connected as shown in the illustration above. Page 22 Technical Data 4.4.3 4-wire 1-phase With the 4-wire grid, 1-phase set-up no conductor-conductor events and 3~grid events are evaluated. Any voltage with the same earth potential can be connected (e.g. three grids with the L1 phase) and any current can be connected. Technical Data Page 23 LEREF "Verzeichnis Ueberschrift" \* MERGEFORMAT Index We take care of it. 4.4.4 3-phase / 3-wire connection 1 Connection to secondary transformer Connections Please ensure that the PE conductor (earth) is connected to the PQI-DA smart. Ensure that measurement cable E is connected for each measurement. This is normally the earthing point of the voltage transformer. Ensure that switching (3-wire) is selected. (Setting via display or software) Set the voltage transformer ratio Enter the nominal conductor-conductor voltage Set the current transformer ratio Connecting PQI-DA smart Power IN in a 3-wire grid If in a 3-wire grid power is connected to the IN input, it will be calculated and recorded. The values measured for IN are not included in the 3~ power calculations. It is, therefore, possible to use the PQI-DA smart to capture any additional current via the fourth power input. Page 24 Technical Data 4.4.5 V connection; Aron connection The V connection or Aron connection can be configured in the device set-up of the software. These connection types are only available in the 3-wire configuration. 1) V connection (parameterisation via the evaluation software) 2) Aron connection (parameterisation via the evaluation software) Possible connection configurations in 3-wire grids: 0 Voltage converter connections: 1, 2, 3, 4, 0 Current transformer connections: 1, 2, 3, 4, The voltage converter and current transformer selection fields can be parameterised. The grounded voltage in each case or the current that has not been connected is calculated by the measuring device. 1 3-phase voltage converter connections: Connection configuration VT Measuring channel Reference po1 2 3 4 Voltage converter: L1, L2, L3, N/E 1 u1 u2 u3 uN/E V connection, earth L1 2 u1 u2 u3 u4 V connection, earth L2 3 u1 u2 u3 u4 V connection, earth L3 4 u1 u2 u3 u4 tential E 1 3-phase current transformer connections: Connection configuration CT Measuring channel 5 6 7 Current transformer: L1, L2, L3, N 1 i1 i2 i3 iN Current transformer: L2, L3 2 - i2 i3 i4 Current transformer: L1, L3 3 i1 - i3 i4 Current transformer: L1, L2 4 i1 i2 - i4 8 1 The values measured for IN are not included in the 3~ power calculations. It is, therefore, possible to use the PQI-DA smart to capture any additional current via the fourth power input. Technical Data Page 25 LEREF "Verzeichnis Ueberschrift" \* MERGEFORMAT Index We take care of it. 4.5 Measurement / Functions PQI-DA smart complies with the automatic event detection and measurement standards, which are: EN50160 (2013) / IEC61000-2-2 / IEC61000-2-12 /IEC61000-2-4 (Class 1; 2; 3) / NRS048 / IEEE519 / IEC61000-4-30 class A / IEC6:1000-4-7 / IEC61000-4-15 4.5.1 Continuous Recording: Five fixed and two variable measurement time intervals are available for continous recording. All measured values can be freely activated or deactivated in the data classes. 0 10/12 periods (200ms) 0 1 sec 0 n*sec (can be set from 2 seconds to 60 seconds) 0 150/180 periods (3sec) 0 n*min (can be set from 2 seconds to 60 seconds) 0 10 min 0 2 hrs. Time Interval Voltage 10/ 150/ 10 2 12T 180T min h 1 s N* s N* min Power frequency Power frequency, 10s-Value (IEC61000-4-30) Extremes, standard deviation of power frequency (10s) r.m.s. values (IEC61000-4-30) Extremes, standard deviation of T/2-values Underdeviation [%] , Overdeviation [%] (IEC61000-4-30) Harmonic subgroups n= 0..50 (IEC61000-4-7) Maximum values of 10/12 T harmonic subgroups n = 2..50 Interharmonic subgroups n=0..49 (IEC61000-4-7) Total Harmonic Distortion (THDS) (IEC61000-4-7) Partial Weighted Harmonic Distortion (PWHD) Unbalance, neative-/positive- sequence , sequence sign Unbalance, zero-/positive- sequence Positive-, negative-, zero sequence phasors Phasors (fundamental) Flicker (IEC61000-4-15) Instant flicker (IEC61000-4-15) Mains signaling voltages [%] (IEC61000-4-30) Phase angle( zero crossings) of phase voltage harmonics n=2..50 to fundamental of reference voltage Frequency bands 1..35 , 2kHz..9kHz, r.m.s. (IEC61000-4-7) Page 26 Technical Data Time Interval Current 10/ 150 10 2 12T /18 min h 0T 1 s N* s N* min r.m.s. values Extremes of T/2-values Harmonic subgroups n= 0..50 (IEC61000-4-7) Maximum values of 10/12 T harmonic subgroups n = 2..50 Interharmonic subgroups n=0..49 (IEC61000-4-7) Total Harmonic Distortion (THDS) (IEC61000-4-7) Total Harmonic Currents Partial Weighted Harmonic Distortion (PWHD) Partial Odd Harmonic Currents (PHC) K-Factors Unbalance, neative-/positive- sequence , sequence sign Unbalance, zero-/positive- sequence Positive-, negative-, zero sequence phasors Phasors (fundamental) Phase angle( zero crossings) of current harmonics n=2..50 to fundamental of reference voltage Frequency bands 1..35 , 2kHz..9kHz, r.m.s. (IEC61000-4-7) Time Interval Energy 10 2 min h 1 s N* s N* min Active energy, phase Active energy, total Exported active energy, phase Exported active energy, total Imported active energy, phase Imported active energy, total Reactive energy (inductive), phase Reactive energy (inductive), total Exported reactive energy (inductive), phase Exported reactive energy (inductive), total Imported reactive energy (inductive), phase Imported reactive energy (inductive), total Technical Data Page 27 LEREF "Verzeichnis Ueberschrift" \* MERGEFORMAT Index We take care of it. Time Interval Power 10 2 min h 1 s N* s N* min Active power, phase Active power, total Active power extremes Reactive power, phase Reactive power, total Reactive power extremes Apparent power, phase Apparent power, total Fundamental active power, phase Fundamental active power, total Fundamental reactive power, phase Fundamental reactive power (displacement), total Fundamental apparent power, phase Phase angle of fundamental apparent power, phase Fundamental apparent power, total Phase angle of fundamental apparent power, total Reactive distortion power, phase Reactive distortion power, total Active power factors, phase, total Reactive power factors, phase, total COS + sign, phase, total SIN + sign, phase, total COS + sign of reactive distortion power, phase, total Capacitive-, inductive scaling factor of COS (-1..0..+1) : Triggered interval mean active power, phase Triggered interval mean active power, total Triggered interval mean reactive power, phase Triggered interval mean reactive power, total Page 28 Technical Data 4.5.2 PQ Events trigger quantity lower voltage dip (T/2) upper voltage swell (T/2) voltage interruption (T/2) voltage rapid voltage change (T/2) sliding average filter mean +/- threshold voltage change (10min) voltage unbalance (10min) mains signaling voltage (150/180T) voltage harmonics (10min) voltage THD (10min) voltage short term flicker PST (10min) voltage long term flicker PLT (10min) trigger quantity lower upper step r.m.s. phase voltages (T/2) r.m.s. phase-phase voltages (T/2) power frequency (10s) 4.5.3 Recorder triggering r.m.s. residual/neutral-ground voltage (T/2) Positive sequence voltage (T/2) Negative sequence voltage (T/2) Zero sequence voltage (T/2) Phase voltage phase (T/2) phase voltages wave shapes (wave shape filter) +/- threshold phase-phase voltages wave shapes (wave shape filter) residual/neutral-ground voltage wave shape (wave shape filter) r.m.s. phase currents (T/2) r.m.s. total / neutral current (T/2) Power frequency (T/2) Binary inputs (debounced) rising, falling slope Command external Technical Data Page 29 LEREF "Verzeichnis Ueberschrift" \* MERGEFORMAT Index We take care of it. 4.5.4 Output relays The functions of the output relays have been defined as follows: 0 Relay B01 – Watchdog relay Self-monitoring of the measuring device 0 Relay B02 – Reports new sequence of events recording If a new sequence of events recording is captured and recording and saving has been completed, relay B02 is operated for one second. The message signals that this sequence of events recording can be read out from the device. 4.5.5 Memory management The PQI-DA smart is equipped with an internal memory of one gigabyte. If a SD-card is inserted in the device, you have to choose to time period for the data. – – – – the last 7 days the last 30 days snapshot of the whole memory circular = the SD-card will stay in the device and will be filled in a circular memory. If the SC-card is bigger than one gigabyte, the time period of the SD-card is much longer than into the PQI-DA smart. Confirm with “OK” and the PQI-DA smart will start automatically to copy the selected internal memory onto the SD card. The minimum size of an external memory card is one gigabyte. The device can manage memory cards up to a max. of 32gBytes. Page 30 Technical Data In the display menu “memory” the progress of the copy process is shown. To remove the memory card, operate the "Remove SD card“ function. The "Remove SD card“ function stops the copying function for the measuring data of the internal memory to the SD memory card and releases the card for removal. 1 Memory allocation The memory allocation of the PQI-DA smart uses the internal 1 gigabyte memory in a circular ring buffer for all measurement data. The ring buffer is allocated as follows: 0 512 MB circular buffer for long-term measurement data 0 416 MB circular buffer for sequence of events recordings (oscilloscope images; ½ period RMS values) 0 16 MB circular buffer for log files and Power Quality events Technical Data Page 31 LEREF "Verzeichnis Ueberschrift" \* MERGEFORMAT Index We take care of it. 5. Operation of the PQI-DA smart 5.1 Getting started - Wizzard Wird der Netzanalysator PQI-DA smart zum ersten Mal in Betrieb genommen, meldet sich das Gerät in einem geführten Setupmodus. Der Bediener wird automatisch durch die Erstinbetriebnahme des Messgerätes geführt. Wizzard page 1 1 Automatic basic settings and limit values for the following voltage level according to EN50160: – Low-voltage grid = EN50160-NS – Medium-voltage grid = EN50160-MS – High-voltage grid = EN50160-HS Wizzard page 2 Selecting the Display Language PQI-DA smart Page 32 Operation of the PQI-DA smart Wizzard page 3 Basic settings / network connection PQI-DA smart 1 For more information about the network connection, see chapter 4.4 Hardware connection Grid configuration Entering the grid type "3-conductor grid", "4-conductor grid" and/or "4 x 1 conductor grid" will determine how the Power Quality events are recorded. Switch between 3-conductor and 4-conductor grids. 1 In a 3-conductor grid, all events are calculated from the conductor-conductor voltages. 1 In a 4-conductor grid and/or a 4 x 1 conductor grid all Power Quality events are determined from the conductor-earth voltages. Grid frequency Setting grid frequency to 50Hz or 60Hz Wizzard page 4 Voltage converter: Corresponds to the ratio between the primary and secondary voltage. Current transformer: Corresponds to the ratio between the primary and secondary current. 1 Example: Voltage: primary = 20,000V / secondary = 100V; Conversion factor = 200 primary = 100A / secondary = 5A; Conversion factor = 20 Operation of the PQI-DA smart LEREF "Verzeichnis Ueberschrift" \* MERGEFORMAT Index Page 33 We take care of it. Wizzard page 5 The displayed value for the nominal voltage is: 0 In a 4-conductor grid = 230V conductor-earth voltage 0 In a 3-conductor grid = 100V conductor-conductor voltage, multiplied by the conversion factor The % value is used to set the reference voltage at a different value to the nominal voltage. Example 1: 20,000V * 105% = Reference voltage of 21,000V. This is the reference value for all trigger thresholds as well as Power Quality events. Example 2: 500V grid (conductor-conductor) 230V * 125% = 287.5V (conductor-earth) Wizzard page 6 Manual entry of date and time. Wizzard page 7 Activating or deactivating DHCP DHCP deactivated = The device is used with a fixed IP address. . Page 34 Operation of the PQI-DA smart Wizzard Seite 8 At this point, all the settings for the device can be transferred or canceled. 1 With the confirmation of "Yes", the device restarts, change all settings and delete all old measurement files in the device memory. 1 The measurement campaign is now started. Operation of the PQI-DA smart LEREF "Verzeichnis Ueberschrift" \* MERGEFORMAT Index Page 35 We take care of it. 5.2 Display The colour display of the device provides information about the correct connection of the measuring cables and transducers and shows online data for voltages, currents, total harmonic distortion (THD), power values and energy. Pressing the "right“ and "left“ keys on the keypad will change the side of the display. If no key is operated, the screen will switch to sleep mode after 5 minutes. The following screens provide online information of the measured data: Display page 1 Line-Earth voltages Display page 2 Line-to-line voltages & grid frequency Page 36 Operation of the PQI-DA smart Display page 3 Currents L1, L2, L3, N conductor Display page 4 ½-periode maximum current for the last day Display page 5 ½-periode maximum current for the last 7 days Display page 6 ½-periode maximum current for the last 30 days Display page 7 Active power including sign Operation of the PQI-DA smart LEREF "Verzeichnis Ueberschrift" \* MERGEFORMAT Index Page 37 We take care of it. Display page 8 Apparent output Display page 9 Reactive power including sign Display page 10 Power factor (active power / apparent output) Display page 11 Total harmonic distortion of voltages The THD calculation H2 to H40 and/or H2 to H50 is adjustable. Display page 12 Total harmonic distortion of currents The calculation H2 to H40 and/or H2 to H50 is adjustable Page 38 Operation of the PQI-DA smart Display page 13 Ep = Total active energy Ep pos. = Active energy received (positive sign) Ep neg. = Active energy supplied (negative sign) Eq = Total reactive energy Eq pos. = Reactive energy received (positive sign) Eq neg. = Reactive energy supplied (negative sign) Display page 14 Display page 15 Current firmware for PQI-DA smart / Device date and time Display page 16 The number of PQ events that occurred, oscillograph and RMS value recordings for the last day, last week and last month appear on the device display. The event counter changes over to the following day at 24:00 hours/12 am each day. Operation of the PQI-DA smart LEREF "Verzeichnis Ueberschrift" \* MERGEFORMAT Index Page 39 We take care of it. 5.3 Setup display Pressing the key on the keypad will change the display to the setup menu. The following main menus are available in setup mode: Page 40 Operation of the PQI-DA smart 5.3.1 Parameter Parameter page 1 Grid configuration Entering the grid type "3-conductor grid", "4-conductor grid" and/or "4 x 1 conductor grid" will determine how the Power Quality events are recorded. Switch between 3-conductor and 4-conductor grids. 1 In a 3-conductor grid, all events are calculated from the conductor-conductor voltages. 1 In a 4-conductor grid and/or a 4 x 1 conductor grid all Power Quality events are determined from the conductor-earth voltages. Grid frequency Setting grid frequency to 50Hz or 60Hz Parameter page 2 Voltage converter: Corresponds to the ratio between the primary and secondary voltage. Current transformer: Corresponds to the ratio between the primary and secondary current. 1 Example: Voltage: primary = 20,000V / secondary = 100V; Conversion factor = 200 primary = 100A / secondary = 5A; Conversion factor = 20 Operation of the PQI-DA smart LEREF "Verzeichnis Ueberschrift" \* MERGEFORMAT Index Page 41 We take care of it. Parameter page 3 The displayed value for the nominal voltage is: 0 In a 4-conductor grid = 230V conductor-earth voltage 0 In a 3-conductor grid = 100V conductor-conductor voltage, multiplied by the conversion factor The % value is used to set the reference voltage at a different value to the nominal voltage. Example 1: 20,000V * 105% = Reference voltage of 21,000V. This is the reference value for all trigger thresholds as well as Power Quality events. Example 2: 500V grid (conductor-conductor) 230V * 125% = 287.5V (conductor-earth) Parameter page 4 Rated current All trigger thresholds for the current refer to the set nominal current. The nominal current for the system should be entered here. Reference channel defines the measuring channel for frequency measurements and grid synchronisation. Page 42 Operation of the PQI-DA smart Parameter page 5 Power measurement: The power calculation in the device firmware can be selected from two measuring functions: 0 Power calculation in accordance with DIN 40110, part 2 – including the calculation of the imbalance reactive power (factory setting for the device) 0 Simplified power calculation without considering the imbalance reactive power in the 3~ phase power This setting has an impact on the measured power values on the device display, the online measured values and the recorded measured values. Operation of the PQI-DA smart LEREF "Verzeichnis Ueberschrift" \* MERGEFORMAT Index Page 43 We take care of it. 5.3.2 Time settings 5.3.2.1 DCF77 time setting Time synchronisation to an external DCF77 radio-controlled clock DCF77 settings on the RS232/RS485 interface and the time zone of the DCF signal. 5.3.2.2 Connection DCF77 Funkuhr To connect the DCF77 time clock art no. 111.9024.01 to PQI-DA smart please use this wiring. Connection DCF77 time clock: 2: RTS red wire time clock = +6V 3: GND white wire time clock = GND 4: RxD green wire time clock = clock signal 5: CTS black wire time clock = -6V Page 44 Operation of the PQI-DA smart 5.3.2.3 Manual time setting The time is set manually on the device Summer / winter time setting is switched off (DST = OFF) Setting the time zone in which the device is located Manual time and date setting for PQI-DA smart DST – changing from summer to winter time Setting the date and time for changing from summer to winter time. Operation of the PQI-DA smart LEREF "Verzeichnis Ueberschrift" \* MERGEFORMAT Index Page 45 We take care of it. 5.3.2.4 NTP time setting Time synchronisation to a NTP time server The PQI-DA smart supports up to four time servers in the network. The device automatically uses the strongest signal that is available in the network. 5.3.2.5 NMEA-ZDA time setting Setting up the RS232/RS485 interface for the NMEA protocol Page 46 Operation of the PQI-DA smart 5.3.2.6 NMEA-RMC time setting Setting up the RS232/RS485 interface for the NMEA-RMC protocol 5.3.2.7 IRIG-B time setting IRIG-B formats 0 to 3 IRIG-B formats 4 to 7 Selecting the IRIG-B format Setting up the interface and the time zone Operation of the PQI-DA smart LEREF "Verzeichnis Ueberschrift" \* MERGEFORMAT Index Page 47 We take care of it. 5.3.2.8 IEEE 1344 time setting Time synchronisation to an IRIG-B time protocol (in accordance with IEEE1344) Setting up the interface and the time zone Page 48 Operation of the PQI-DA smart 5.3.3 Basic setting Basic setting page 1 Language: Select the display language Automatic setup: This function takes you through an automatic device setup. This function is started automatically when the device is put into operation for the first time and does then not appear again. You can go to the guided setup at any time via "Auto Setup". Basic setting page 2 Access to the device setup can be disabled via a 4-digit password. Basic setting page 3 Reset events: The event counter for sequence of events recordings and PQ events on the device display is reset to 0. All measurement data and PQ events are retained in the device memory. Reset energy counter: The energy counters in the device display and in the device memory are set to 0. Operation of the PQI-DA smart LEREF "Verzeichnis Ueberschrift" \* MERGEFORMAT Index Page 49 We take care of it. 5.3.4 Password lock device display Access to the device setup can be disabled via a 4-digit password. If a password is assigned, no access to the device parameterization via the display is possible. - Enter your correct password Confirm with unlock Now the device setup over the keys and the display can be achieved. The password has no restriction for the software. Page 50 Operation of the PQI-DA smart 5.3.5 Memory management The "Remove SD card“ function stops the copying function for the measuring data of the internal memory to the SD memory card and releases the card for removal. 5.3.6 Setting up the device interfaces PQI-DA smart is supplied with the following default IP address: 192.168.56.95 / 255.255.0.0 Interfaces page 1 Activating or deactivating DHCP DHCP deactivated = The device is used with a fixed IP address. Interfaces page 2 Operation of the PQI-DA smart LEREF "Verzeichnis Ueberschrift" \* MERGEFORMAT Index Page 51 We take care of it. 6. WinPQ smart software The free WinPQ smart evaluation software has been created exclusively for the Network Analyser PQI-DA smart and includes the following functions: 0 Parameterisation of the Network Analyser PQI-DA smart 0 Online analysis of the measurement data 0 Reading the measurement data from the measuring device 0 Evaluating measurement data 0 Firmware update for PQI-DA smart The powerful database and evaluation software WinPQ which is available at an extra charge supports all mobile and permanently installed Network Analysers supplied by A. Eberle in one system. Measuring data from different devices can be compared to each other. There is a fully automated and permanent connection to all permanently installed devices. Detailed PowerQuality reports and sequence of events recording are automatically created by the system and can be sent via e-mail. There are separate operating and commissioning instructions for the WinPQ software. 6.1 Installing the evaluation software To start the installation of the evaluation software, place the installation CD in your CD-ROM drive. If the Autostart function is activated, the installation program starts automatically. Otherwise, go to the root directory of your CD-ROM drive and start the program by doublecLicking the file . The installation complies with the Windows standard, including uninstalling the program system via the "Software" option on the Control Panel. The installation location of the program (target directory) can be freely selected during installation. Install the software in a directory in which you also have read and write rights. The start icon Page 52 is created automatically on your PC's Desktop. WinPQ smart software Uninstalling the software via the control panel The components are removed from the PC using Windows "Control panel“. Under "Software“, "WinPQ smart“ entry, use the "Remove" button to delete the evaluation software. All parts of the program, including the generated links, are completely removed after a single confirmation. Before uninstalling the program, the components launched must be closed. Software Update You can find the evaluation software and all updates and the current device firmware, free of charge, on our website under the product group "Power Quality / Software WinPQ smart": www.a-eberle.de Please also install the current device firmware on your measuring device to ensure that you can use any new functions. Start screen for WinPQ smart, example with 6 PQI-DA smart devices WinPQ smart software LEREF "Verzeichnis Ueberschrift" \* MERGEFORMAT Index Page 53 We take care of it. 6.2 Basic setting for Software Under the "Settings“ menu point, the following changes can be made: Language setting for the software (the software must be restarted after any change) Visibility of the setup parameters – Basic Desktop = Basic user with restricted selection of main parameters – Expert Desktop = Expert mode with all setting options displayed Page 54 WinPQ smart software 6.3 Setting up a new PQI-DA smart A device is set up as a tile on the screen via the "New station" function. The TCP-IP address of the PQI-DA smart is stored in the "IP" field. The port number of the device can be allocated any number. The device is delivered with the value "5040" set as the port number. The values will be adopted by pressing OK, and a station tile for this device is then stored on the software interface. An unlimited number of devices can be set up. Deleting a station tile Station tiles can be deleted via the "Setup general" station menu. WinPQ smart software LEREF "Verzeichnis Ueberschrift" \* MERGEFORMAT Index Page 55 We take care of it. 6.4 Device parameterisation The function "Para" opens the device setup for PQI-DA smart. The following basic functions are available: Send device settings (measurement values, limit values, trigger thresholds) to the device Save all device settings as a template on the PC. Open own settings that have already been saved on the PC (for instance, to send these to another device) – “Open default” provide two standard settings, for low voltage network and medium voltage network. Limit values Power Quality, trigger settings for sequence of events recordings Selecting the measurement values within the interval classes Page 56 WinPQ smart software 1 Visibility of the setup parameters – Basic Desktop = Basic user with restricted selection of main parameters – Expert Desktop = Expert mode with all setting options displayed – Service = Passwort protected for service only 6.4.1 Device designation In the menu "Device designation", the description of the device is determined. The fields marked in red describe the station icon as well as all the fault records and data in the archive. WinPQ smart software LEREF "Verzeichnis Ueberschrift" \* MERGEFORMAT Index Page 57 We take care of it. 6.4.2 PQ Parameter In PQ parameter the limits for standard evaluations and for power quality events are set. The limits of EN 50160 for a low voltage system are stored in the default setting of delivery. 0 0 0 0 Value: Default: Minimum: Maximum: Value of PQI-DA smart – this value can be changed Default setting Smallest value Biggest value Under "Open default setting" templates are located for a low and a medium and high-voltage network. Page 58 WinPQ smart software 6.4.3 General user settings The following basic instrument settings can be made in this menu item: 0 Connection voltage inputs: 1, 2, 3, 4 Voltage inputs Connection configuration VT 1 2 3 4 Voltage : L1, L2, L3, N/E 1 u1 u2 u3 uN/E V-connection, earth L1 2 u1 u2 u3 u4 V- connection, earth L2 3 u1 u2 u3 u4 V- connection, earth L3 4 u1 u2 u3 u4 PE 0 Reference voltage: 1…7 Determining the frequency measurement input channel: U1, U2, U3, Une, U12, U23, U31 0 Power calculation: 1 = according DIN40110-2; with calculation of the unbalance reactive power (basic setting of the device) 2 = Simplified power calculation - without calculation of unbalance power This setting has also an effect on the power values in the display of the PQI-smart 0 Connection current inputs: Current Connection configuration CT I1 I2 I3 I4 Current : L1, L2, L3, N 1 i1 i2 i3 iN Aron connection : L2, L3 2 - i2 i3 i4 Aron connection : L1, L3 3 i1 - i3 i4 Aron connection : L1, L2 4 i1 i2 - i4 WinPQ smart software LEREF "Verzeichnis Ueberschrift" \* MERGEFORMAT Index Page 59 We take care of it. 0 Network connection: 0 = 4-wire network (3 phase network with earth) 1 = 4-wire (single phase – 4 x L1) 2 = 3-wire netzwork – without earth 0 Interval x-seconds data class: Free interval - 2 seconds to 60 seconds 0 Binary input for power intervals: 0 = Time interval intern 1 = time interval synchronized to binary input 1 2 = time interval synchronized to binary input 1 0 Interval x-minutes data class: Free interval - 1 minute to 60 minutes (basic setting 15 minutes) 0 Calculation THD / THC: nd th nd th Calculation 2 to 40 harmonic or 2 bis 50 harmonic 0 Voltage transducer factor (basic setting = 1) 0 Current transducer factor (basic setting = 1) Page 60 WinPQ smart software 6.4.4 Trigger parameter for disturbance recorder In this menue all limits for triggering of fault records can be changed. These thresholds are independently to the Power Quality thresholds. Upper and lower trigger thresholds für frequency, voltage, current oder unballance can be set. WinPQ smart software LEREF "Verzeichnis Ueberschrift" \* MERGEFORMAT Index Page 61 We take care of it. 6.4.5 Oscilloscope recorder Settings for Oscilloscope recorder can be changed here. 0 Minimum recorder length: Setting of the standard faultrecorder length 0 Maximum recorder length: If one fault last longer than the minimum recorder length, the PQI-DA smart will 0 enlarge the recorder length up to a maximum recorder length. The maximum recorder length of one recorder file can be set here. Recorder pretime is the time of the recorder file bevore the trigger threshold occurred. pretime recorder posttime threshold active passive 0 Active trigger = value exceeds or falls below threshold (start of the event) 0 Passive trigger = value comes back to normal (end of the event) 0 Sampling frequency of oscilloscope recorder can be changed from 10240 Hz to 40960 Hz (40960Hz is only available with option B1) Page 62 WinPQ smart software 6.4.6 ½ cycle recorder The trigger settings of ½ cycle recorder (10ms at 50Hz) are independend to oscilloscope recorder. Please see chapter 6.4.4 – explanation trigger thresholds WinPQ smart software LEREF "Verzeichnis Ueberschrift" \* MERGEFORMAT Index Page 63 We take care of it. 6.4.7 Control of recording via binary inputs With the input signal of the two digital inputs, it is possible to start and stop the PQI-DA smart recorders. The following functions can be started or stopped via the digital input: – – – All permanent recorder Oscilloscope recorder ½-cycle rms recorder "/dev/slot_0/module_0/bi0" To control the recording of PQI-DA smart, of the two binary inputs are inserted in the parameter setting. The following text must be placed in the selected row: – Binary input no. 1 = "/dev/slot_0/module_0/bi0" – Binary input no. 2 = "/dev/slot_0/module_0/bi1" With the function "logic level recording control" the signal may be negated. – 0 = Recording is running at low level and stops at high level – 1 = Recording is running at high level and stops at low level Page 64 WinPQ smart software 6.4.8 Recordings parameter At this point, the selection of all permanent measured values within the interval data class is set. The following interval data classes available 0 10/12 cycle (200ms interval) 0 150/180 cycle (3 seconds interval) 0 10 minutes interval 0 2 h interval 0 1 seconds interval 0 10 seconds interval 0 N x seconds interval (range 2 to 60) 0 N x minutes interval (range 1 to 60 – basic setting 15 min.) All activated measuring values are permanently recorded in this data class. WinPQ smart software LEREF "Verzeichnis Ueberschrift" \* MERGEFORMAT Index Page 65 We take care of it. 6.4.9 Disturbance recoder parameter For oscilloscope recorder and ½ cycle recorder it is possible to activate and deactivate measurement values. Example: The ½ cycle recorder should also record the power and the frequency during a disturbance record. Page 66 WinPQ smart software 6.5 Online measurement values The "Online" function offers extensive analysis functions for online measurement values. Start screen of the online measurement values: 6.5.1 Measurement values Display of online measurement values for voltages, currents, power and grid frequency. WinPQ smart software LEREF "Verzeichnis Ueberschrift" \* MERGEFORMAT Index Page 67 We take care of it. 6.5.2 Vector diagram In the vector diagram, connection faults are easy to detect. All phase voltages and currents are displayed with phase angles. 6.5.3 Oscilloscope image Online oscilloscope (41.96kHz / 10.24kHz) for the following channels: 0 Conductor-earth voltages L1, L2, L3, NE 0 Conductor-conductor voltages L12, L23, L31 0 Currents L1, L2, L3, N Page 68 WinPQ smart software 6.5.4 Harmonic From the "Harmonics" tab page, all of the current and voltage harmonics (2nd to 50th) can be displayed online. The measurement data is calculated by the measuring device in accordance with IEC61000-4-30 Class A and transferred to the PC. There are three bar charts available: 0 Voltage harmonics conductor-earth 0 Voltage harmonics conductor-conductor 0 Current harmonics As the EN50160 only specifies limits for harmonics up to the 25th ordinal, the compatibility level of IEC61000-2-2 has been stored for the 26th to the 50th harmonics in the basic settings. Compatibility levels in accordance with EN50160 & IEC61000-2-2 are shown as green limit value bars. If a harmonic is selected with the mouse pointer, this measurement value is displayed in the field on the top right. WinPQ smart software LEREF "Verzeichnis Ueberschrift" \* MERGEFORMAT Index Page 69 We take care of it. 6.5.5 Interharmonics The "Interharmonics“ card is used to display all current and voltage interharmonics up to 2,500 Hz online. The measurement data is calculated by the measuring device in accordance with IEC61000-4-30 Class A following the grouping process and transferred to the PC. There are three bar charts available: 0 Interharmonic voltages conductor-earth 0 Interharmonic voltages conductor-earth 0 Interharmonic currents If an interharmonic is selected with the mouse pointer, this measurement value is displayed in the field on the top right. 1 Explanation of the grouping process in accordance with the IEC: To evaluate the interharmonics in the grid, subgroups are created. In each case, all of the interharmonics between two harmonics are combined into one harmonics subgroup. Example for 50Hz: Interharmonic H2 includes all frequencies from 110Hz to 140Hz. Page 70 WinPQ smart software 6.5.6 Frequency bands from 2kHz to 9kHz 1 The device characteristic "Frequency bands from 2kHz to 9kHz" is a device option The card "2 to 9kHz“ is used to display all current and voltage harmonics in 200Hz groups. Evaluation is in accordance with the IEC61000-4-7 standard. The centre frequency of the corresponding frequency band is stated. Example: All frequencies from 8,805Hz to 9,000 Hz are located in the 8.9 kHz band. If a frequency band is selected with the mouse pointer, this measurement value is displayed in the field on the top right. WinPQ smart software LEREF "Verzeichnis Ueberschrift" \* MERGEFORMAT Index Page 71 We take care of it. 6.5.7 Device panel The device panel can be used for the remote control of the device via the 5-key keypad. 0 Scrolling the measurement value displays (right – left keys) The left and right keys can be used to scroll the measurement value screens. 0 Setup settings The Enter key is used to open the setup menu of the device. 6.5.8 Software trigger The "Software Trigger" key can be used to trigger the oscilloscope recorder and ½-period RMS recorder manually. The recorder length corresponds with the settings in the setup menu of the device. Page 72 WinPQ smart software 6.6 Measurement data import The "Import" function can be used to load all measurement data from the PQI-DA smart to the PC and to evaluate it there. Inactive Data class not active – no measurement data Data class active – measurement data available WinPQ smart software LEREF "Verzeichnis Ueberschrift" \* MERGEFORMAT Index Page 73 We take care of it. Select the interval data classes 8 permanent recorder available Select the number of the triggered sequence of events recordings (oscilloscope and ½ cycle RMS recorder) Page 74 WinPQ smart software Level-time diagram of permanent measuring data When a file is selected this measurement data is saved on the PC immediately and a selection field with all available measurement data appears in the window. If measurement values are selected, they appear as a level-time diagram on the screen. Example: Oscilloscope recorder – selecting voltage L1, L2, L3, L12, L23, L31 WinPQ smart software LEREF "Verzeichnis Ueberschrift" \* MERGEFORMAT Index Page 75 We take care of it. Right-clicking the graphics with the mouse will open the following menu: Functions: 0 Auto scaling: The Y-axis of the measurement values is scaled automatically 0 Data on the clipboard: Measurement data is copied to the clipboard and can be processed further, e.g. in MS Excel. 0 Image on the clipboard: Copies the level-time diagram to the Windows clipboard and can then be inserted, e.g. in MS Word. Stack: This function changes how the measurement data is displayed in stacks. Measurement values can contain grouped or separate y-scales. With “Import” it is possible to select between: 0 Download all measurement files of the recorder (f.e. 10min recorder files) 0 Download all disturbance recorder and permanent recorder from PQI-DA smart Page 76 WinPQ smart software 6.7 Deleting measurement data in the device memory With the "Delete" function, measurement data can be deleted in the PQI-DA smart device memory. Delete recorder - only deletes the selected file. All records of this class - deletes f.e. all 10-minute data files. Delete all records – All disturbance recordings and long-term measurement data on the device memory are deleted. 1 Right-click with the mouse to open the menu. Delete event - deletes only the selected event file. Delete all events – all event files on the device are deleted. WinPQ smart software LEREF "Verzeichnis Ueberschrift" \* MERGEFORMAT Index Page 77 We take care of it. 6.8 Evaluating measurement data offline The "Archiv" function can be used to evaluate all measurement data offline. All measurement data which has been selected in the "Import" function is saved automatically on the PC. These can be evaluated offline without being connected to the measuring device. Screen: Data folder Page 78 WinPQ smart software When measurement values or measuring channels have been selected, the associated level-time diagram appears Example: Oscilloscope image – selecting voltage for L1E, L2E, L3E 6.8.1 Edit measurement data With the icon "Chart", the following functions are available: WinPQ smart software LEREF "Verzeichnis Ueberschrift" \* MERGEFORMAT Index Page 79 We take care of it. 1 Copy data – copies all the data displayed in the Windows clipboard Example – measurement values in MS Excel 1 Copy image – photo is copied to the Windows clipboard 1 Stack – associated measurement data can be represented with a common scale or separated Example: presentation of voltage L1, L2, L3 in two variants Page 80 WinPQ smart software 1 Zoom function To zoom in an area you draw with the left mouse button a window from top left to bottom right. To zoom out is the opposite direction. You can zoom in multiple stages or zoom out an image. WinPQ smart software LEREF "Verzeichnis Ueberschrift" \* MERGEFORMAT Index Page 81 We take care of it. 6.8.2 EN50160 report In the 10 minute data class, the EN50160 report is available. If you select one measurement file a multipage report is created. 6.8.3 Voltage harmonics - interharmonics With the Icon “Voltage” you can reach the statistics of the voltage harmonics, voltage interharmonics and frequency bands 2 kHz to 9 kHz. Example: Statistic voltage harmonic - scaled to the corresponding compatibility level of the power quality standard. Page 82 WinPQ smart software 6.8.4 Currentharmonics – Interharmonics With the Icon “Voltage” you can reach the statistics of the voltage harmonics, voltage interharmonics and frequency bands 2 kHz to 9 kHz. WinPQ smart software LEREF "Verzeichnis Ueberschrift" \* MERGEFORMAT Index Page 83 We take care of it. Example: Statistic current harmonics 2nd to 50th - scaling in ampere If you select with the cursor a particular harmonic, so the corresponding measured values are displayed for these harmonics in the display. The red bar always shows the 95% values and the blue bar shows the maximum measured value. Page 84 WinPQ smart software 6.9 Importing measurement data from an SD card The function "Import from SD“ function is used to transfer selected measurement data from the SD memory card to the PC. 0 Event Recorder – includes all Power Quality events 0 srb – includes all long-term measurement data and sequence of events recordings 1 Highlight a folder 1 Press "Select" to import WinPQ smart software LEREF "Verzeichnis Ueberschrift" \* MERGEFORMAT Index Page 85 We take care of it. 7. Firmware update for PQI-DA smart 7.1 Firmware update with software WinPQ smart The "General setup" function of the station tile can be used to carry out a firmware update for the PQI-DA smart measuring device. Select the folder where the file for the firmware update is located. The function is used to transfer the firmware to the network analyser. When the transfer of the firmware to the measuring device has been completed, it will automatically restart and install the new version. Page 86 Firmware update for PQI-DA smart 7.2 Firmware update with SD-memory card It is possible to make a firmware update on the PQI-DA smart using an SD memory card. If an appropriate firmware is stored on the SD card, the instrument automatically detects this file after plugging. – The following message appear automatically – Press YES to install the firmware update on this device – The PQI-DA smart does a reboot, after a successful installation. Firmware update for PQI-DA smart LEREF "Verzeichnis Ueberschrift" \* MERGEFORMAT Index Page 87 We take care of it. 8. License Update PQI-DA smart The network analyzer PQI-DA Smart can be equipped with various options. These options can be activated via a license code even after the purchase at any time. To order an option the following information to create a license codes are required: – Serial number of the instrument – Article number of the instrument – Option to install Did you receive a valid license for the connected device, so please paste it to the device setting. Example: Upgrading Option 40,96kHz for PQI-DA smart 1 The following options are available: – 40,96kHz sampling (2kHz to 9kHz harmonic measurement) – IEC 60870-5-104 – IEC 61850 Page 88 License Update PQI-DA smart 9. SCADA SCADA settings In the device settings "SCADA" following protocols can be selected: 9.1 – Modbus – is supplied as standard – IEC60870-104 – chargeable device option – IEC61850 - chargeable device option Modbus The following data classes and events are available in the PQI-DA smart about Modbus TCP or Modbus RTU: 9.2 200ms data class (frequency, voltage L1, L2, L3) 1 sec data class (all measurement values) 10 min data class (all measurement values) N x min data class (power measurement values) 2h data class Plt long term flicker value Status of two binary inputs Power Quality and disturbance event counter (display PQI-DA smart) Endless counter for disturbance recorder Power Quality settings – write Modbus Modbus data list Please download the extensive Modbus data point list from our website www.a-Eberle .de For Modbus are over 5000 measurement values available. 9.3 Modbus settings Settings of the Modbus TCP and Modbus RTU interface can be changed via the device setup. SCADA Page 89 LEREF "Verzeichnis Ueberschrift" \* MERGEFORMAT Index We take care of it. 9.3.1 Modbus RTU You can enable Modbus RTU and assign the interface. (COM1 or COM2) The interface can be changed to Modbus RTU RS232 or RS485. 9.3.2 Modbus TCP Modbus TCP is deactivated by default and can be enabled at this point. The port number can be parameterized. Page 90 SCADA 9.4 IEC60870-104 Under Device Settings / SCADA protocol can be selected and activated IEC60870-104. You can setup the station address and client address directly in the display menue. 9.5 IEC60870-104 Data point Please download the extensive IEC60870-104 data point list from our website www.a-Eberle .de BA-SCADA PQI-DA smart 10. Intended use The product is intended for measuring and evaluating voltage and current signals in the energy grid only. Intended use Page 91 LEREF "Verzeichnis Ueberschrift" \* MERGEFORMAT Index We take care of it. 11. Measurement data – measurement methods PQI-DA smart The aggregation of the measurement values is carried out in accordance with the IEC610004-30 (2008) standard for class A devices. RMS values of the voltages and currents, min. / max. values U eff / I eff The interval value of the voltage or current is the mean of the RMS values of the length of the selected interval. U min / max; I min / max Per measurement period, the highest and lowest 10 ms voltage or current RMS value is saved in addition to the average. Ripple control signal U Ripple Control (200 ms) In the PQI-DA smart setup any interharmonic can be set. This is displayed as the 200 ms maximum value within a measurement interval. Flicker levels Pst / Plt The Short term flicker levels Pst (10 min) and Long term flicker levels Plt (2 h) are calculated for the star and delta voltages. Pst and Plt are defined in EN 61000-4-15: 2010. The source for implementation recommendations is "EMV Messung von Spannungsschwankungen und Flickern mit dem IEC-Flickermeter“ by W.Mombauer, VDE-Verlag, VDESchriftenreihe „Normen verständlich“, ISBN 3-8007-2525-8. The interval length Pst has been fixed to 10 minutes and is independent of the measurement interval set. Formula for Plt calculation: Plt 3 1 12 3 Pst ,i 12 i 1 The flickermeter can be parameterised in the device setup for the following grid configurations: 230V/50Hz; 230V/60Hz and 120V/50Hz; 120V/60Hz Page 92 Measurement data – measurement methods PQI-DA smart THD – PWHD – K factor Total harmonic content, calculated using the following formulae in accordance with IEC610004-7. Calculating the THD values of the voltages and signal sampling: The voltage and current inputs are filtered with an anti-aliasing filter and digitized with a 24-bit converter. The sampling rate is at the nominal frequency 40.96 kSamples/s. The aggregation of the measurements is based on IEC61000-4-30 for Class A devices. RMS values of the voltages and currents, min. / max. values U eff / I eff The interval value of the voltage or current is the mean of the RMS values of the length of the selected interval. U min / max; I min / max Per measurement period, the highest and lowest 10 ms voltage or current RMS value is saved in addition to the average. Ripple control signal U Ripple Control (200 ms) Any interharmonics can be set In the PQ-Box 200 setup. This is displayed as the 200 ms maximum value within a measurement interval. Measurement data – measurement methods PQI-DA smart LEREF "Verzeichnis Ueberschrift" \* MERGEFORMAT Index Page 93 We take care of it. Flicker levels Pst / Plt The Short term flicker levels Pst (10 min) and Long term flicker levels Plt (2 h) are calculated for the star and delta voltages. Pst and Plt are defined in EN 61000-4-15: 2010. 1 The measuring interval of the Pst is set to 10 minutes fix and is independently from the free intervall. Formula for Plt calculation: Plt 3 1 12 3 Pst ,i 12 i 1 THD – PWHD – K factor All calculations are based on a 10/12 cycle averaging interval (50 Hz = 10 cycles / 60 Hz = 12 cycles), according the formula of IEC61000-4-7 (exactly 2024 sample values will be used for calculation) The THD calculation of voltage and current can be changed in the settings: 2 – 40th or 2 – 50th THD voltage: 40 2 U 2 THD u U1 THD current in %: 40 2 I 2 THD i I1 THD(A) current in Ampere: THC Page 94 40 2 In n 2 Measurement data – measurement methods PQI-DA smart PWHD - Partial Weighted Harmonic Distortion The partial weighted THD calculates the 14th to 40th harmonics. 40 PWHD nC n 14 2 n C1 PHC - Partial Odd Harmonic Current The PHC is calculated from the odd current harmonics n = 21..39. 39 C PHC n 21, 23 2 n K Factor The values of the K-factors for phase currents are calculated from the corresponding RMS values Cn of the harmonics n = 1..40. The K factor is a measure that indicates the ability of a transformer to withstand the current harmonics of a system. Various transformer suppliers offer transformers with, for example, K factors K=4, K=13, K=20 and K=30. Transformers are heated more by harmonic currents than 50 Hz currents. A transformer with a higher K-factor withstands this better and is not heated as much as a transformer with a lower K factor. The device shows the K factor for the current. Only the K values that appear at maximum power are of interest. Just as with the THD of the currents in %, the value is not relevant at very low currents. 40 K n C 2 n n 1 40 C n 1 2 n Measurement data – measurement methods PQI-DA smart LEREF "Verzeichnis Ueberschrift" \* MERGEFORMAT Index Page 95 We take care of it. Harmonics / Interharmonics The determination of the harmonics and interharmonics interval values displayed using the methods of the IEC61000-4-30 Class A standard based on 10/12 period values. The PQI-DA smart recognizes for all voltage and current channels, respectively, the harmonics up to the 50th ordinal. To evaluate the interharmonics, harmonic subgroups are created. 50 subgroups are recorded for all current and voltage channels. harmonic subgroup n+1 interharmonic subgroup n+2,5 DFT output harmonic n order n+1 n+2 n+3 Example: "IH1“ is the first interharmonics group and evaluated the frequency range from 5 Hz to 45 Hz. The harmonics for n = 0...50 are calculated. Voltage harmonics (standardized, 10/12 periods): U n 10 / 12 1 n N 1 Ck 2 k n N 1 U nom 2 Current harmonics: I n 10 / 12 Page 96 1 n N 1 Ck 2 k n N 1 2 Measurement data – measurement methods PQI-DA smart Frequency analysis 2 kHz to 9 kHz In the frequency analysis 2 kHz to 9 kHz respectively 200 Hz frequency bands are summarized. The specification of each frequency is the center frequency in this 200 Hz band. Example: Frequency band 8.9 kHz corresponds to all 5 Hz spectral lines from 8.805Hz to 9.000Hz Reactive power / Reactive energy In the setup of the device two variants of the power calculation are adjustable Simplified power calculation Reactive power without unbalanced reactive power calculation: Q QV D 2 2 Q ∑ = Q L1+ Q L2 + Q L3 Reactive power calculation according DIN40110 part 2 Reactive power calculation with unbalanced power: QL10/12 Sgn L10/12 S L210/12 PL210/12 Q10/12 Sgn110/12 S102 /12 P102 /12 Reactive energy: "Supply reactive energy" inductive reactive energies +EQ. QS n QL 10 / 12 n für : QL10/12 (n) 0 QS (n) 0 für : QL10 / 12 (n) 0 "Consumer reactive energy" capacitative reactive energies -EQ. QS n QL10/12 n für : QL10/12 (n) 0 Measurement data – measurement methods PQI-DA smart LEREF "Verzeichnis Ueberschrift" \* MERGEFORMAT Index Page 97 We take care of it. Distortion reactive power - D The distortion reactive powers are calculated from the voltage and the associated distortion currents: D U 2 I 2 Power Factor PF In electrical engineering the power factor or active power factor is calculated as the ratio of real power P to the apparent power S. The power factor can be between 0 and 1. The ration is expressed in the following equation: Power Factor PF: = IPI / S Apparent Power - S In the setup of the PQ Box 200 two variants of the power calculation are adjustable Simplified power calculation S P2 Q2 Power calculation according DIN40110 part 2 Conductor apparent power 4-wire system: S L U LNrms I Lrms Conductor apparent power 3-wire system: S L U L0rms I Lrms Collective apparent power in accordance with DIN40110: S U I Page 98 U 1 2 2 2 2 2 U 122 rms U 23 rms U 31rms U 1Nrms U 2 Nrms U 3 Nrms 2 Measurement data – measurement methods PQI-DA smart 4-wire network: 2 I I12rms I 22rms I 32rms I Nrms 3-wire network, I1 + I2 + I3 ≠ 0 : 1 2 2 2 2 2 U U122 rms U 23 rms U 31rms U 1Erms U 2 Erms U 3 Erms 2 2 I I12rms I 22rms I 32rms I Erms Geometric Fundamental Oscillations - Apparent Power: S G 3 [U 1 _ PS I 1 _ PS U 1 _ NS I 1 _ NS U 1 _ ZS I 1 _ ZS ] * * * Active Power - P The sign of the active power corresponds with the flow direction of the fundamental oscillation active energy (+: supply, - : consumer). The values of the conductor - active power are calculated from the samples of a synchronisation cycle. 2048 PL 10/12 p n 1 L ( n) 2048 (200 ms values) with conductor index L = {1, 2, 3, E} The 10 min values are calculated as linear averages. The collective effective power is defined for 4-wire systems as P P1 P2 P3 The collective effective power is defined for 3-wire systems as P P1 P2 P3 PE Fundamental oscillation - active power (line): PG ReS G SG = Geometric fundamental oscillation apparent power Measurement data – measurement methods PQI-DA smart LEREF "Verzeichnis Ueberschrift" \* MERGEFORMAT Index Page 99 We take care of it. Symmetric Components The complex symmetrical components are calculated from the corresponding complex spectral components of the fundamental oscillations of the phase voltages and phase currents. Phase voltage in a 4-wire system = Phase-to-Neutral voltage Phase voltage in a 3-wire system = Phase-to-Ground voltage Positive sequence: 1 2 U 1 _ PS U 1N 1 a U 2 N 1 a U 3 N 1 3 1 2 I 1 _ PS I 11 a I 21 a I 31 3 Negative sequence: 1 2 U 1 _ NS U 1N 1 a U 2 N 1 a U 3 N 1 3 1 2 I 1 _ NS I 1N 1 a I 2 N 1 a I 3 N 1 3 Zero sequence: 1 U ZS U 1N 1 U 2 N 1 U 3 N 1 3 1 I ZS I 1N 1 I 2 N 1 I 3 N 1 3 UU Unbalance The unbalanced voltages are calculated from the corresponding values of the modal positive sequence, negative sequence and zero sequence components. For the EN50160 (events) only the voltage unbalance uu is relevant and corresponds to the ratio of the negative sequence to the positive sequence. The value is expressed in [%]. Page 100 Measurement data – measurement methods PQI-DA smart 12. Service This unit is maintenance-free for customers. Danger of electric shock! Do not open the unit. DANGER Maintenance of the device must only be carried out by A.Eberle. For service, contact A-Eberle. Service address: A. Eberle GmbH & Co. KG Frankenstraße 160 D-90461 Nuremberg Use a short, slightly damp, lint-free cloth. Make sure no liquid gets in the housing. Do not use window cleaner, household cleaners, sprays, dissolvent, cleaners that contain alcohol, ammonia solutions or abrasive cleaning agents. 13. Disposal To dispose of the device and its accessories, please return all components to A. Eberle. Service Page 101 LEREF "Verzeichnis Ueberschrift" \* MERGEFORMAT Index We take care of it. 14. Product Warranty A. Eberle warrants that this product and its accessories shall be free from defects in materials and workmanship for a period of three years from the date of purchase. This warranty does not cover damage caused by accident, misuse or abnormal operating conditions. To make a claim under this warranty, please contact A.Eberle GmbH & Co KG in Nürnberg, Germany. Page 102 Product Warranty Product Warranty LEREF "Verzeichnis Ueberschrift" \* MERGEFORMAT Index Page 103 A. Eberle GmbH & Co. KG Frankenstraße 160 D-90461 Nuremberg Germany Tel.: +49 (0) 911 / 62 81 08-0 Fax: +49 (0) 911 / 62 81 08 96 E-Mail: [email protected] http://www.a-eberle.de Copyright 2014 by A. Eberle GmbH & Co. KG Subject to change without prior notice. No. 584.0826 Vers. PQI-DA smart – 07/22/2015 Power Quality Network Analyser – Model PQI-DA smart


