1
To our customers,
Old Company Name in Catalogs and Other Documents
On April 1st, 2010, NEC Electronics Corporation merged with Renesas Technology
Corporation, and Renesas Electronics Corporation took over all the business of both
companies. Therefore, although the old company name remains in this document, it is a valid
Renesas Electronics document. We appreciate your understanding.
Renesas Electronics website: http://www.renesas.com
April 1st, 2010
Renesas Electronics Corporation
Issued by: Renesas Electronics Corporation (http://www.renesas.com)
Send any inquiries to http://www.renesas.com/inquiry.
Notice
1.
2.
3.
4.
5.
6.
7.
All information included in this document is current as of the date this document is issued. Such information, however, is
subject to change without any prior notice. Before purchasing or using any Renesas Electronics products listed herein, please
confirm the latest product information with a Renesas Electronics sales office. Also, please pay regular and careful attention to
additional and different information to be disclosed by Renesas Electronics such as that disclosed through our website.
Renesas Electronics does not assume any liability for infringement of patents, copyrights, or other intellectual property rights
of third parties by or arising from the use of Renesas Electronics products or technical information described in this document.
No license, express, implied or otherwise, is granted hereby under any patents, copyrights or other intellectual property rights
of Renesas Electronics or others.
You should not alter, modify, copy, or otherwise misappropriate any Renesas Electronics product, whether in whole or in part.
Descriptions of circuits, software and other related information in this document are provided only to illustrate the operation of
semiconductor products and application examples. You are fully responsible for the incorporation of these circuits, software,
and information in the design of your equipment. Renesas Electronics assumes no responsibility for any losses incurred by
you or third parties arising from the use of these circuits, software, or information.
When exporting the products or technology described in this document, you should comply with the applicable export control
laws and regulations and follow the procedures required by such laws and regulations. You should not use Renesas
Electronics products or the technology described in this document for any purpose relating to military applications or use by
the military, including but not limited to the development of weapons of mass destruction. Renesas Electronics products and
technology may not be used for or incorporated into any products or systems whose manufacture, use, or sale is prohibited
under any applicable domestic or foreign laws or regulations.
Renesas Electronics has used reasonable care in preparing the information included in this document, but Renesas Electronics
does not warrant that such information is error free. Renesas Electronics assumes no liability whatsoever for any damages
incurred by you resulting from errors in or omissions from the information included herein.
Renesas Electronics products are classified according to the following three quality grades: “Standard”, “High Quality”, and
“Specific”. The recommended applications for each Renesas Electronics product depends on the product’s quality grade, as
indicated below. You must check the quality grade of each Renesas Electronics product before using it in a particular
application. You may not use any Renesas Electronics product for any application categorized as “Specific” without the prior
written consent of Renesas Electronics. Further, you may not use any Renesas Electronics product for any application for
which it is not intended without the prior written consent of Renesas Electronics. Renesas Electronics shall not be in any way
liable for any damages or losses incurred by you or third parties arising from the use of any Renesas Electronics product for an
application categorized as “Specific” or for which the product is not intended where you have failed to obtain the prior written
consent of Renesas Electronics. The quality grade of each Renesas Electronics product is “Standard” unless otherwise
expressly specified in a Renesas Electronics data sheets or data books, etc.
“Standard”:
8.
9.
10.
11.
12.
Computers; office equipment; communications equipment; test and measurement equipment; audio and visual
equipment; home electronic appliances; machine tools; personal electronic equipment; and industrial robots.
“High Quality”: Transportation equipment (automobiles, trains, ships, etc.); traffic control systems; anti-disaster systems; anticrime systems; safety equipment; and medical equipment not specifically designed for life support.
“Specific”:
Aircraft; aerospace equipment; submersible repeaters; nuclear reactor control systems; medical equipment or
systems for life support (e.g. artificial life support devices or systems), surgical implantations, or healthcare
intervention (e.g. excision, etc.), and any other applications or purposes that pose a direct threat to human life.
You should use the Renesas Electronics products described in this document within the range specified by Renesas Electronics,
especially with respect to the maximum rating, operating supply voltage range, movement power voltage range, heat radiation
characteristics, installation and other product characteristics. Renesas Electronics shall have no liability for malfunctions or
damages arising out of the use of Renesas Electronics products beyond such specified ranges.
Although Renesas Electronics endeavors to improve the quality and reliability of its products, semiconductor products have
specific characteristics such as the occurrence of failure at a certain rate and malfunctions under certain use conditions. Further,
Renesas Electronics products are not subject to radiation resistance design. Please be sure to implement safety measures to
guard them against the possibility of physical injury, and injury or damage caused by fire in the event of the failure of a
Renesas Electronics product, such as safety design for hardware and software including but not limited to redundancy, fire
control and malfunction prevention, appropriate treatment for aging degradation or any other appropriate measures. Because
the evaluation of microcomputer software alone is very difficult, please evaluate the safety of the final products or system
manufactured by you.
Please contact a Renesas Electronics sales office for details as to environmental matters such as the environmental
compatibility of each Renesas Electronics product. Please use Renesas Electronics products in compliance with all applicable
laws and regulations that regulate the inclusion or use of controlled substances, including without limitation, the EU RoHS
Directive. Renesas Electronics assumes no liability for damages or losses occurring as a result of your noncompliance with
applicable laws and regulations.
This document may not be reproduced or duplicated, in any form, in whole or in part, without prior written consent of Renesas
Electronics.
Please contact a Renesas Electronics sales office if you have any questions regarding the information contained in this
document or Renesas Electronics products, or if you have any other inquiries.
(Note 1) “Renesas Electronics” as used in this document means Renesas Electronics Corporation and also includes its majorityowned subsidiaries.
(Note 2) “Renesas Electronics product(s)” means any product developed or manufactured by or for Renesas Electronics.
User’s Manual
RX850V4 Ver. 4.30
Real-Time Operating System
Analysis for CubeSuite
Target Tool
RX850V4 Ver. 4.30
Document No. U19439EJ1V0UM00 (1st edition)
Date Published December 2008
© NEC Electronics Corporation 2008
Printed in Japan
[MEMO]
2
User’s Manual U19439EJ1V0UM
SUMMARY OF CONTENTS
CHAPTER 1 GENERAL ... 14
CHAPTER 2 FUNCTIONS ... 17
CHAPTER 3 CONSTRUCTING PROGRAM ... 21
CHAPTER 4 AZ MONITOR (SOFT TRACE FORM ONLY) ... 25
CHAPTER 5 DEBUGGING WITH AZ850V4 ... 29
CHAPTER 6 CAUTIONS ... 35
APPENDIX A WINDOW REFERENCE ... 37
APPENDIX B MESSAGES ... 96
APPENDIX C INDEX ... 99
User’s Manual U19439EJ1V0UM
3
Windows, and Windows Vista are either registered trademarks or trademarks of Microsoft Corporation in
the United States and/or other countries.
TRON is the abbreviation of "The Real-time Operating system Nucleus."
ITRON is the abbreviation of "Industrial TRON."
μ ITRON is the abbreviation of "Micro Industrial TRON."
TRON, ITRON, and μ ITRON do not refer to any specific product or products.
The μ ITRON4.0 Specification is an open real-time kernel specification developed by TRON Association.
The μ ITRON4.0 Specification document can be obtained from the TRON Association web site
(http://www.assoc.tron.org/).
The copyright of the μ ITRON4.0 Specification document belongs to TRON Association.
4
User’s Manual U19439EJ1V0UM
• The information in this document is current as of December, 2008. The information is subject to
change without notice. For actual design-in, refer to the latest publications of NEC Electronics data
sheets or data books, etc., for the most up-to-date specifications of NEC Electronics products. Not
all products and/or types are available in every country. Please check with an NEC Electronics sales
representative for availability and additional information.
• No part of this document may be copied or reproduced in any form or by any means without the prior
written consent of NEC Electronics. NEC Electronics assumes no responsibility for any errors that may
appear in this document.
• NEC Electronics does not assume any liability for infringement of patents, copyrights or other intellectual
property rights of third parties by or arising from the use of NEC Electronics products listed in this document
or any other liability arising from the use of such products. No license, express, implied or otherwise, is
granted under any patents, copyrights or other intellectual property rights of NEC Electronics or others.
• Descriptions of circuits, software and other related information in this document are provided for illustrative
purposes in semiconductor product operation and application examples. The incorporation of these
circuits, software and information in the design of a customer's equipment shall be done under the full
responsibility of the customer. NEC Electronics assumes no responsibility for any losses incurred by
customers or third parties arising from the use of these circuits, software and information.
• While NEC Electronics endeavors to enhance the quality, reliability and safety of NEC Electronics products,
customers agree and acknowledge that the possibility of defects thereof cannot be eliminated entirely. To
minimize risks of damage to property or injury (including death) to persons arising from defects in NEC
Electronics products, customers must incorporate sufficient safety measures in their design, such as
redundancy, fire-containment and anti-failure features.
• NEC Electronics products are classified into the following three quality grades: "Standard", "Special" and
"Specific".
The "Specific" quality grade applies only to NEC Electronics products developed based on a customerdesignated "quality assurance program" for a specific application. The recommended applications of an NEC
Electronics product depend on its quality grade, as indicated below. Customers must check the quality grade of
each NEC Electronics product before using it in a particular application.
"Standard": Computers, office equipment, communications equipment, test and measurement equipment, audio
and visual equipment, home electronic appliances, machine tools, personal electronic equipment
and industrial robots.
"Special": Transportation equipment (automobiles, trains, ships, etc.), traffic control systems, anti-disaster
systems, anti-crime systems, safety equipment and medical equipment (not specifically designed
for life support).
"Specific": Aircraft, aerospace equipment, submersible repeaters, nuclear reactor control systems, life
support systems and medical equipment for life support, etc.
The quality grade of NEC Electronics products is "Standard" unless otherwise expressly specified in NEC
Electronics data sheets or data books, etc. If customers wish to use NEC Electronics products in applications
not intended by NEC Electronics, they must contact an NEC Electronics sales representative in advance to
determine NEC Electronics' willingness to support a given application.
(Note)
(1) "NEC Electronics" as used in this statement means NEC Electronics Corporation and also includes its
majority-owned subsidiaries.
(2) "NEC Electronics products" means any product developed or manufactured by or for NEC Electronics (as
defined above).
M8E 02. 11-1
User’s Manual U19439EJ1V0UM
5
[MEMO]
6
User’s Manual U19439EJ1V0UM
INTRODUCTION
Target Readers
This manual is intended for users who wish to design and develop application
systems using the V850 microcontrollers.
Purpose
This manual’s purpose is to help the user understand the functions and the
operation method of the RX850V4.
Organization
This manual is organized as follows.
• GENERAL
• FUNCTIONS
• CONSTRUCTING PROGRAM
• AZ MONITOR (SOFT TRACE FORM ONLY)
• DEBUGGING WITH AZ850V4
• CAUTIONS
How to Use this Manual
This manual assumes that the reader has general knowledge of microcontrollers,
C language, assembly language, and debugging as well as basic knowledge of
the Windows operation method.
To learn about the hardware functions and instruction functions of the V850
microcontrollers:
→ Read the user’s manual for each product.
Conventions
[
]:
Indicates a menu.
Data significance:
Higher digits on the left and lower digits on the right
Memory map addresses: Higher addresses on the top and lower addresses on
the bottom
Active low representation: xxx (overscore over pin or signal name)
Note:
Footnote for item marked with Note in the text
Caution:
Information requiring particular attention
Numerical representation: Binary...XXXX or XXXXB
Decimal...XXXX
Hexadecimal...0xXXXX
Prefix indicating power of 2 (address space, memory capacity)
K (Kilo) 210 = 1024
M (Mega) 220 = 10242
User's Manual U19439EJ1V0UM
7
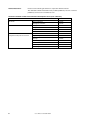
Related Documents
Please use the following documents in conjunction with this manual.
The related documents listed below may include preliminary versions. However,
preliminary versions are not marked as such.
Documents Related to V850 microcontrollers Development Tools (User’s Manuals)
Document Name
RX Series
RX850V4 Ver.4.30
Document No.
Start for CubeSuite
U19428E
Message for CubeSuite
U19433E
Coding for CubeSuite
U19436E
Debug for CubeSuite
U19438E
Analysis for CubeSuite
This document
Internal Structure for CubeSuite
U19441E
CubeSuite
Start
U19549E
Integrated Development Environment
Programming
U19390E
Message
U19550E
V850 Coding
U19383E
V850 Build
U19386E
V850 Debug
U19389E
V850 Design
U19380E
8
User's Manual U19439EJ1V0UM
CONTENTS
CHAPTER 1 GENERAL ... 14
1. 1 Summary ... 14
1. 2 Features ... 15
1. 3 Resource ... 16
1. 3. 1 Soft trace form ... 16
1. 3. 2 Hard trace form ... 16
CHAPTER 2 FUNCTIONS ... 17
2. 1 Trace Form ... 17
2. 2 Trace Data for AZ850V4 ... 18
2. 2. 1 Detection contents ... 18
2. 2. 2 Trace buffer ... 18
2. 2. 3 Time accuracy ... 19
2. 3 Debugging Possible with AZ850V4 ... 19
2. 3. 1 Verification using the AZ:Analyze Window ... 19
2. 3. 2 Verification using the AZ:Pattern window ... 20
2. 3. 3 Verification using the AZ:Cpu window ... 20
2. 3. 4 Verification using the AZ:Trace View window ... 20
CHAPTER 3 CONSTRUCTING PROGRAM ... 21
3. 1 Using AZ850V4 in Soft Trace Form ... 21
3. 2 Using AZ850V4 in Hard Trace Form ... 23
CHAPTER 4 AZ MONITOR (SOFT TRACE FORM ONLY) ... 25
4. 1 About AZ Monitor ... 25
4. 2 Creating AZ Monitor ... 26
4. 2. 1 Creating user own coding block ... 26
4. 2. 2 Initializing AZ monitor ... 28
CHAPTER 5 DEBUGGING WITH AZ850V4 ... 29
5. 1 Debugging Procedure Using AZ850V4 ... 29
CHAPTER 6 CAUTIONS ... 35
6. 1 Allocation of AZ Monitor ... 35
6. 2 Elapsed Time ... 35
6. 3 Execution Transition Map ... 35
User’s Manual U19439EJ1V0UM
9
6. 4 List of Trace Data ... 36
6. 5 Others ... 36
APPENDIX A WINDOW REFERENCE ... 37
A. 1 Description ... 37
APPENDIX B MESSAGES ... 96
B. 1 Overview ... 96
B. 2 Error Massages ... 96
APPENDIX C INDEX ... 99
10
User’s Manual U19439EJ1V0UM
LIST OF FIGURES
Figure No.
Title and Page
3-1
Example of AZ Monitor Section Definition ... 22
4-1
Example of Timer Counter Operation (In Case of Up Counter) ... 26
4-2
Example of Use Own Coding Block ... 27
4-3
Example of AZ Monitor Initialization Description ... 28
5-1
Starting AZ850V4 ... 29
5-2
Downloading Load Module ... 30
5-3
Setting in AZ Option Dialog Box ... 30
5-4
Switching AZ Trace Mode ... 31
5-5
Uploading of Trace Data ... 32
5-6
Display Example of AZ:Analyze Window ... 32
5-7
Display Example of AZ:Cpu Window ... 33
5-8
Display Example of AZ:Pattern Window ... 33
5-9
Display Example of AZ:Trace View Window ... 34
A-1
Relationship of AZ850V4 Windows and Dialog Boxes ... 38
A-2
AZ850V4 Window ... 39
A-3
Statusbar of AZ850V4 Window ... 41
A-4
AZ Option Dialog Box ... 43
A-5
Open/Save As Dialog Box (When Loading) ... 46
A-6
Open/Save As Dialog Box (When Saving) ... 47
A-7
AZ:Analyze Window ... 49
A-8
AZ:Analyze Window (Simple Mode) ... 58
A-9
AZ:Analyze Window (Standard Mode) ... 58
A-10
AZ:Analyze Window (Detailed Mode) ... 59
A-11
AZ:Analyze Window (When Equal Mode Is Not Specified) ... 61
A-12
AZ:Analyze Window (When Equal Mode Is Specified) ... 61
A-13
Object Select Dialog Box ... 64
A-14
Pattern Search Dialog Box ... 67
A-15
AZ:Cpu Window ... 71
A-16
Pattern Set Dialog Box ... 76
A-17
Difference between [Valid] and [Invalid] ... 78
A-18
AZ:Pattern Window ... 80
A-19
Pattern Distribution Viewing Method ... 84
A-20
AZ:Trace View Window ... 86
A-21
Trace Data Viewing Method ... 89
A-22
Trace Search Dialog Box ... 91
A-23
Specification Example 1 ... 92
A-24
Specification Example 2 ... 93
A-25
Specification Example 3 ... 93
A-26
About Dialog Box ... 94
User’s Manual U19439EJ1V0UM
11
A-27
AZ:Error Dialog Box ... 95
B-1
Error Information Output Format ... 96
12
User’s Manual U19439EJ1V0UM
LIST OF TABLES
Table No.
Title and Page
1-1
Resource (Soft Trace Form) ... 16
1-2
Resource (Hard Trace Form) ... 16
2-1
Relationship between Debug Tool and Trace Form ... 17
2-2
Detectable Contents as Trace Data ... 18
2-3
Trace Buffer Area and Timing of Clearing the Area ... 18
3-1
Additional Section Name for AZ Monitor ... 21
4-1
Data/Functions of User Own Coding Block for AZ Monitor ... 26
A-1
List of Windows and Dialog Boxes of AZ850V4 ... 37
A-2
Display File Extensions and Formats ... 48
A-3
List of Marks in AZ:Analyze Window ... 60
A-4
Sort Mode for Objects ... 66
A-5
Search Modes ... 68
A-6
Search Conditions (When [Task Switch] Is Selected) ... 68
A-7
Search Conditions (When [Service Call(Call/Return/Error)] Is Selected) ... 68
A-8
Pattern Modes ... 77
A-9
Pattern Conditions (When [Task Switch] Is Selected) ... 77
A-10
A-11
Pattern Conditions (When [Service Call(Call/Return/Error)]Is Selected) ... 78
Types of Events In AZ:Trace View Window ... 87
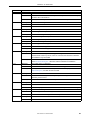
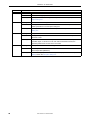
B-1
Error Information List ... 96
User’s Manual U19439EJ1V0UM
13
CHAPTER 1 GENERAL
CHAPTER 1
GENERAL
This chapter describes an overview of analysis tool (AZ850V4) that CubeSuite provides.
1. 1 Summary
As the performance of microprocessors has increased, application programs have grown in scale and complexity.
With conventional debuggers, theoretical debugging of such application programs is simple, but time-related analysis
is not. It is difficult and takes a very long time, for example, to analyze errors such as those caused by incorrect processing timing, or to evaluate the performance of the entire system.
To solve these problems, NEC Electronics Corporation has developed powerful microprocessors such as the V850
Microcontrollers. NEC Electronics Corporation also provides the analysis tool (AZ850V4) to support the quantitative
performance analysis of programs.
AZ850V4 is an analysis tool for analyzing the execution transition statuses and the execution efficiency of the CPU
for programs that embed the real-time operating system "RX850V4" for the V850 Microcontrollers.
AZ850V4 has a function for tracing the occurrence of events (issue of a service call, occurrence of an interrupt, etc.)
and presenting the trace data graphically, in cooperation with CubeSuite. By using this function, the execution transition states of tasks, access states to objects such as an acquisition/release of resource, and execution time for a task
can be easily analyzed.
14
User’s Manual U19439EJ1V0UM
CHAPTER 1 GENERAL
1. 2 Features
The following are the features of the analysis tool for CubeSuite that AZ850V4 provides.
- Graphical display of execution transition statuses
The graphically displayed the execution transition status of the program in which RX850V4 is embedded (horizontal axis = time, vertical axis = task name, etc.) permits analysis of execution transition statuses, such as task
switching caused by service call issuance and transferring the control to the interrupt handler caused by the
occurrence of interrupts. Since all accesses to an object (such as semaphore or eventflag) are marked upon
issuance of a service call from a program, the usage of objects can also be checked.
- Graphical display of CPU occupation time
Based on the display of the CPU usage within a specified time range, the execution efficiency of the entire system can be estimated.
- Statistical analysis of processing time
The time required for a program to execute a certain operation is calculated and the result is displayed as a histogram. The worst, average, and other values are also displayed.
- Linked operation with CubeSuite
A jump can be made from the AZ850V4’s windows to the Editor panel, Disassemble panel, and Memory panel of
CubeSuite. This makes it easy to identify any problem.
AZ850V4 supports the following two trace forms. Either of these trace forms can be selected for the user’s debugging environment. Refer to the "2. 1 Trace Form" for details on the trace forms.
- Soft trace form
A monitor function is provided on the target system, and the monitor program collects trace data for AZ850V4.
The monitor program must be created for use in the user’s environment. Refer to the "CHAPTER 4 AZ MONITOR (SOFT TRACE FORM ONLY)" for details on how to create the monitor program.
- Hard trace form
Trace data for AZ850V4 is collected using the trace function of a debug tool that is connected to CubeSuite.
The trace data can be collected without modifying the program.
User’s Manual U19439EJ1V0UM
15
CHAPTER 1 GENERAL
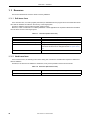
1. 3 Resource
This section describes the resource which is used by AZ850V4.
1. 3. 1 Soft trace form
In the soft trace form, a monitor program (AZ monitor) is embedded into the program and a trace buffer that stores
trace data for AZ850V4 is located on the memory of the target system.
Therefore, AZ850V4 uses the following target system memory.
Moreover, a timer counter that is not used by RX850V4 or other applications is required to obtain time information
from the timer counter on the target system.
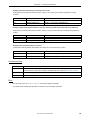
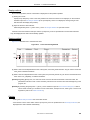
Table 1-1. Resource (Soft Trace Form)
Resource
Required Quantity
Text/data area of AZ850V4 (TEXT attribute)
Approx. 920 bytes
Work area of AZ850V4 (BSS attribute)
40 bytes
Trace buffer area
4K bytes to 4M bytes (64K bytes to 1M byte recommended)
The size of this area can be changed with the AZ Option dialog
box.
Timer counter
1
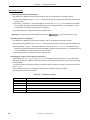
1. 3. 2 Hard trace form
In the hard trace form, the following events of the debug tool connected to CubeSute are required to collect trace
data for AZ850V4.
Therefore, if the resource for AZ850V4 is insufficient, it may not be possible to set the AZ trace mode.
Table 1-2. Resource (Hard Trace Form)
Resource
Point Trace event (for write access)
16
Required Quantity
1
User’s Manual U19439EJ1V0UM
CHAPTER 2 FUNCTIONS
CHAPTER 2
FUNCTIONS
This chapter describes main functions of AZ850V4.
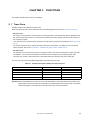
2. 1 Trace Form
AZ850V4 supports the following two trace forms.
Either of these trace forms can be selected for the user’s debugging environment in the AZ Option dialog box.
- Soft trace form
The soft trace form provides a monitor function on the target system, and collects trace data for AZ850V4 using
the monitor program (AZ monitor). The trace data is collected by linking a program with the monitor function to
the processing program.
In the soft trace form, The trace data is stored into the user memory area which is specified in the AZ Option dialog box.
The monitor program must be created according to the user’s environment. For details on how to create the
monitor program, refer to the "CHAPTER 4 AZ MONITOR (SOFT TRACE FORM ONLY)".
- Hard trace form
The hard trace form uses the trace function of a debug tool that is connected to CubeSuite to collect trace data
for AZ850V4. The trace data can therefore be collected without modifying the processing program code.
Using this form, the trace data is stored into a trace buffer area (trace memory area) of the debug tool.
The trace form that can be used differs depending on the debug tool to be used.
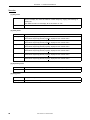
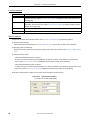
Table 2-1. Relationship between Debug Tool and Trace Form
Debug Tool
Soft Trace Form
Hard Trace Form
IECUBE
OK
-
MINICUBE
OK
-
MINICUBE2
OK
OK
Simulator
OK
OK
[Caution] When using AZ850V4 in the hard trace form with the simulator, specify [No] with the [Accumulate trace
time] property in the [Trace] category on the [Debug Tool Settings] tab in the Property panel of CubeSuite.
Unless this property is set to [No], the correct time information cannot be obtained.
User’s Manual U19439EJ1V0UM
17
CHAPTER 2 FUNCTIONS
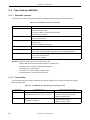
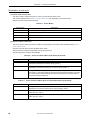
2. 2 Trace Data for AZ850V4
2. 2. 1 Detection contents
The locations that can be detected as trace data for AZ850V4 and their contents are described below.
Table 2-2. Detectable Contents as Trace Data
Detected Location
Contents
Service call entry
Time
Service call function code
ID of object subject to execution by service call
Service call return address
Service call exit
Time
Service call return value
Interrupt entry
Time
Exception code
Occurrence address of a interrupt
Interrupt exit
Time
Task switch
Time
ID of the task to which operation will shift (or ID that indicates Idle status)
Task entry
Time
ID of the task to be activated
Task activation address
[Caution] The following items cannot be detected as trace data.
- RESET, NMI and exceptions (software exception, exception trap)
- Interrupts that have not been registered into RX850V4
- Start and end of a cyclic handler
- Start and end of a task exception handling routine
- Issuance address of a service call that is ext_tsk
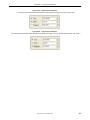
2. 2. 2 Trace buffer
The trace buffer area that is used for collecting trace data for AZ850V4, and the timing of clearing the area are
shown in the table below.
Table 2-3. Trace Buffer Area and Timing of Clearing the Area
Trace Form
Soft trace form
Trace Buffer Area
Arbitrarily specified in trace buffer area
specification area in the AZ Option dialog box.
Timing of Clearing the Area
- If AZ trace mode is set to on again after
AZ trace mode was switched off
- When the CPU is reset
Hard trace form
18
Trace memory of the debug tool that is
connected to CubeSuite
User’s Manual U19439EJ1V0UM
- Every start of a program
- When the CPU is reset
CHAPTER 2 FUNCTIONS
2. 2. 3 Time accuracy
The accuracy of the time information collected as trace data for AZ850V4 differs depending on the trace form to be
used.
- Soft trace form
Because time information is obtained from a timer counter on the target system, the time information of AZ850V4
accords with the operation of the timer counter.
How to control the timer counter used with AZ850V4 and read its value is explained in the description of the user
own coding block of the AZ monitor (refer to the "4. 2. 1 Creating user own coding block").
- Hard trace form
The accuracy of the time information depends on the setting of the [Rate of frequency division of trace time tag]
property in the [Trace] category of the [Debug Tool Settings] tab in the Property panel of CubeSuite.
Also note that the time information may not be correct when the system clock is set to either STOP mode or IDLE
mode (The task execution time is calculated from the CPU system clock).
[Caution] When using AZ850V4 in the hard trace form with the simulator, specify [No] with the [Accumulate trace
time] property in the [Trace] category on the [Debug Tool Settings] tab in the Property panel of CubeSuite.
Unless this property is set to [No], the correct time information cannot be obtained.
2. 3 Debugging Possible with AZ850V4
This section describes whether it is available of what debugging by using AZ850V4 functions.
For details about the procedure to operate, refer to the window/dialog box descriptions.
2. 3. 1 Verification using the AZ:Analyze Window
The AZ:Analyze Window displays the collected trace data using execution transition map.
Using this window and each of the windows that can be opened from this window, system timing misses as well as
the entire system itself can be checked.
- Checking the service call issue status
In addition to execution transition map showing the system flow with the task names/interrupt names as the vertical axis, the service calls supplied by the real-time OS are shown using various marks.
Furthermore, it is possible to select specific locations within trace data by opening the AZ:Trace View Window
from any marked point.
- Checking object operation
The operation of specified objects (tasks/interrupts, etc.) can be searched on execution transition map.
- Searching the occurrence location of specific events
A specific event (a task switching/occurrence of interrupt/service call issuance status, etc.) set in the Pattern Set
dialog box can be searched on execution transition map.
- Jumping to the CubeSuite’s panel from a given location
The panels displaying source text, disassemble text or memory list corresponding to the position specified with
User’s Manual U19439EJ1V0UM
19
CHAPTER 2 FUNCTIONS
the up temporary cursor in the execution transition map can be opened on CubeSuite.
2. 3. 2 Verification using the AZ:Pattern window
The pattern (particular processing) set with the Pattern Set dialog box is searched in the execution transition map
and the distribution status of that pattern is displayed in the AZ:Pattern Window.
It is possible to obtain the worst execution time value and average execution time value for the program processing
from this window.
- Histogram display of task/interrupt processing time
The tabulated results for the searched pattern are displayed in histogram from with the execution time interval as
a parameter.
- Search using task/interrupt processing time
Pattern locations where the execution time interval is maximum or minimum are searched in the processing time
of the searched pattern and the results of this search are displayed in the execution transition map.
This enables the easy search of locations where particular patterns are processed.
2. 3. 3 Verification using the AZ:Cpu window
The AZ:Cpu Window displays the CPU usage within the specified period in the execution transition map.
From this window, it is possible to check the execution time of given tasks/interrupts and evaluate the performance
of the target data from the idle time and interrupt time.
2. 3. 4 Verification using the AZ:Trace View window
The AZ:Trace View Window displays in list form the collected trace data contents.
- Checking trace data
In addition to the processing time, execution address, and executed task/interrupt name, the service call issuance status provided by the real-time OS is displayed, enabling even finer debugging in task units.
- Verification of task/interrupt name, event type or service call argument name
It is possible to perform searches using conditions such as task/interrupt name, event type, service call argument name, etc.
20
User’s Manual U19439EJ1V0UM
CHAPTER 3 CONSTRUCTING PROGRAM
CHAPTER 3
CONSTRUCTING PROGRAM
This chapter describes the procedure of constructing a program for debugging using AZ850V4.
3. 1 Using AZ850V4 in Soft Trace Form
The following is the procedure of constructing a program when AZ850V4 is used in the soft trace form.
In the soft trace form, a monitor function is provided on the target system, and the monitor program (AZ monitor) collects trace data for AZ850V4 (refer to the "2. 1 Trace Form").
(1) Creating target-dependent modules
Create target-dependent modules that are required to execute processing by RX850V4.
(2) Creating processing programs
Create a program (tasks and various kinds of handler processings, etc.) that will form the processing to realize the
application system.
(3) Creating system configuration file
Create a system configuration file required for creating information files that contain data to be provided for
RX850V4.
(4) Creating information files
Using the configurator (CF850V4) supplied by RX850V4, create information files (system information table file,
system information header file, and entry file) from a system configuration file.
(5) Createing user-own cording modules for RX850V4
Create user-own cording modules that are required to execute processing by RX850V4.
(6) Creating AZ monitor
Create the user own coding block of AZ monitor (refer to the "CHAPTER 4 AZ MONITOR (SOFT TRACE FORM
ONLY)").
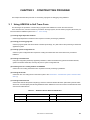
(7) Creating link directive file
Create a link directive file (section map file) by which the user fixes address allocation performed by the link editor.
At this time, note that specify the following additional section definitions for the AZ monitor in the data area and text
area of the link directive file.
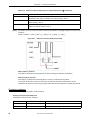
Table 3-1. Additional Section Name for AZ Monitor
Section Name
Description
Attribute
Occupancy Size
.azmon_b
Work area of the AZ monitor
bss
40 bytes
.azmon_t
Text/data area of the AZ monitor
text
Appro. 920 bytes
User’s Manual U19439EJ1V0UM
21
CHAPTER 3 CONSTRUCTING PROGRAM
Figure 3-1. Example of AZ Monitor Section Definition
:
:
TEXT : !LOAD ?RX V0x00001000 {
.rx_text
= $PROGBITS ?AX .rx_text;
.text
= $PROGBITS ?AX .text;
.azmon_t
= $PROGBITS ?AX .azmon_t; <--Additional description
};
CONST: !LOAD ?R {
.rx_info
= $PROGBITS ?A .rx_info;
.const
= $PROGBITS ?A .const;
};
DATA : !LOAD ?RW
.rx_control =
.rx_memory =
.sdata
=
.sbss
=
.data
=
.bss
=
.azmon_b
=
};
:
:
V0xfffc000
$NOBITS
$NOBITS
$PROGBITS
$NOBITS
$PROGBITS
$NOBITS
$PROGBITS
{
?AW .rx_control;
?AW .rx_memory;
?AWG.sdata;
?AWG.sbss;
?AW .data;
?AW .bss;
?AW .azmon_b; <--Additional description
[Caution] Locate the .azmon_b section within a RAM area that can be read and written.
The area should not be written (or initialized) by a program or the like.
(8) Creating object files
Compile and assemble the created source programs (including target-dependent modules, information files, and
user-own cording modules for RX850V4) to generate object files.
At this time, note that the user own coding block for AZ monitor (azusr_XXX.s) must be assembled to generate a
object file.
(9) Creating a load module file
Link all of the following files to create a load module file.
- Object files
- Core of AZ Monitor (azcorec.o)
- All library files provided by RX850V4 (including target-dependent module libraries)
- Link directive file
[Caution] If the AZ monitor is not linked, AZ850V4 cannot be used in the soft trace form.
(10) Debugging and performance analysis using CubeSuite and AZ850V4
Download the load module file created above to the debug tool on CubeSuite to execute debugging and
performance analysis.
22
User’s Manual U19439EJ1V0UM
CHAPTER 3 CONSTRUCTING PROGRAM
3. 2 Using AZ850V4 in Hard Trace Form
The following is the procedure of organizing a program when AZ850V4 is used in the hard trace form.
In the hard trace form, trace data is collected using the trace function of a debug tool connected to CubeSuite (refer
to the "2. 1 Trace Form").
Using this form, trace data can therefore be collected without modifying the program code (it is not necessary to link
the AZ monitor).
(1) Creating target-dependent modules
Create target-dependent modules that are required to execute processing by RX850V4.
(2) Creating processing programs
Create a program (tasks and various kinds of handler processings, etc.) that will form the processing to realize the
application system.
(3) Creating system configuration file
Create a system configuration file required for creating information files that contain data to be provided for
RX850V4.
(4) Creating information files
Using the configurator (CF850V4) supplied by RX850V4, create information files (system information table file,
system information header file, and entry file) from a system configuration file.
(5) Createing user-own cording modules for RX850V4
Create user-own cording modules that are required to execute processing by RX850V4.
(6) Creating link directive file
Create a link directive file (section map file) by which the user fixes address allocation performed by the link editor.
(7) Creating object files
Compile and assemble the created source programs (including target-dependent modules, information files, and
user-own cording modules for RX850V4) to generate object files.
(8) Creating a load module file
Link all of the following files to create a load module file.
- Object files
- All library files provided by RX850V4 (including target-dependent module libraries)
- Link directive file
[Caution] If the AZ monitor is not linked, AZ850V4 cannot be used in the soft trace form.
(9) Debugging and performance analysis using CubeSuite and AZ850V4
Download the load module file created above to the debug tool on CubeSuite to execute debugging and
performance analysis.
[Caution1] When using AZ850V4 in the hard trace form, AZ850V4 sets a event to the debug tool when the AZ trace
ON state is set. Therefore, care is required regarding the number of the event that the debug tool can
use. If the resources for AZ850V4 is insufficient, the AZ trace ON state cannot be set. Refer to the "1.
User’s Manual U19439EJ1V0UM
23
CHAPTER 3 CONSTRUCTING PROGRAM
3 Resource" for details.
[Caution2] When using AZ850V4 in the hard trace form with the simulator, specify [No] with the [Accumulate trace
time] property in the [Trace] category on the [Debug Tool Settings] tab in the Property panel of
CubeSuite.
Unless this property is set to [No], the correct time information cannot be obtained.
24
User’s Manual U19439EJ1V0UM
CHAPTER 4 AZ MONITOR (SOFT TRACE FORM ONLY)
CHAPTER 4
AZ MONITOR (SOFT TRACE FORM ONLY)
This chapter describes how to create the AZ monitor (monitor program) that is necessary for using AZ850V4 in the
soft trace form.
This chapter may be skipped if AZ850V4 is used only in the hard trace form.
4. 1 About AZ Monitor
AZ monitor is a monitor program which consists of the user own coding block (azusr_XXX.s) and the core block
(azcorec.o), that collects trace data when AZ850V4 is used in the soft trace form.
AZ monitor acquires the time information necessary for trace data by using the timer counter of the user's target
device. This requires that the control block of the timer counter be coded according to the target device of user.
Therefore, the user own coding block that controls the timer counter must be created to complete creation of the AZ
monitor.
User’s Manual U19439EJ1V0UM
25
CHAPTER 4 AZ MONITOR (SOFT TRACE FORM ONLY)
4. 2 Creating AZ Monitor
4. 2. 1 Creating user own coding block
Code the control block of the timer counter of the target to be used. Create the control block by referring to the provided sample program (azusr_XXX.s).
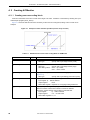
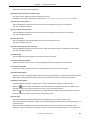
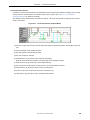
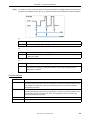
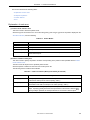
Figure 4-1 shows the data and functions necessary for the user own coding block, taking a timer counter as an
example.
Figure 4-1. Example of Timer Counter Operation (In Case of Up Counter)
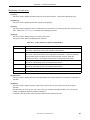
Table 4-1. Data/Functions of User Own Coding Block for AZ Monitor
Name
Type
Description
__AZMON_MaxCount
Data
Specify the maximum number of timer counts. ("n" value in Figure 4-1)
Data type:
Specify with 4-byte integer format (.word)
__AZMON_CountMode
Data
Specify timer count mode.
Data type:
Specify with 1-byte integer format (.byte)
Data setting values: 0x00 ... Up counter,
0x01 ... Down counter
__AZMON_TimePerCount
Data
Specify the time per count in microsecond units (μs) ("tpc" value in
Figure 4-1).
Data type:
26
Specify with 4-byte floating-point format (.float)
__AZMON_InitTimer
Function
Specify the timer initialization processing.
Input register: lp ... Return address
Output register:
None
Destructible register: Depends on C language calling restrictions
__AZMON_GetCounter
Function
Specify the processing for acquiring the timer counter value.
Note that a stack overflow in this function cannot be detected.
Therefore, creation without using a stack is recommended.
Input register:
lp ... Return address
Output register:
r10 ... Counter value
Destructible registers: r1, r11
User’s Manual U19439EJ1V0UM
CHAPTER 4 AZ MONITOR (SOFT TRACE FORM ONLY)
Figure 4-2. Example of Use Own Coding Block
.globl
.globl
.globl
.globl
.globl
__AZMON_MaxCount
__AZMON_CountMode
__AZMON_TimePerCount
__AZMON_InitTimer
__AZMON_GetCounter
.section ".azmon_t", text
.align
4
__AZMON_MaxCount:
.word
MaxCountValue
<--Maximum timer count value
.section ".azmon_t", text
.align
4
__AZMON_CountMode:
.byte
CountMode
<--Timer count mode
.section ".azmon_t", text
.align
4
__AZMON_TimePerCount:
.float
TimePerCount
<--Time per count (Unit: microseconds)
.section ".azmon_t", text
.align
4
__AZMON_InitTimer:
The-Code-of-InitTimer
jmp
<--Timer's initialization processing code
[lp]
.section ".azmon_t", text
.align
4
__AZMON_GetCounter:
The-Code-of-InitTimer
jmp
<--Processing code for acquiring the timer counter value
[lp]
[Caution1] The unit of time displayed as trace data depends on the __AZMON_TimePerCount value (tpc value in
Figure 4-1). If the event interval of trace data to be collected is longer than the interval time of the timer
counter, the correct time cannot be displayed.
[Caution2] If the "ld.h" instruction is used to acquire the timer counter value (__AZMON_GetCounter), the r10 value
is sign-extended to 4-byte value. Therefore, this value must be masked as the example shown below.
When the V850E/V850ES/V850E2 is used, however, it is not necessary to mask it with the "andi"
instruction by using the "ld.hu" instruction instead of the "ld.h" instruction.
ld.h
andi
0[r1],
0xffff,
r10
r10,
r10
[Caution3] Do not share the timer to be used for AZ monitor and the timer to be used for RX850V4.
User’s Manual U19439EJ1V0UM
27
CHAPTER 4 AZ MONITOR (SOFT TRACE FORM ONLY)
4. 2. 2 Initializing AZ monitor
The AZ monitor must be initialized before it is operated.
"AzInit()" that is a initialization routine for AZ monitor is prepared in AZ monitor. Call AzInit() within the initialization
routine of RX850V4 (inirtn).
AzInit() initializes the timer counter and trace control.
AzInit() is the void type function without arguments.
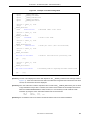
Figure 4-3 shows a example of description for initialization of the AZ monitor.
Figure 4-3. Example of AZ Monitor Initialization Description
#include <kernel.h>
void
inirtn(VP_INT exinf)
{
:
:
/*
*Initialize AZ Moniter
*/
AzInit();
<--Additional description
return;
}
[Caution] AzInit() function must be called after initialization of RX850V4 itself has been completed.
Call this function, therefore, via an initialization handler. If this function is called by boot processing, the
initialization will not be correctly executed.
28
User’s Manual U19439EJ1V0UM
CHAPTER 5 DEBUGGING WITH AZ850V4
CHAPTER 5
DEBUGGING WITH AZ850V4
This chapter describes the procedure for debugging using AZ850V4.
5. 1 Debugging Procedure Using AZ850V4
The procedure for debugging using AZ850V4 is shown below.
For details on the operating method, refer to the explanation sections of each window and/or dialog box.
(1) Starting CubeSuite
Start CubeSuite and then connect the debug tool to be used to it (select the [Debug] menu -> [Connect to Debug
Tool] in the Main window of CubeSuite).
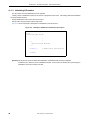
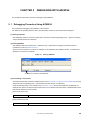
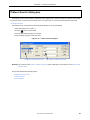
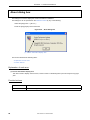
(2) Starting AZ850V4
Start AZ850V4 (select the [View] menu -> [Real-time OS] -> [Performance Analyzer] in the Main window of
CubeSuite) to open the AZ850V4 window.
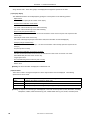
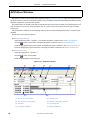
At this time, check whether "Connected" is displayed on the statusbar in the AZ850V4 window. It indicates that
AZ850V4 is connected to CubeSuite.
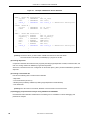
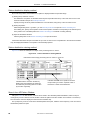
Figure 5-1. Starting AZ850V4
Condition of connection with CubeSuite
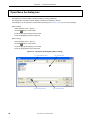
(3) Downloading a load module
Download a load module created for AZ850V4 (refer to the "CHAPTER 3 CONSTRUCTING PROGRAM") into the
debug tool (select the [Debug] menu -> [Download] in the Main window on CubeSuite).
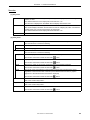
Check the following status on the statusbar in the AZ850V4 window after the downloading is completed (if not
displayed, the chances are that the symbol information is not included in the load module, or RX850V4/AZ monitor
has not been linked to the load module).
[Using in soft trace form]
RX+AZ Loaded
Both of RX850V4 and AZ monitor are loaded.
[Using in hard trace form]
RX Loaded
RX850V4 is loaded.
User’s Manual U19439EJ1V0UM
29
CHAPTER 5 DEBUGGING WITH AZ850V4
Figure 5-2. Downloading Load Module
Condition of load module
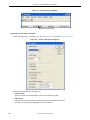
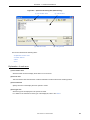
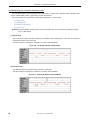
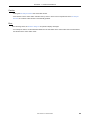
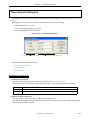
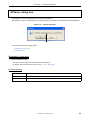
(4) Setting in the AZ Option dialog box
Select the [Option] menu -> [AZ Option...] on the AZ850V4 window to open the AZ Option dialog box.
Figure 5-3. Setting in AZ Option Dialog Box
Specify the following options in this dialog box.
- Address Mask
Specify the maximum physical address of the microcontroller to be used.
- RTOS Select
Select the real-time OS type that has been linked into the downloaded load module.
Note that you can select only [RX850V4] in the current version.
30
User’s Manual U19439EJ1V0UM
CHAPTER 5 DEBUGGING WITH AZ850V4
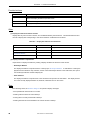
- Trace Form
Select the trace form to be used.
If the debug tool to be used supports only one trace form, however, the form is fixed to either of the two form.
- Soft Form Buffer Type
Select the type of trace buffer to be used when the soft trace form has been selected as the trace form. This
item is invalid when the hard trace form has been selected.
- Soft Form Buffer Region
Specify the start and end address of the trace bugger region when the soft trace form has been selected as the
trace form.
The trace data collected by AZ850V4 is acquired once into the target memory. This means that it is necessary
to specify the unused memory area of the target memory as the trace buffer region.
Specify the unused memory area in the range of 4K bytes to 4M bytes.
If this setting is not correctly made when AZ850V4 used in the soft trace form, trace data for AZ850V4 cannot
be collected.
(5) Switching the AZ trace mode
Set the AZ trace ON state to enable AZ850V4 trace function by clicking the
button on the AZ850V4 window.
Note that the AZ trace ON state cannot be set until after a load module has been downloaded.
Figure 5-4. Switching AZ Trace Mode
AZ trace mode switching button
Display changes from [AZ trace OFF] to [AZ Trace ON].
(6) Executing a program
Execute the program on CubeSuite. The trace data starts being collected into the trace buffer along with the
program execution.
(7) Stopping the program
Stop the program on CubeSuite. If a breakpoint has been set, wait until a break occurs. Stopping the program
also stops the collection of trace data.
(8) Uploading of trace data
Click the
button on the AZ850V4 window to upload the trace data for AZ850V4 to AZ850V4.
User’s Manual U19439EJ1V0UM
31
CHAPTER 5 DEBUGGING WITH AZ850V4
Figure 5-5. Uploading of Trace Data
Upload button
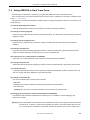
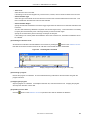
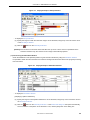
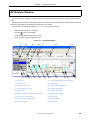
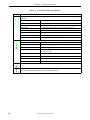
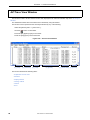
(9) Check using the AZ:Analyze Window
Click the
button on the AZ850V4 window to open the AZ:Analyze Window to display the execution transition
map based on the uploaded trace data.
Using this window and each of the windows that can be opened from this window, system timing misses as well as
the entire system itself can be checked.
Figure 5-6. Display Example of AZ:Analyze Window
[Remark]For how to read the execution transition map displayed in this window, refer to the "Understanding the
execution transition map" and "Verification method in execution transition map".
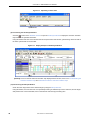
(10) Check using the AZ:Cpu Window
Check the CPU usage status for the defined range by using the AZ:Cpu Window.
Using this window, the execution time of a specified processing of task/interrupt can be confirmed, and the target
data performance can be evaluated, base on the idle time and interrupt processing time.
32
User’s Manual U19439EJ1V0UM
CHAPTER 5 DEBUGGING WITH AZ850V4
Figure 5-7. Display Example of AZ:Cpu Window
- To display the AZ:Cpu Window:
(a) Specify the range for which the total CPU usage is to be calculated, using the up cursor and down cursor
in the AZ:Analyze Window.
(b) Click the
button on the AZ:Analyze Window.
[Remark] If this window is in the active status and either the up cursor or down cursor is repositioned in the
execution transition map, the contents of CPU usage is automatically updated.
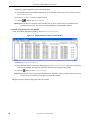
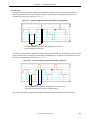
(11) Check using the AZ:Pattern Window
Check the distribution of the specified pattern for given execution duration by using the AZ:Pattern Window.
It is possible to obtain the worst execution time value and average execution time value for the program processing
from this window.
Figure 5-8. Display Example of AZ:Pattern Window
- To display the AZ:Pattern Window:
[Displaying a pattern distribution]
(a) Specify the range for which pattern distribution is to be calculated, using the up cursor and down cursor in
the AZ:Analyze Window.
(b) Click the
button on the AZ:Analyze Window. In the Pattern Set dialog box that opens automatically,
set the conditions of the pattern to be calculated. Then, click the [OK] button in this dialog box.
User’s Manual U19439EJ1V0UM
33
CHAPTER 5 DEBUGGING WITH AZ850V4
[Displaying a pattern distribution from the AZ:Cpu Window]
(a) Specify the range for which pattern distribution is to be calculated, using the up cursor and down cursor in
the AZ:Analyze Window.
(b) In the AZ:Cpu Window, select an object in the list.
(c) Click the
button on the AZ:Cpu Window.
[Remark] If this window is in the active status and either the up cursor or down cursor is repositioned in the
execution transition map, the contents of pattern distribution is automatically updated.
(12) Check using the AZ:Trace View Window
Check the collected trace data in detail by using the AZ:Trace View Window.
Figure 5-9. Display Example of AZ:Trace View Window
- To display the AZ:Trace View Window:
(a) Move the up temporary cursor to the desired position in the AZ:Analyze Window. When the up temporary
cursor is not displayed, the beginning of the trace data becomes the display start position.
(b) Click the
button on the AZ:Analyze Window.
[Caution] If this window is in the active status and either the up temporary cursor is repositioned in the execution
transition map, the contents of trace data is automatically updated.
Debug the program, repeating steps (6) and after as required.
34
User’s Manual U19439EJ1V0UM
CHAPTER 6 CAUTIONS
CHAPTER 6
CAUTIONS
This chapter describes general cautions for using AZ850V4.
6. 1 Allocation of AZ Monitor
When linking the AZ monitor, it is recommended to allocate the .azmon_b section to the internal RAM.
When it is allocated to the external RAM, the external RAM must be referenced correctly (e.g. the peripheral I/O registers are set correctly).
6. 2 Elapsed Time
When executing with hard trace form using IECUBE, if the operating speed of the CPU is 33 MHz or faster, the
elapsed time may not be measured between events due to problems with the resolution because the tracer timer is a
16-bit timer.
In such a case, the following phenomena occur:
- It seems that time does not elapse at the entry and exit of a service call
- It seems that time does not elapse at the entry and exit of an interrupt
AZ850V4 calculates the processing time of the specified section by adding the elapsed time between events.
Therefore, if multiple events occur in the specified section, the errors described above are accumulated. Consequently, a time shorter than the actual processing time will be displayed (the number of errors is linear to the number of
events that occurred in the specified section).
6. 3 Execution Transition Map
- When uploading the trace data for AZ850V4 by clicking the upload button (
) on the AZ850V4 window, cor-
rect information on RX850V4 may not be acquired if the program is stopped during RX850V4 internal processing.
In such a case, the following functions will be affected:
- The function that sorts tasks in the priority order in the AZ:Analyze Window and the Object Select dialog box
- The function to display the task names and resource names in the AZ:Analyze Window ("Tsk(task ID)" is displayed when task names cannot be acquired)
- If the name of a task cannot be acquired and a service call that waits for resources is issued from an abject displayed as "Tsk(????)", a blue horizontal line indicating the resource waiting status is drawn until the end of trace
even after the resource waiting status has been cleared.
- Objects in the AZ:Analyze Window and the execution transition map may not be correctly displayed while the
load module subject to trace data has more than 1000 objects.
- The pull-down menu of the Scale modify button in the AZ:Analyze Window may be dunned. However, the operation itself can be performed normally.
User’s Manual U19439EJ1V0UM
35
CHAPTER 6 CAUTIONS
6. 4 List of Trace Data
If an interrupt occurs during Idle and Idle is restored from the interrupt, the [IntRet] is not displayed of the [Event] in
the AZ:Trace View Window.
6. 5 Others
If the window is vertically expanded in the Object Select dialog box and then reduced, the displayed data may be
discredited.
36
User’s Manual U19439EJ1V0UM
APPENDIX A WINDOW REFERENCE
APPENDIX A
WINDOW REFERENCE
Appendix A provides detailed explanations of windows and dialog boxes used for debugging with AZ850V4.
A. 1 Description
The following shows the list of windows and dialog boxes of AZ850V4.
Table A-1. List of Windows and Dialog Boxes of AZ850V4
Window/Dialog Box Name
Function
AZ850V4 window
Window for performing basic operation of AZ850V4.
AZ Option dialog box
Sets options such as the trace form and the trace level to use AZ850V4.
Open/Save As dialog box
Selects a file when loading or saving the display file.
AZ:Analyze Window
Displays the execution transition map based on the trace data collected.
Object Select dialog box
Selects the objects to be displayed in execution transition map and modifies the
order in which those objects are displayed.
Pattern Search dialog box
Sets the search conditions to search for an object in the execution transition map.
AZ:Cpu Window
Displays the CPU usage within the specified period in the execution transition
map.
Pattern Set dialog box
Sets the pattern to be displayed in the AZ:Pattern Window.
AZ:Pattern Window
Displays the histogram representing the number of times the specified pattern
appears for given execution duration in the execution transition map.
AZ:Trace View Window
Displays the list of the contents of trace data collected.
Trace Search dialog box
Sets the search conditions applied when searching for trace data with the
AZ:Trace View Window.
About dialog box
Displays the version information about AZ850V4.
AZ:Error dialog box
Displays the error information of AZ850V4.
User’s Manual U19439EJ1V0UM
37
APPENDIX A WINDOW REFERENCE
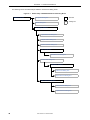
The following shows the relationship of AZ850V4 windows and dialog boxes.
Figure A-1. Relationship of AZ850V4 Windows and Dialog Boxes
AZ850V4 window
AZ Option dialog box
: Window
: Dialog box
About dialog box
AZ:Analyze Window
Open/Save As dialog box
Object Select dialog box
Pattern Search dialog box
AZ:Cpu Window
Open/Save As dialog box
Pattern Set dialog box
AZ:Pattern Window
Pattern Set dialog box
Open/Save As dialog box
AZ:Trace View Window
Trace Search dialog box
Open/Save As dialog box
38
User’s Manual U19439EJ1V0UM
APPENDIX A WINDOW REFERENCE
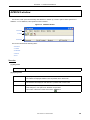
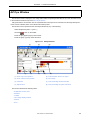
AZ850V4 window
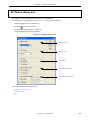
This window, which opens automatically after AZ850V4 is started up, is used to perform basic operations of
AZ850V4. To use AZ850V4, start operation from this window.
Figure A-2. AZ850V4 Window
Menubar
Toolbar
Statusbar
This section describes the following items:
- Menubar
- Toolbar
- Statusbar
- Caution
- Error
Menubar
(1) [File] menu
Exit
Terminates AZ850V4.
(2) [Option] menu
Tool Bar
Displays (default) or hides the toolbars in windows of AZ850V4.
The toolbars are displayed while this item is prefixed with a check mark.
Status Bar
Displays (default) or hides the statusbars in windows of AZ850V4.
The statusbars are displayed while this item is prefixed with a check mark.
AZ Option...
Opens the AZ Option dialog box.
In this dialog box, trace options for AZ850V4 are specified.
The function of this item is same as that of the
User’s Manual U19439EJ1V0UM
button.
39
APPENDIX A WINDOW REFERENCE
(3) [Operation] menu
AZ Trace ON
Sets the AZ trace ON state. While this item is prefixed with a check mark, the AZ trace ON
state is set, so that executing the program collects trace data into the trace buffer.
Note that this menu item cannot be selected until after both of RX850V4 and AZ monitor (in
the case of the soft trace from)/RX850V4 (in the case of the hard trace from) have been
downloaded. In addition, this menu item cannot be also selected while the program is being
executed.
The function of this item is same as that of the
AZ Trace OFF
Sets the AZ trace OFF state . While this item is prefixed with a check mark, the AZ trace
OFF state is set, so that executing the program dose not collect trace data for AZ850V4 into
the trace buffer.
AZ trace OFF state is set as AZ trace mode when AZ850V4 is started.
The function of this item is same as that of the
Upload
button.
button.
Uploads the collected trace data for AZ850V4 into AZ850V4.
This item cannot be selected if the trace buffer contains no trace data.
The function of this item is same as that of the
button.
(4) [Browse] menu
Analyze...
Opens the AZ:Analyze Window.
The execution transition map based on the uploaded trace data is displayed in this window.
The function of this item is same as that of the
button.
(5) [Window] menu
Close All
Closes all AZ850V4 windows and dialog boxes except this window.
(6) [Help] menu
40
This Window
Displays the help window for this window.
Help Topics
Starts AZ850V4 online help.
About...
Opens the About dialog box.
The version information about AZ850V4 is displayed in this dialog box.
User’s Manual U19439EJ1V0UM
APPENDIX A WINDOW REFERENCE
Toolbar
The toolbar consists of buttons that can execute frequently used menu items with a single action.
Button
Function
Opens the AZ Option dialog box. In this dialog box, the AZ trace options are specified.
Same operation as [Option] menu -> [AZ Option...].
Sets AZ trace ON state if it is OFF state, and vice versa.
In the AZ trace ON state, trace data is collected into the trace buffer as the program is executed.
Note that the AZ trace ON state cannot be set until after both of RX850V4 and AZ monitor (in the case
of the soft trace from)/RX850V4 (in the case of the hard trace from) have been downloaded. In
addition, this button cannot be also selected while the program is being executed.
In the AZ trace OFF state, trace data is not collected even if the program is executed.
Same operation as [Operation] menu -> [AZ Trace ON] or [Operation] menu -> [AZ Trace OFF].
Uploads the collected trace data for AZ850V4 into AZ850V4.
This item cannot be selected if the trace buffer contains no trace data.
Same operation as [Operation] menu -> [Upload].
Opens the AZ:Analyze Window.
The execution transition map based on the uploaded trace data is displayed in this window.
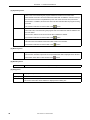
Statusbar
Figure A-3 shows the name of each area on the statusbar.
Figure A-3. Statusbar of AZ850V4 Window
(4) AZ trace mode status area
(3) Load module execution status area
(2) Load module status area
(1) Connection status area
(1) Connection status area
This area indicates the status of connection with CubeSuite.
Connected
Connected to CubeSuite
Not Connected
Not connected to CubeSuite
(2) Load module status area
This area indicates the state of the load module to be loaded onto the debug tool connected to CubeSuite.
This area is not displayed if AZ850V4 is not connected to CubeSuite.
RX+AZ Loaded
[In case of soft trace form]
Both of RX850V4 and AZ monitor are loaded.
RX+AZ None
[In case of soft trace form]
Both or either of RX850V4 and AZ monitor is not loaded.
User’s Manual U19439EJ1V0UM
41
APPENDIX A WINDOW REFERENCE
RX Loaded
[In case of hard trace form]
RX850V4 is loaded.
RX None
[In case of hard trace form]
RX850V4 is not loaded.
(3) Load module execution status area
This area indicates the state of the program execution.
This area is not displayed if AZ850V4 is not connected to CubeSuite.
Running
Status of program being execution
Breaked
Status of program operation undergoing break
(4) AZ trace mode status area
This area indicates the current state of AZ trace mode.
This area is not displayed if AZ850V4 is not connected to CubeSuite or a load module (the required symbol
information) has not been downloaded onto the debug tool.
AZ Trace ON
Status where AZ trace ON has been set
AZ Trace OFF
Status where AZ trace OFF has been set
Caution
- The following state of AZ850V4 is required to set the AZ trace ON.
In case of soft trace form
Both of RX850V4 and AZ monitor are loaded ([RX+AZ Loaded] is displayed on the statusbar).
In case of hard trace form
RX850V4 is loaded ([RX Loaded] is displayed on the statusbar).
- In the hard trace form, AZ850V4 sets a event to the debug tool when the AZ trace ON state is set. Therefore,
care is required regarding the number of the event that the debug tool can use. If the resources for AZ850V4 is
insufficient, the AZ trace ON state cannot be set. Refer to the "1. 3 Resource" for details.
- The contents of this window dose not change even if trace data is uploaded. To check the contents of trace data,
open the AZ:Analyze Window by selecting the [Browse] menu -> [Analyze...].
Error
In the following cases, the AZ:Error dialog box is opened to display messages.
- If an error occurs during the switching processing of the AZ trace mode
- If an error occurs during the uploading processing of the trace data
- If the AZ trace ON is set without set anything with the [Soft Form Buffer Region] in the AZ Option dialog box
- If an attempt is made to upload trace data when no trace data is collected
- If trace data obtained by uploading processing is not correct
42
User’s Manual U19439EJ1V0UM
APPENDIX A WINDOW REFERENCE
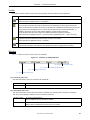
AZ Option dialog box
This dialog box is used to specify various options for using AZ850V4.
This dialog box can be opened from the AZ850V4 window by any of the following:
• Select the [Option] menu -> [AZ Option...]
• Click the
button on the toolbar.
• Press the [Alt], [P] and [O] keys in that order.
• Press the [Ctrl]+[O] keys at the same time.
Figure A-4. AZ Option Dialog Box
(1) [Address Mask]
(2) [RTOS Select]
(3) [Trace Form]
(4) [Soft Form Buffer Type]
(5) [Soft Form Buffer Region]
This section describes the following items:
- Explanation of each area
- Function buttons
- Error
User’s Manual U19439EJ1V0UM
43
APPENDIX A WINDOW REFERENCE
Explanation of each area
(1) [Address Mask]
This area is used to specify the maximum physical address of miclocontroller to be used.
Select an appropriate item from the drop-down list, or enter an appropriate value in hexadecimal from the
keyboard.
For details on the maximum physical address of the miclocontroller, refer to the user's manual of miclocontroller to
be used.
(2) [RTOS Select]
This area is used to specify the real-time OS that has been linked into the downloaded load module.
Note that you can select only [RX850V4] in the current version.
(3) [Trace Form]
This area is used to specify the trace form of AZ850V4.
Select the option button corresponding to the operating environment.
Soft Form
AZ850V4 is used in the soft trace form.
Select this button when a monitor function is provided on the target system, and the monitor
program collects trace data for AZ850V4.
Hard Form
AZ850V4 is used in the hard trace form (default).
Select this button when trace data for AZ850V4 is collected using the trace function of a debug
tool that is connected to CubeSuite.
[Caution] Either the soft trace form or hard trace form of AZ850V4 must be specified (refer to the "2. 1 Trace
Form").
If the debug tool connected to CubeSuite dose not support the hard trace form, this item is fixed to [Soft
Form].
(4) [Soft Form Buffer Type]
This area is used to specify the trace buffer type when [Soft Form] is selected with the [Trace Form] area (this area
is invalid when [Hard Form] is selected).
Select the option button corresponding to the operating environment.
Fixed Buffer
The trace buffer is fixed type buffer.
The trace data is collected until the trace buffer is filled. Therefore, all the trace data up to the
point where the program stops is not always collected.
Ring Buffer
The trace buffer is ring type buffer.
The oldest trace data is overwritten when the trace buffer is filled.
(5) [Soft Form Buffer Region]
This area is used to specify the trace buffer area when [Soft Form] is selected with the [Trace Form] area (this area
is invalid when [Hard Form] is selected).
Directly enter the start address and end address for the trace buffer in hexadecimal number.
In the soft trace form, the trace data collected by AZ850V4 is acquired into the target memory once. This means
that it is necessary to specify the unused memory area of the target memory as the trace buffer area.
Specify the unused memory area in the range of 4K bytes to 4M bytes.
44
User’s Manual U19439EJ1V0UM
APPENDIX A WINDOW REFERENCE
Function buttons
Button
Function
OK
Validates the specified settings.
Cancel
Closes this dialog box.
Help
Displays the help window for this dialog box.
Error
In the following cases, the AZ:Error dialog box is opened to display messages.
- If the [OK] button is clicked when the value specified in the [Address Mask] area is not correct
- If the [OK] button is clicked when the address range specified in the [Soft Form Buffer Region] is not correct
User’s Manual U19439EJ1V0UM
45
APPENDIX A WINDOW REFERENCE
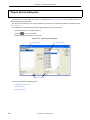
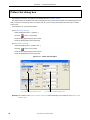
Open/Save As dialog box
This dialog box is used to select a file when loading or saving a display file.
The display file is a file that stores the display contents of the AZ850V4’s window.
This dialog box can be opened from each window (excluding the AZ850V4 window) by any of the following.
[When loading]
• Select the [File] menu -> [Open...].
• Click the
button on the toolbar.
• Press the [Alt], [F] and [O] keys in that order.
• Press the [Ctrl]+[O] keys at the same time.
[When saving]
• Select the [File] menu -> [Save...].
• Click the
button on the toolbar.
• Press the [Alt], [F] and [S] keys in that order.
• Press the [Ctrl]+[S] keys at the same time.
Figure A-5. Open/Save As Dialog Box (When Loading)
(1) File location area
(3) File name area
46
User’s Manual U19439EJ1V0UM
(2) File list area
(4) File type area
APPENDIX A WINDOW REFERENCE
Figure A-6. Open/Save As Dialog Box (When Saving)
(1) File location area
(3) File name area
(2) File list area
(4) File type area
This section describes the following items:
- Explanation of each area
- Function buttons
- Other
- Error
Explanation of each area
(1) File location area
Select the folder in which a display file is exists or is to be saved.
(2) File list area
This area lists the files that match the conditions selected in the file location area and file type area.
(3) File name area
Specify the name of the display file to be opened or saved.
(4) File type area
Select the type of the display file to be opened or saved.
For details on the extension for each type of the display file, refer to the "Other".
User’s Manual U19439EJ1V0UM
47
APPENDIX A WINDOW REFERENCE
Function buttons
Button
Function
Open/Save
Loads the specified display file into the caller window.
Saves the display file with the specified name.
Cancel
Closes this dialog box.
Help
Displays the help window for this dialog box.
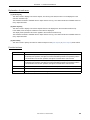
Other
(1) Display file extensions and file formats
Display files vary from window to window, and are differentiated by their extension. The default extensions and
formats of display files corresponding to the various windows of AZ850V4 are as follows:
Table A-2. Display File Extensions and Formats
Window Name
Extension
File Format
AZ:Analyze Window
.az
Binary
AZ:Cpu Window
.azc
CSV
AZ:Pattern Window
.azp
CSV
AZ:Trace View Window
.azt
CSV
(2) Display information reproduction
Reproduction of display information by loading a display file differs as follows for each window.
- AZ:Analyze Window
The display information is reproduced in the currently open AZ:Analyze Window. To maintain the currently displayed execution transition map, therefore, set the current AZ:Analyze Window to the hold status, then open a
new AZ:Analyze Window and load a display file.
- Other windows
The display information is reproduced in a new window that is opened in the hold status. The display information of the currently displayed window is, therefore, maintained as is on the screen.
Error
In the following cases, the AZ:Error dialog box is opened to display messages.
- If the specified file name format is not correct
- If loading a file that dose not exist is attempt
- If saving data to a write-protected file is attempt
- If loading data that cannot be handled in the current window is attempt
48
User’s Manual U19439EJ1V0UM
APPENDIX A WINDOW REFERENCE
AZ:Analyze Window
This window is used to display trace data, collected as a result of executing an program, in the execution transition
map.
Using this window and each of the windows that can be opened from this window, system timing misses as well as
the entire system itself can be checked and analyzed in units of tasks.
This window can be opened from the AZ850V4 window by any of the following.
• Select the [Browse] menu -> [Analyze...].
• Click the
button on the toolbar.
• Press the [Alt], [B] and [A] keys in that order.
• Press the [Ctrl] + [A] keys at the same time.
Figure A-7. AZ:Analyze Window
(7)
(18)
(14) (5)
(8)
(12)
(1)
(15)
(9)
(6)
(10)
(3)
(16)
(17)
(11)
(4) (2)
(1) Up cursor
(10) Time of up temporary cursor position
(2) Down cursor
(11) Data length
(3) Up temporary cursor
(12) Jump to beginning button
(4) Down temporary cursor
(13) Jump to end button
(5) Object button
(14) Scale modify button
(6) Analysis result (execution transition map)
(15) Simple search button
(7) Time of up cursor position
(16) Time area
(8) Time of down cursor position
(17) Pop-up display
(9) Inter-cursor time
(18) Sort button
User’s Manual U19439EJ1V0UM
(13)
49
APPENDIX A WINDOW REFERENCE
This section describes the following items:
- Explanation of each area
- Menubar
- Toolbar
- About objects
- Understanding the execution transition map
- Verification method in execution transition map
- Caution
- Error
Explanation of each area
(1) Up cursor
This cursor is used to specify the range for measuring a processing time in trace data or for calculating other data
(specify the beginning of the range for which a calculation is to be done).
This cursor can be manipulated by clicking on the transition map while pressing the [Shift] key.
(2) Down cursor
This cursor is used to specify the range for measuring a processing time in trace data or for calculating other data
(specify the end of the range for which a calculation is to be done).
This cursor can be manipulated by clicking on the transition map while pressing the [Ctrl] key.
(3) Up temporary cursor
This cursor indicates a position resulting from a search by using the "simple search button" or pattern search, or
the start position from which a jump is made to the panel of CubeSuite.
When the search result is displayed by using the AZ:Pattern Window, this cursor indicates the start position of the
searched pattern.
When the up cursor is moved, the up temporary cursor also moves to the same position.
This cursor can be manipulated by clicking the left mouse button.
(4) Down temporary cursor
When the search result is displayed by using the AZ:Pattern Window, this cursor indicates the end position of the
searched pattern.
When the down cursor is moved, the down temporary cursor also moves to the same position.
[Remark] Each cursor can be moved by dragging it with the mouse. When the horizontal scroll bar is valid, the
entire screen can be scrolled in the horizontal direction by moving the mouse on the left or right of the
transition map, or out of the horizontal frame, while dragging each cursor.
(5) Object button
A button group that is used to indicate objects (interrupt sources, tasks, eventflags, semaphores, mailboxes, fixedsized memory pools, variable-sized memory pools, mutexes, or data queues) within the collected trace data.
If the object name is too long, part of it is omitted. The correct object name can be displayed by putting the mouse
pointer on the button.
The display sequence of each object can be changed freely, by dragging it with the mouse. For details on the
objects, refer to the "About objects" below.
The simple search button (
50
button) appears by clicking an object name. Clicking the object name once more
User’s Manual U19439EJ1V0UM
APPENDIX A WINDOW REFERENCE
makes the simple search button disappear.
(6) Analysis result (execution transition map)
This area is used to display the result of analyzing a program.
For details on the marks in the transition map, refer to "Understanding the execution transition map" below.
(7) Time of up cursor position
This box displays the relative time from the start of trace data collection until the up cursor position.
The units are milliseconds (ms).
(8) Time of down cursor position
This box displays the relative time from the start of trace data collection until the down cursor position.
The units are milliseconds (ms).
(9) Inter-cursor time
This box displays the time interval between the up cursor and the down cursor.
The units are milliseconds (ms).
(10) Time of up temporary cursor position
This box displays the absolute time from the start of trace data collection until the up temporary cursor position.
The units are milliseconds (ms).
(11) Data length
This box displays the time interval from the start to the end of trace data.
(12) Jump to beginning button
This button is used to move the up cursor and the display screen to the beginning of the trace data.
(13) Jump to end button
This button is used to move the down cursor and display screen to the end of the trace data.
(14) Scale modify button
This button is used to change the display scale for the execution transition map. A drop-down list with a button that
expands the scale by double each time and a button that reduces the scale by 1/2 each time is available.
(15) Simple search button
This button appears by clicking an object name, is used to determine the operation of selected object.
When the
button is clicked, the operation of the object selected is searched in the time axis direction in the
execution transition map, and the up temporary cursor moves to the search position.
When the
button is clicked, the operation of the object selected is searched in the opposite direction as the
time axis, and the up temporary cursor moves to the search position
(16) Time area
This area indicates the standard time between events displayed on the execution transition map.
The unit is displayed at the rightmost position of this area and displayed in milliseconds (ms) microseconds (μs), or
nanoseconds (ns).
When this window is displayed as the equal mode, a guide to the number of events on the transition map is
displayed. In this mode, the unit is the number of events, and the number increases from 1 to 10, 100, and so on,
User’s Manual U19439EJ1V0UM
51
APPENDIX A WINDOW REFERENCE
along with the scale. At this time, [unit] is not displayed at the rightmost position of the area.
(17) Pop-up display
The detailed information can be displayed by putting the mouse pointer on the following position.
- Object button
The name of the object (the ID number of the object)
- Vertical line that indicates a task switch
Time at the task switch
The name of the task/interrupt source before switching
The name of the task/interrupt source after switching
- Service call (orange horizontal line)
The time at issue of the service call - The time at termination of the service call (The time required for the
service call)
Servcall (the name of the service call)
The name of the target object (for some service calls, this information cannot be displayed.)
- Interrupt (orange horizontal line)
The time at occurrence of the interrupt - The time at termination of the interrupt (the time required for the
interrupt)
Int (interrupt source name)
- Vertical line that indicates an access to an object
The time at issue/termination of the service call: the name of a task at the occurrence of an event
Servcall/ServRet (the name of the service call)
Target object name
- The mark indicating service call error (red "x" mark)
The time at termination of the service call
Return value
[Remark] The time information is displayed in milliseconds unit.
(18) Sort button
This button is used to change the sequence in which object buttons are to be displayed. The following
specifications can be made.
Appr
Displays the objects in the sequence in which they were detected as trace data.
Name
Displays the objects according to ASCII code.
ID
Displays the objects according to their ID number.
Pri
Displays the objects according to their priority (valid only for tasks).
[Caution] The objects are sorted by type and displayed, in the order of interrupt source, task, idle routine, eventflag,
semaphore, mailbox, fixed-sized memory pool, variable-sized memory pool, mutex, and data queue.
52
User’s Manual U19439EJ1V0UM
APPENDIX A WINDOW REFERENCE
Menubar
(1) [File] menu
Open...
Opens the Open/Save As dialog box. A previously saved display file, obtained using this
window, is read.
The default extension for the display file of this window is ".az".
The file name is displayed on the titlebar after the display file has been read.
Save...
Opens the Open/Save As dialog box.
The current display information for this window is saved to a display file, which can either be
created newly or by copying and renaming an existing file.
The default extension for the display file of this window is ".az".
Close
Closes this window.
(2) [View] menu
Grid mode
Sets whether grid lines are displayed within the execution transition map.
The cascade menu contains the following.
Grid
Displays grid lines (default).
Ungrid
Does not display grid lines.
View mode
Simple
Specifies the view mode for the execution transition map.
The cascade menu contains the following.
Dose not display vertical lines on the execution transition map.
The function of this item is same as that of the
Standard
Displays only the CPU execution transition.
The function of this item is same as that of the
Detail
button.
Displays the "mark" of the service call access state of the RX850V4 (default).
The function of this item is same as that of the
Equal
button.
button.
The length of the horizontal line on the transition map becomes equal between events
regardless of the execution time of the CPU (if not selected this menu item, a graph in
proportion to the execution time of the CPU is displayed).
The function of this item is same as that of the
button.
Small
Reduces the scale of the execution transition map. The function of this item is the same as
that of the "scale modify button".
Large
Expands the scale of the execution transition map. The function of this item is the same as
that of the "scale modify button".
Find...
Opens the Pattern Search dialog box.
The function of this item is same as that of the
User’s Manual U19439EJ1V0UM
button.
53
APPENDIX A WINDOW REFERENCE
Sort Object
Specifies the sequence in which object buttons are to be displayed.
The cascade menu contains the following.
The objects are sorted by type and displayed, in the order of interrupt source, task, idle
routine, eventflag, semaphore, mailbox, fixed-sized memory pool, variable-sized memory
pool, mutex, and data queue.
Appear
Displays the objects in the sequence in which they were detected as trace data (default).
Name
Displays the objects according to ASCII code.
ID
Displays the objects according to their ID number.
Priority
Displays the objects according to their priority (valid only for tasks).
Select Object...
Opens the Object Select dialog box.
The function of this item is same as that of the
button.
(3) [Operation] menu
Active
Switches this window from the hold status to the active status (default).
Hold
Switches this window from the active status to the hold status.
(4) [Browse] menu
CPU...
Opens the AZ:Cpu Window to display the CPU usage between the up cursor and the down
cursor.
While the AZ:Cpu Window is already opened and active, the contents of the window is
updated.
The function of this item is same as that of the
Pattern...
Opens the Pattern Set dialog box.
Setting pattern conditions using this dialog box opens the AZ:Pattern Window.
While the AZ:Pattern Window is already opened and active, the contents of the window is
updated.
The function of this item is same as that of the
Trace View...
button.
button.
Opens the AZ:Trace View Window.
While the AZ:Trace View Window is already opened and active, the contents of the window
is updated.
The function of this item is same as that of the
button.
(5) [Jump] menu
Source Text...
Displays the source text in the Editor panel on CubeSuite at the position set with the up
temporary cursor. While the source text is already displayed on an active status panel, the
contents of the panel is updated.
The function of this item is same as that of the
Assemble...
Displays the disassemble text in the Disassemble panel on CubeSuite at the position set
with the up temporary cursor. While the disassemble text is already displayed on an active
status panel, the contents of the panel is updated.
The function of this item is same as that of the
54
button.
User’s Manual U19439EJ1V0UM
button.
APPENDIX A WINDOW REFERENCE
Memory...
Displays the memory list in the Memory panel on CubeSuite at the position set with the up
temporary cursor. While the memory list is already displayed on an active status panel, the
contents of the panel is updated.
The function of this item is same as that of the
button.
[Caution] If there is no address information at the position specified with the up temporary cursor, none of the items
on the [Jump] menu can be selected.
(6) [Help] menu
This Window
Displays the help window for this window.
Help Topics
Displays the AZ850V4 help window.
Toolbar
The toolbar consists of buttons that can execute frequently used menu items with a single action.
Button
Function
Opens the Open/Save As dialog box. A previously saved display file, obtained using this window, is
read.
The default extension for the display file of this window is ".az".
The file name is displayed on the titlebar after the display file has been read.
Same operation as [File] menu -> [Open...].
Opens the Open/Save As dialog box. The current display information for this window is saved to a
display file, which can either be created newly or by copying and renaming an existing file.
The default extension for the display file of this window is ".az".
Same operation as [File] menu -> [Save...].
Toggles the grid mode of the execution transition map on and off.
Changes the view mode of the execution transition map to the simple mode.
Same operation as [View] menu -> [View mode] -> [Simple].
Changes the view mode of the execution transition map to the standard mode.
Same operation as [View] menu -> [View mode] -> [Standard].
Changes the view mode of the execution transition map to the detailed mode.
Same operation as [View] menu -> [View mode] -> [Detail].
Toggles the equal mode of the execution transition map on and off.
Same operation as [View] menu -> [View mode] -> [Equal].
Opens the Object Select dialog box.
Same operation as [View] menu -> [Select Object...].
Opens the Pattern Search dialog box.
Same operation as [File] menu -> [Find...].
Opens the AZ:Cpu Window to display the CPU usage between the up cursor and the down cursor.
While the AZ:Cpu Window is already opened and active, the contents of the window is updated.
Same operation as [Browse] menu -> [CPU...].
Opens the Pattern Set dialog box. Setting pattern conditions using this dialog box opens the
AZ:Pattern Window. While the AZ:Pattern Window is already opened and active, the contents of the
window is updated.
Same operation as [Browse] menu -> [Pattern...].
User’s Manual U19439EJ1V0UM
55
APPENDIX A WINDOW REFERENCE
Button
Function
Opens the AZ:Trace View Window for the range starting at the position set with the up temporary
cursor.
While the AZ:Trace View Window is already opened and active, the contents of the window is updated.
Same operation as [Browse] menu -> [Trace View...].
Displays the source text in the Editor panel on CubeSuite at the position set with the up temporary
cursor. While the source text is already displayed on an active status panel, the contents of the panel is
updated.
If there is no address information at the position specified with the up temporary cursor, this button
cannot be selected.
Same operation as [Jump] menu -> [Source Text...].
Displays the disassemble text in the Disassemble panel on CubeSuite at the position set with the up
temporary cursor. While the disassemble text is already displayed on an active status panel, the
contents of the panel is updated.
If there is no address information at the position specified with the up temporary cursor, this button
cannot be selected.
Same operation as [Jump] menu -> [Assemble...].
Displays the memory list in the Memory panel on CubeSuite at the position set with the up temporary
cursor. While the memory list is already displayed on an active status panel, the contents of the panel
is updated.
If there is no address information at the position specified with the up temporary cursor, this button
cannot be selected.
Same operation as [Jump] menu -> [Memory...].
About objects
(1) Object names
The buttons used to indicate objects are defined as follows:
- RX850V4 objects
The name of the object (task, eventflag, semaphore, mailbox, fixed-sized memory pool, variable-sized memory
pool, mutex, or data queue) is indicated by the name that is defined in the system configuration file (CF definition
file).
If the object name is too long, part of it is omitted. The correct object name can be displayed by putting the
mouse pointer on the object button.
However, an idle routine or a task whose ID number is unknown (unidentified task) is displayed as follows:
Idle task
Unidentified task
[Caution] In the system configuration file (CF definition file), if the ID number is specified without an object name
specified, the ID number will be displayed as the object name.
[Remark] The ID number of task may not be able to be identified due to the following causes.
- If the program is executed in the middle of a task.
- When the trace buffer is specified in the "ring buffer" type (refer to the "(4) [Soft Form Buffer
Type]"), and if a task appears at the beginning of the buffer after trace data has gone around the
buffer.
56
User’s Manual U19439EJ1V0UM
APPENDIX A WINDOW REFERENCE
- Interrupt objects
The interrupt source name obtained from CubeSuite is indicated.
If the interrupt source name cannot be obtained, the following default names are indicated.
Maskable interrupt (xxxx: Exception code (hexadecimal))
- Other objects
Object group that is set as hidden using the Object Select dialog box or mouse rightclick menu.
(2) Modifying the order in which objects are displayed
The display sequence of each object can be changed by dragging the object with the mouse (the display sequence
can also be changed by the Sort button on this window).
By right-clicking the object button, the following pop-up menu is displayed, and the selected object can be specified
as hidden.
Hide
Hides the selected object.
If the
that indicates an object group to be hidden is right-clicked, the following pop-up menu is
displayed.
Show All
Displays all objects.
Show
Specifies the object to be displayed.
The cascade menu contains the list of the hidden objects.
[Remark] Selecting objects to be hidden and modifying the order in which objects are displayed is also available in
the Object Select dialog box.
User’s Manual U19439EJ1V0UM
57
APPENDIX A WINDOW REFERENCE
Understanding the execution transition map
The execution transition map is displayed in three view modes: "simple mode", "standard mode", "detailed mode".
In each of these display modes, "equal mode" can also be specified.
These view modes can be specified by selecting the [View] menu -> [View mode].
(1) Simple mode
(2) Standard mode
(3) Detailed mode (default)
(4) Equal mode
[Remark] Whether to display grid lines in the execution transition map can be specified by selecting the [View]
menu -> [Grid mode].
(1) Simple mode
Only those points at which the CPU is operating are indicated, using horizontal lines. This mode is well suited to
analyzing trace data over a wide range.
The solid orange line indicates the processing of a service call of RX850V4.
Figure A-8. AZ:Analyze Window (Simple Mode)
(2) Standard mode
CPU state transitions are indicated using continuous, joined lines.
The solid orange line indicates the processing of a service call of RX850V4.
Figure A-9. AZ:Analyze Window (Standard Mode)
58
User’s Manual U19439EJ1V0UM
APPENDIX A WINDOW REFERENCE
(3) Detailed mode (default)
In addition to the CPU state transitions, those RX850V4 service calls that are related to managing memory pools
and synchronous communications are indicated using "marks " (refer to the "Table A-3. List of Marks in
AZ:Analyze Window" for details on the mark).
The detailed mode is selected when this window is opened. This mode is well suited to analyzing the accesses
made to each object.
Figure A-10. AZ:Analyze Window (Detailed Mode)
(a) The CPU accepts the interrupt in the Idle state (Halt state) and processing shifts to the handling of the interrupt.
(b) Processing shifts to the handling of Task2.
(c) Processing shifts to the handling of Task3.
(d) The CPU accepts an interrupt.
(e) Task2 issues a wai_flg service call to event flag EventFlag1.
Because Task2 enters the wait state, processing shifts to the handling of Task3.
(f) Task3 issues a set_flg service call to event flag EventFlag1.
(g) The wai_flg service call issued by Task2 returns, so that the wait state is cleared.
(h) Task2 issues a get_blf service call to memory pool Mempool1.
(i) An error is returned in response to the service call issued in (h).
(j) Task3 issues a sig_sem service call to semaphore Semaphore1.
User’s Manual U19439EJ1V0UM
59
APPENDIX A WINDOW REFERENCE
Table A-3. List of Marks in AZ:Analyze Window
Mark
light blue
Description
Indicates that any of the following service call was issued to each object, and the corresponding
returned.
Object to be Accessed
green
Issued Service Call
Event flag
wai_flg, pol_flg, ipol_flg, twai_flg
Semaphore
wai_sem, pol_sem, ipol_sem, wai_sem
Data queue
rcv_dtq, prcv_dtq, ircv_dtq, trcv_dtq, snd_dtq, tsnd_dtq
Mailbox
rcv_mbx, prcv_mbx, trcv_mbx, ircv_mbx
Mutex
loc_mtx, ploc_mtx, tloc_mtx
Fixed-sized memory pool
get_mpf, pget_mpf, iget_mpf, tget_mpf
Variable-sized memory pool
get_mpl, pget_mpl, iget_mpl, tget_mpl
Indicates that any of the following service call was issued to each object.
Object to be Accessed
Red
Issued Service Call
Event flag
set_flg, iset_flg, clr_flg, iclr_flg
Semaphore
sig_sem, isig_sem
Data queue
snd_dtq, psnd_dtq, ipsnd_dtq, tsnd_dtq, fsnd_dtq, ifsnd_dtq,
rcv_dtq, trcv_dtq
Mailbox
snd_mbx, isnd_mbx
Mutex
unl_mtx
Fixed-sized memory pool
rel_mpf, irel_mpf
Variable-sized memory pool
rel_mpl, irel_mpl
Indicates that the issue of a service call results in an error.
Indicates that the service call that was issued has returned a time-out.
This mark is displayed together with the red error mark above.
60
User’s Manual U19439EJ1V0UM
APPENDIX A WINDOW REFERENCE
(4) Equal mode
If the equal mode is not specified (default), the horizontal line between events, such as the entrance/exit of a
service call, the entrance/exit of an interrupt processing or a task switch, are displayed in proportion to the
execution time of the CPU, as shown in Figure A-11.
Figure A-11. AZ:Analyze Window (When Equal Mode Is Not Specified)
The lengths of the horizontal lines are displayed in proportion to
the processing time of the CPU.
In contrast, if the equal mode is specified, the horizontal line between events, such as the entrance/exit of a service
call, the entrance/exit of an interrupt or a task switch, are displayed not in proportion to the execution time of the
CPU, but at a regular interval, as shown in Figure A-12.
Figure A-12. AZ:Analyze Window (When Equal Mode Is Specified)
The lengths of the horizontal lines are displayed not in proportion to
the processing time of the CPU but at a regular interval.
This mode is well suited to analyzing the transition relationship between a task and interrupt processing.
User’s Manual U19439EJ1V0UM
61
APPENDIX A WINDOW REFERENCE
Verification method in execution transition map
To check the collected trace data using this window, the following search methods are supported:
(1) Search using the simple search button
(2) Search using the Pattern Search dialog box
(3) Search using the AZ:Pattern Window
(1) Search using the simple search button
Using the simple search button (
button), a search can be made for the processing of a specified object.
The simple search button is displayed at both ends of the transition map by clicking a object name. The operation
method is as follows:
(a) If the up temporary cursor is displayed in the execution transition map, move the up temporary cursor to the
search start position. If the up temporary cursor is not displayed, move the up cursor to the search start position.
(b) Clicking the button corresponding to the object whose operation is to be confirmed causes the simple search
button to be displayed. The simple search button is displayed immediately to the right of the object name, and
at the right edge of the execution transition map.
(c) Click the simple search button.
A search is made for the specified object processing, in the direction of the time axis of the
execution transition map. Within the window, the up temporary cursor is shifted to the position
identified by the search.
A search is made for the specified object processing, in the direction opposite to that of the time
axis of the execution transition map. Within the window, the up temporary cursor is shifted to the
position identified by the search.
If the identified point does not fall within the range currently displayed by the execution transition map, the map is
shifted with the identified position being used as the origin.
When the object name is clicked again, the simple search button disappears from the screen.
(2) Search using the Pattern Search dialog box
A search can be made for a specific event (switching point of a task, occurrence of an interrupt, issue of a service
call, etc.) set by the Pattern Search dialog box, in the execution transition map. The search result is indicated by
the up temporary cursor on the execution transition map.
Refer to the Pattern Search dialog box for details.
(3) Search using the AZ:Pattern Window
A search can be made for a pattern (the processing interval of a task or an interrupt) set by the AZ:Pattern Window,
in the execution transition map. The search result is indicated by the up/down temporary cursor on the execution
transition map.
Refer to the AZ:Pattern Window for details.
62
User’s Manual U19439EJ1V0UM
APPENDIX A WINDOW REFERENCE
Caution
- The data for the execution transition map is not updated automatically. Once trace data has been newly
collected by executing an program, therefore, uploading (select the [Operation] menu -> [Upload] on the
AZ850V4 window) must be performed to update the execution transition map.
- If there is no address information in trace data at the position specified with the up temporary cursor, none of the
items on the [Jump] menu can be selected.
Error
In the following cases, the AZ:Error dialog box is opened to display messages.
- If an attempt is made to set the AZ:Analyze Window in the hold status to the active status when another
AZ:Analyze Window in the active status exists.
User’s Manual U19439EJ1V0UM
63
APPENDIX A WINDOW REFERENCE
Object Select dialog box
This dialog box is used to select the objects to be displayed in the AZ:Analyze Window and to modify the order in
which those objects are displayed.
The function of this dialog box can also be realized by "sort button" in the AZ:Analyze Window (for details, refer to
"About objects").
This dialog box can be opened from the AZ:Analyze Window by any of the following.
• Select the [View] menu -> [Select Object...].
• Click the
button on the toolbar.
• Press the [Alt], [V] and [O] keys in that order.
Figure A-13. Object Select Dialog Box
(1) [Hide objects]
(3) [Sort mode]
This section describes the following items:
- Explanation of each area
- Function buttons
- Operating method
64
User’s Manual U19439EJ1V0UM
(2) [Show objects]
APPENDIX A WINDOW REFERENCE
Explanation of each area
(1) [Hide objects]
This area is used to display a list of those objects, from among trace data, that are not to be displayed on the
execution transition map.
The horizontal scroll bar is available when a object name is too long. The vertical scroll bar is available when too
many objects are listed.
(2) [Show objects]
This area is used to display a list of those objects that are to be displayed on the execution transition map.
In the default, all of the objects contained in trace data are displayed.
The display order specified in this area is applied to the execution transition map.
The horizontal scroll bar is available when a object name is too long. The vertical scroll bar is available when too
many objects are listed.
(3) [Sort mode]
This area is used to specify the order into which the objects in the [Hide objects] or [Show objects] will be sorted.
Function buttons
Button
Function
Show >>
Moves those objects selected in the [Hide objects] to the [Show objects]. If the destination
has already been specified, the object is inserted immediately ahead of the specified position.
If the destination has not been specified, the object is inserted at the end of the list.
<< Hide
Moves those objects selected in the [Show objects] to the [Hide objects]. If the destination
has already been specified, the object is inserted immediately ahead of the specified position.
If the destination has not been specified, the object is inserted at the end of the list.
OK
Updates the execution transition map based on the objects listed in the [Show objects].
Cancel
Closes this dialog box.
Help
Displays the help window for this dialog box.
User’s Manual U19439EJ1V0UM
65
APPENDIX A WINDOW REFERENCE
Operating method
(1) Restricting the objects to be displayed
The objects to be displayed in the execution transition map can be restricted by the following method.
(a) From the list displayed in the [Show objects], select those objects that need not be displayed in the execution
transition map.
(b) Click the [<< Hide] button. The selected object is moved to the [Hide objects]. If the destination has already
been specified, the object is inserted immediately ahead of the specified position. If the destination has not
been specified, the object is inserted at the end of the list.
(c) Click the [OK] button to update the execution transition map.
[Remark] The objects restricted are displayed collectively as
in the execution transition map.
(2) Adding objects to be displayed
The objects to be displayed in the execution transition map can be added by the following method.
(a) From those objects listed in the [Hide objects], select objects that need to add to the execution transition map.
(b) Click the [Show >>] button. The selected objects are moved into the [Show objects]. If the destination has
already been specified, the object is inserted immediately ahead of the specified position. If the destination has
not been specified, the object is inserted at the end of the list.
(c) Click the [OK] button to update the execution transition map.
(3) Modifying the order in which objects are displayed
Objects listed in the [Hide objects] and [Show objects] are classified into interrupt sources, tasks, idle routines,
eventflags, semaphores, mailboxes, fixed-sized memory pools, variable-sized memory pools, mutexes, and data
queues (default).
To modify the order in which these objects are displayed, select the desired sort order from the drop-down list of
the [Sort mode].
In the execution transition map, the display order specified in the [Show objects] is applied.
The following sort modes can be select:
Table A-4. Sort Mode for Objects
Sort mode
66
Description
None
No-sort mode (default)
Appear
In the order in which trace data is detected
Name
According to ASCII code, within each object class
ID
According to ID, within each object class
Priority
According to priority (valid only when tasks are to be displayed)
User’s Manual U19439EJ1V0UM
APPENDIX A WINDOW REFERENCE
Pattern Search dialog box
This dialog is used to set the search conditions that are applied when a search is made for a specific event (switching point of a task, occurrence of an interrupt, issue of a service call, etc.) in the execution transition map of the
AZ:Analyze Window.
This dialog box can be opened from the AZ:Analyze Window by any of the following.
• Select the [View] menu -> [Find...].
• Click the
button on the toolbar.
• Press the [Alt], [V] and [F] keys in that order.
• Press the [Ctrl] + [F] keys at the same time.
Figure A-14. Pattern Search Dialog Box
(1) Search mode selection area
(2) Search condition setting area
[Remark] The contents of the Search condition setting area differ depending on the selection of the Search mode
selection area.
This section describes the following items:
- Explanation of each area
- Function buttons
- Search method
User’s Manual U19439EJ1V0UM
67
APPENDIX A WINDOW REFERENCE
Explanation of each area
(1) Search mode selection area
This area is used to select the type of an event to be searched as search mode.
The contents displayed in the Search condition setting area vary depending on this search mode.
Select the search mode from the following:
Table A-5. Search Modes
Search Mode
Description
Task Switch
Searches for task switching positions.
Service Call(Call)
Searches for those positions where a service call was called.
Service Call(Return)
Searches for those positions where a service call was returned.
Service Call((Error)
Searches for those positions where an error was returned in response to a service call.
(2) Search condition setting area
This area is used to specify the search conditions corresponding to the search mode specified with the Search
mode selection area.
The items to be set depend on the specified search mode.
Select the search condition for each item from the drop-down list.
The following search conditions are available:
Table A-6. Search Conditions (When [Task Switch] Is Selected)
Item
Meaning of Condition
Task (upper)
Specify the pre-switching task name or interrupt source name. When the specification
of the task or interrupt is not critical, specify [* ANY *].
Task (lower)
Specify the post-switching task name or interrupt source name. When the
specification of the task or interrupt is not critical, specify [* ANY *].
Interrupt
Specify whether switching to (or from) an interrupt processing is to be included in the
search object. Specifying [Valid] causes the interrupt processing transition to be used
as a search object. When [Invalid] is specified, the interrupt processing transition is
not used as a search object[Note].
Table A-7. Search Conditions (When [Service Call(Call/Return/Error)] Is Selected)
Item
68
Meaning of Condition
Task
Specify the task name or interrupt source name that issues a service call. When the
specification of the task or interrupt is not critical, specify [* ANY *].
Service Call
Specify the name of the service call. When the specification of the service call is not
critical, specify [* ANY *].
Object
Specify the target object of the service call. When the specification of the object is not
critical, specify [* ANY *].
User’s Manual U19439EJ1V0UM
APPENDIX A WINDOW REFERENCE
[Note]
The position for which a search is made vary with the specification of [Valid]/[Invalid] for the Interrupt item,
as follows, where switching from [* ANY *] to [_task2] is assumed to be specified as the search conditions:
(a)
Valid
Found as switching from [_task1] to [_task2]
Invalid
Found as switching from [_task1] to [_task2]
(b)
Valid
Found as switching from [interrupt] to [_task2]
Invalid
Switching from interrupt handling is ignored but this position is found as switching from
[_task1] to [_task2].
(c)
Valid
Found as switching from [interrupt] to [_task2]
Invalid
Switching from interrupt handling is ignored, so that this position is assumed to be
switching from [_task2] to [_task2] and, therefore, is not found as switching which
matches the conditions.
Function buttons
Button
Function
Search(Fore)
A search is made for those positions that correspond to the specified conditions, starting from
the position indicated by the up cursor or up temporary cursor on the execution transition map,
in the direction of the time axis. Then, the up temporary cursor is moved to the positions
determined by the search.
Search(Back)
A search is made for those positions that correspond to the specified conditions, starting from
the position indicated by the up cursor or up temporary cursor on the execution transition map,
in the direction opposite to the time axis. Then, the up temporary cursor is moved to the
positions determined by the search.
Close
Closes this dialog box.
Help
Displays the help window for this dialog box.
User’s Manual U19439EJ1V0UM
69
APPENDIX A WINDOW REFERENCE
Search method
A search can be made for the desired position on the AZ:Analyze Window by the following method.
(1) Specifying the position from which a search is to be started:
When the up temporary cursor is displayed in the execution transition map, move the up temporary cursor to
the start position. Otherwise, move the up cursor to the start position.
(2) Selecting a search mode:
Select a desired search mode in the Search mode selection area on this dialog box.
(3) Selecting search conditions:
Select the search condition for each item form the drop-down list in the Search condition setting area on this
dialog box.
(4) Clicking the function button:
- When the [Search(Fore)] button is clicked:
Search starts from the specified position, in the direction of the time axis. The up temporary cursor is shifted
to the position identified by the search.
- When the [Search(Back)] button is clicked:
Search starts from the specified position, in the direction opposite to the time axis. The up temporary cursor
is shifted to the position identified by the search.
70
User’s Manual U19439EJ1V0UM
APPENDIX A WINDOW REFERENCE
AZ:Cpu Window
This window is used to display the CPU usage status within the period specified with the up cursor and down cursor
in the execution transition map of the AZ:Analyze Window.
Using this window, the execution time of a specified task or interrupt can be confirmed, and the target data performance can be evaluated, base on the idle time and interrupt time.
This window can be opened from the AZ:Analyze Window by any of the following.
• Select the [Browse] menu -> [CPU...].
• Click the
button on the toolbar.
• Press the [Alt], [B] and [C] keys in that order.
• Press the [Ctrl] + [C] keys at the same time.
Figure A-15. AZ:Cpu Window
(1)
(4)
(2)
(7)
(5)
(3)
(8)
(6)
(1) Time of up cursor position
(5) Total execution time for an object
(2) Time of down cursor position
(6) CPU usage
(3) Total time
(7) Time percentage of task execution
(4) Object name
(8) Time percentage of system execution
This section describes the following items:
- Explanation of each area
- Menubar
- Toolbar
- CPU usage display method
- Caution
- Error
User’s Manual U19439EJ1V0UM
71
APPENDIX A WINDOW REFERENCE
Explanation of each area
(1) Time of up cursor position
This box indicates the time at which calculation of the CPU usage was started.
After the start of trace data collection, the relative time that has elapsed is indicated by the position of the up cursor
on the execution transition map. The units are milliseconds (ms).
(2) Time of down cursor position
This box indicates the time at which calculation of the CPU usage was ended.
After the start of trace data collection, the relative time that has elapsed is indicated by the position of the down
cursor on the execution transition map. The units are milliseconds (ms).
(3) Total time
This box indicates the duration for which the CPU usage was calculated.
The duration is indicated by the distance between the up and down cursors. The units are milliseconds (ms).
(4) Object name
This area is used to display a list of the names of the objects that exist in the total time range.
The horizontal scroll bar is available when the object name is too long.
(5) Total execution time for an object
This area is used to display the total of the system processing time and the time required to execute a task or that
of a task related to interrupt processing in the total time range.
(6) CPU usage
This area is used to display the bar graph for indicating the proportion of the total time occupied by the total
execution time of each object.
The displayed graphs are broken down into two part: "time percentage of task execution (brown)" and "time
percentage of system execution (orange)".
(7) Time percentage of task execution
This area is used to display the proportion of the task processing execution time to the total time.
(8) Time percentage of system execution
This area is used to display the proportion of the system processing execution time (including the execution time of
the interrupt handler) to the total time.
72
User’s Manual U19439EJ1V0UM
APPENDIX A WINDOW REFERENCE
Menubar
(1) [File] menu
Open...
Opens the Open/Save As dialog box.
A previously saved display file, obtained using this window, is read.
The default extension for the display file of this window is ".azc".
The file name is displayed on the titlebar after the display file has been read.
Save...
Opens the Open/Save As dialog box.
The current display information for this window is saved to a display file, which can either be
created newly or by copying and renaming an existing file.
The default extension for the display file of this window is ".azc".
Close
Closes this window.
(2) [View] menu
Sort Appear
Displays the objects in the sequence in which they are detected as trace data.
The function of this item is same as that of the
Sort Name
Displays the objects in alphabetical order.
The function of this item is same as that of the
Sort Time
button.
Displays the objects in ascending order of execution time (default).
The function of this item is same as that of the
Sort Analyze
button.
button.
Displays the objects in same order as the execution transition map.
The function of this item is same as that of the
button.
(3) [Operation] menu
Active
Switches this window from the hold status to the active status (default).
Hold
Switches this window from the active status to the hold status.
(4) [Jump] menu
Pattern...
Opens the AZ:Pattern Window corresponding to the specified object. While the AZ:Pattern
Window in the active status is already opened, the contents of the window is updated.
The function of this item is same as that of the
button.
The pattern calculated with this menu item is automatically set as follows:
< Start point>: Task Switch, [* ANY *] -> [Specified object]
< End point>: Task Switch, [Specified object] -> [* ANY *]
<Interrupt>:
Valid
(5) [Help] menu
This Window
Displays the help window for this window.
Help Topics
Displays the AZ850V4 help window.
User’s Manual U19439EJ1V0UM
73
APPENDIX A WINDOW REFERENCE
Toolbar
The toolbar consists of buttons that can execute frequently used menu items with a single action.
Button
Function
Opens the Open/Save As dialog box. A previously saved display file, obtained using this window, is
read.
The default extension for the display file of this window is ".azc".
The file name is displayed on the titlebar after the display file has been read.
Same operation as [File] menu -> [Open...].
Opens the Open/Save As dialog box. The current display information for this window is saved to a
display file, which can either be created newly or by copying and renaming an existing file.
The default extension for the display file of this window is ".azc".
Same operation as [File] menu -> [Save...].
Displays the objects in the sequence in which they are detected as trace data.
Same operation as [View] menu -> [Sort Appear].
Displays the objects in alphabetical order.
Same operation as [View] menu -> [Sort Name].
Displays the objects in ascending order of execution time (default).
Same operation as [View] menu -> [Sort Time].
Displays the objects in the same order as the AZ:Analyze Window.
Same operation as [View] menu -> [Sort Analyze].
Opens the AZ:Pattern Window corresponding to the specified object. While the AZ:Pattern Window in
the active status is already opened, the contents of the window is updated.
< Start point>: Task Switch, [* ANY *] -> [Specified object]
< End point>: Task Switch, [Specified object] -> [* ANY *]
<Interrupt>:
Valid
Same operation as [Jump] menu -> [Pattern...].
CPU usage display method
By the following method, the CPU usage is displayed within the specified range.
(1) Setting the up and down cursors:
The CPU usage is calculated within the period specified with the up cursor and down cursor on the execution
transition map in the AZ:Analyze Window
Specify the range for which the total CPU usage is to be calculated, using the up cursor and down cursor.
(2) Opening the AZ:Cpu Window:
Select the [Browse] menu -> [CPU...] on the AZ:Analyze Window to open this window.
If the AZ:Cpu Window is left open and either the up cursor or down cursor is repositioned in the execution transition
map, the displayed CPU usage is automatically updated.
Caution
- Closing the AZ:Analyze Window also closes this window.
- If the
74
object is selected, the [Jump] menu -> [Pattern...] cannot be selected.
User’s Manual U19439EJ1V0UM
APPENDIX A WINDOW REFERENCE
Error
In the following cases, the AZ:Error dialog box is opened to display messages.
- If an attempt is made to set the AZ:Cpu Window in the hold status to the active status when another AZ:Cpu Window in the active status exists.
User’s Manual U19439EJ1V0UM
75
APPENDIX A WINDOW REFERENCE
Pattern Set dialog box
This dialog box is used to set a pattern to be displayed in the AZ:Pattern Window.
The pattern means the duration of the CPU processing from the point at which a specific event (switching point of a
task, occurrence of an interrupt, issue of a service call, etc.) occurs to the point at which the event ends or another
event occurs.
This dialog box can be opened as follows:
[In the AZ:Analyze Window]
• Select the [Browse] menu -> [Pattern...].
• Click the
button on the toolbar.
• Press the [Alt], [B] and [P] keys in that order.
• Press the [Ctrl]+[P] keys at the same time.
[In the AZ:Pattern Window]
• Select the [Option] menu -> [Pattern Set...]
• Click the
button on the toolbar.
• Press the [Alt], [P] and [S] keys in that order.
• Press the [Ctrl]+[P] keys at the same time.
Figure A-16. Pattern Set Dialog Box
(1) Pattern mode selection area
(2) Pattern condition setting area
[Remark] The contents of the Pattern condition setting area differ depending on the selection of the Pattern mode
selection area.
76
User’s Manual U19439EJ1V0UM
APPENDIX A WINDOW REFERENCE
This section describes the following items:
- Explanation of each area
- Examples of patterns
- Function buttons
- Error
Explanation of each area
(1) Pattern mode selection area
This area is used to select the pattern mode.
Select the type of the event that is to act as the start ([From:]) and end ([To:]) points of the pattern displayed in the
AZ:Pattern Window, from the following:
Table A-8. Pattern Modes
Pattern Mode
Description
Task Switch
Task switching positions are used as the start/end point.
Service Call(Call)
Those positions where a service call was called are used as the start/end point.
Service Call(Return)
Those positions where a service call was returned are used as the start/end point.
Service Call(Error)
Those positions where an error was returned in response to a service call are used
as the start/end point.
(2) Pattern condition setting area
This area is used to specify the pattern conditions corresponding to the pattern modes specified with the Pattern
mode selection area.
The items to be set depend on the specified pattern modes.
Select the pattern condition for each item from the drop-down list.
The following search conditions are available:
Table A-9. Pattern Conditions (When [Task Switch] Is Selected)
Item
Meaning of Condition
Task (upper)
Specify the pre-switching task name or interrupt source name. When the specification
of the task or interrupt is not critical, specify [* ANY *].
Task (lower)
Specify the post-switching task name or interrupt source name. When the
specification of the task or interrupt is not critical, specify [* ANY *].
Interrupt
Specify whether switching to (or from) an interrupt is to be included in the search
object. Specifying [Valid] causes the interrupt transition to be used as a search object.
When [Invalid] is specified, the interrupt transition is not used as a search object[Note].
User’s Manual U19439EJ1V0UM
77
APPENDIX A WINDOW REFERENCE
Table A-10. Pattern Conditions (When [Service Call(Call/Return/Error)]Is Selected)
Item
Meaning of Condition
Task
Specify the task name or interrupt source name that issues a service call. When the
specification of the task or interrupt is not critical, specify [* ANY *].
Service Call
Specify the name of the service call. When the specification of the service call is not
critical, specify [* ANY *].
Object
Specify the target object name of the service call. When the specification of the
object is not critical, specify [* ANY *].
[Note]
The position for which a search is made vary with the specification of [Valid]/[Invalid] for the Interrupt item,
as follows:
Pattern conditions : <From>:[* ANY *] -> [_task2] <To>: [_task2] -> [* ANY* ]
Figure A-17. Difference between [Valid] and [Invalid]
When [Valid] is specified
Interrupts are detected as switching objects, so that (a) and (b) are detected as the pattern.
When [Invalid] is specified
Interrupts are not detected as switching objects, so that (c) is detected as the pattern.
In this case, the time at the exit of the interrupt is assumed as the pattern start/end time, and the
calculated time required for executing the pattern will include the time required for handling the interrupt.
Examples of patterns
Examples of setting typical patterns are shown below.
- Analyzing the interrupt handling time
Analyzing the interrupt source "Interrupt1"
Area
78
Pattern Mode
Pattern condition
From
Task Switch
[* ANY *] -> [Interrupt1] ; [Valid]
To
Task Switch
[Interrupt1] -> [* ANY *] ; [Valid]
User’s Manual U19439EJ1V0UM
APPENDIX A WINDOW REFERENCE
- Analyzing the time required for processing a service call
Analyzing the processing time between "Task1" issuing a wai_sem service call and "Semaphore1" being
acquired
Area
Pattern Mode
Pattern Condition
From
Service Call(Call)
[Task1] -> [wai_sem] ; [Semaphore1]
To
Service Call(Return)
[Task1] -> [wai_sem] ; [Semaphore1]
- Analyzing the processing time between a service call being issued and another task being woken up
Analyzing the processing time between "Task1" issuing a wai_tsk service call and processing being passed to
"Task2"
Area
Pattern Mode
Pattern Condition
From
Service Call(Call)
[Task1] -> [wai_tsk]
To
Task Switch
[* ANY *] -> [Task2]
- Analyzing the interval between error returns
Analyzing the interval between the locations from which an error is returned, by "Task1"
Area
Pattern Mode
Pattern Condition
From
Service Call(Error)
[Task1] -> [* ANY *] ; [* ANY *]
To
Service Call(Error)
[Task1] -> [* ANY *] ; [* ANY *]
Function buttons
Button
Function
OK
Searches for the set pattern and calculates its distribution within the range specified by the up
cursor and down cursor in the execution transition map, then opens the AZ:Pattern Window.
Cancel
Closes this dialog box.
Help
Displays the help window for this dialog box.
Error
In the following cases, the AZ:Error dialog box is opened to display messages.
- If a pattern which satisfies the set pattern conditions is not found within trace data
User’s Manual U19439EJ1V0UM
79
APPENDIX A WINDOW REFERENCE
AZ:Pattern Window
This window is used to search for the pattern specified using the Pattern Set dialog box within the range set with the
up cursor and down cursor on the execution transition map, and display a histogram representing the number of times
the pattern appears for given execution duration.
The pattern means the duration of the CPU processing from the point at which a specific event (switching point of a
task, occurrence of an interrupt, issue of a service call, etc.) occurs to the point at which the event ends or another
event occurs.
Using this window, therefore, the worst/average execution time for the processing performed by a program can be
obtained.
This window can be opened as follows:
[In the AZ:Analyze Window]
• Select the [Browse] menu -> [Pattern...], and specify the pattern conditions in the Pattern Set dialog box.
• Click the
button on the toolbar, and specify the pattern conditions in the Pattern Set dialog box.
• Press the [Alt], [B] and [P] keys in that order, and specify the pattern conditions in the Pattern Set dialog box.
• Press the [Ctrl]+[P] keys at the same time, and specify the pattern conditions in the Pattern Set dialog box.
[In the AZ:Cpu Window]
• Select the [Jump] menu -> [Pattern...].
• Click the
button on the toolbar.
• Press the [Ctrl]+[P] keys at the same time.
Figure A-18. AZ:Pattern Window
(1)
(2)
(7)
80
(3)
(4)
(8)
(1) Time of up cursor position
(5) Average value
(2) Time of down cursor position
(6) Number of histogram divisions
(3) Total time
(7) Processing time
(4) Set pattern conditions
(8) Pattern distribution
User’s Manual U19439EJ1V0UM
(5)
(6)
APPENDIX A WINDOW REFERENCE
This section describes the following items:
- Explanation of each area
- Menubar
- Toolbar
- Pattern distribution display method
- Pattern distribution viewing method
- Search from AZ:Pattern Window
- Caution
- Error
Explanation of each area
(1) Time of up cursor position
This box indicates the time at which calculation of the pattern distribution started.
After the start of trace data collection, the relative time that has elapsed is indicated by the position of the up cursor
on the execution transition map. The units are milliseconds (ms).
(2) Time of down cursor position
This box indicates the time at which calculation of the pattern distribution ended.
After the start of trace data collection, the relative time that has elapsed is indicated by the position of the down
cursor on the execution transition map. The units are milliseconds (ms).
(3) Total time
This box indicates the duration for which the pattern distribution was calculated.
The duration is indicated by the distance between the up and down cursors. The units are milliseconds (ms).
(4) Set pattern conditions
This area is used to display the contents of the pattern conditions set with the Pattern Set dialog box.
Putting the mouse pointer on this area displays pop-up window that shows the name of the object (if the object
name is too long, however, part of it is omitted).
(5) Average value
This area is used to display the average time required to execute the set pattern. The units are milliseconds (ms).
(6) Number of histogram divisions
This area is used to display the number of histogram divisions.
By clicking the button on the right, the number of divisions can be changed to any value between 1 and 100.
(7) Processing time
This area is used to display the duration in which the set pattern is processed.
When the number of the histogram divisions is changed, the time width is also changed.
(8) Pattern distribution
This area is used to display a histogram of the obtained processing times for the set pattern that specified with the
up cursor and down cursor of the execution transition map.
User’s Manual U19439EJ1V0UM
81
APPENDIX A WINDOW REFERENCE
Menubar
(1) [File] menu
Open...
Opens the Open/Save As dialog box. A previously saved display file, obtained using this
window, is read.
The default extension for the display file of this window is ".azp".
The file name is displayed on the titlebar after the display file has been read.
Save...
Opens the Open/Save As dialog box. The current display information for this window is
saved to a display file, which can either be created newly or by copying and renaming an
existing file.
The default extension for the display file of this window is ".azp".
Close
Closes this window.
(2) [View] menu
Divide(+)
Increases the number of histogram divisions by 1.
Divide(-)
Reduces the number of histogram divisions by 1.
(3) [Option] menu
Pattern Set...
Opens the Pattern Set dialog box.
The function of this item is same as that of the
button.
(4) [Operation] menu
Active
Switches this window from the hold status to the active status (default).
Hold
Switches this window from the active status to the hold status.
Search(Min)
Indicates, on the execution transition map, the location where the execution duration for the
specified pattern is minimum.
The up temporary cursor is moved to the identified pattern start point, while the down
temporary cursor is moved to the identified pattern end point.
The function of this item is same as that of the
Search(Max)
Indicates, on the execution transition map, the location where the execution duration for the
specified pattern is maximum.
The up temporary cursor is moved to the identified pattern start point, while the down
temporary cursor is moved to the identified pattern end point.
The function of this item is same as that of the
Search(Fore)
button.
button.
Searches the pattern with the next longer execution time compared to the currently
searched pattern after selecting the [Search(Min)] or the
button on the toolbar.
The up temporary cursor is moved to the identified pattern start point, while the down
temporary cursor is moved to the identified pattern end point.
The function of this item is same as that of the
82
User’s Manual U19439EJ1V0UM
button.
APPENDIX A WINDOW REFERENCE
Search(Back)
Searches the pattern with the next shorter execution time compared to the currently
searched pattern after selecting the [Search(Max)] or the
button on the toolbar.
The up temporary cursor is moved to the identified pattern start point, while the down
temporary cursor is moved to the identified pattern end point.
The function of this item is same as that of the
button.
(5) [Help] menu
This Window
Displays the help window for this window.
Help Topics
Displays the AZ850V4 help window.
Toolbar
The toolbar consists of buttons that can execute frequently used menu items with a single action.
Button
Function
Opens the Open/Save As dialog box. A previously saved display file, obtained using this window, is
read.
The default extension for the display file of this window is ".azp".
The file name is displayed on the titlebar after the display file has been read.
Same operation as [File] menu -> [Open...].
Opens the Open/Save As dialog box. The current display information for this window is saved to a
display file, which can either be created newly or by copying and renaming an existing file.
The default extension for the display file of this window is ".azp".
Same operation as [File] menu -> [Save...].
Opens the Pattern Set dialog box.
Same operation as [Option] menu -> [Pattern Set...].
Indicates, on the execution transition map, the location where the execution duration for the specified
pattern is minimum.
The up temporary cursor is moved to the identified pattern start point, while the down temporary cursor
is moved to the identified pattern end point.
Same operation as [Operation] menu -> [Search(Min)].
Searches for the location where the execution duration for the pattern is the largest, after that identified
by the previous search.
The up temporary cursor is moved to the identified pattern start point, while the down temporary cursor
is moved to the identified pattern end point.
Same operation as [Operation] menu -> [Search(Back)].
Searches for the location where the execution duration for the pattern is the smallest, after that
identified by the previous search.
The up temporary cursor is moved to the identified pattern start point, while the down temporary cursor
is moved to the identified pattern end point.
Same operation as [Operation] menu -> [Search(Fore)].
Indicates, on the execution transition map, the location where the execution duration for the specified
pattern is maximum.
The up temporary cursor is moved to the identified pattern start point, while the down temporary cursor
is moved to the identified pattern end point.
Same operation as [Operation] menu -> [Search(Max)].
User’s Manual U19439EJ1V0UM
83
APPENDIX A WINDOW REFERENCE
Pattern distribution display method
By the following method, the distribution of a pattern is displayed within the specified range.
(1) Setting the up and down cursors:
The distribution of a pattern is calculated within the period specified with the up cursor and down cursor on the
execution transition map in the AZ:Analyze Window
Specify the range for which pattern distribution is to be calculated, using the up cursor and down cursor.
(2) Setting the pattern:
Select the [Browse] menu -> [Pattern...] on the AZ:Analyze Window to open the Pattern Set dialog box.
In this dialog box, specify the the pattern modes and the pattern conditions corresponding to the start/end point
of the pattern to be calculated (refer to the Pattern Set dialog box for details on setting method).
(3) Open the AZ:Pattern Window:
Click the [OK] button on the Pattern Set dialog box to open this window.
If the Pattern Window is left open and either the up cursor or down cursor is repositioned in the execution transition
map, the displayed distribution of the pattern is automatically updated.
Pattern distribution viewing method
Figure A-19 shows the example for analysis of the processing time for "Task1".
Figure A-19. Pattern Distribution Viewing Method
Indicates that the average processing time for "Task1" is 0.155 ms.
Indicates that the execution duration by
dividing the range between the maximum
and minimum processing times for "Task1"
by the value of [Divide].
Indicates that there are 12 positions at which
the processing for "Task1" required a time of
between 0.110350 and 0.200940 ms.
Search from AZ:Pattern Window
Using the Toolbar on this window, a search can be made in the calculated pattern distribution, based on the processing time (such as a search for those locations where the pattern execution duration is a maximum or a minimum).
The result of the search is displayed in the execution transition map.
The up temporary cursor is moved to the identified pattern start point, while the down temporary cursor is moved to
the identified pattern end point.
84
User’s Manual U19439EJ1V0UM
APPENDIX A WINDOW REFERENCE
Caution
- Closing the AZ:Analyze Window also closes this window.
- If this window is in the active status and either the up cursor or down cursor is repositioned in the AZ:Analyze
Window, the contents of this window is automatically updated.
Error
In the following cases, the AZ:Error dialog box is opened to display messages.
- If an attempt is made to set the AZ:Pattern Window in the hold status to the active status when another AZ:Pattern Window in the active status exists.
User’s Manual U19439EJ1V0UM
85
APPENDIX A WINDOW REFERENCE
AZ:Trace View Window
This window is used to list the contents of trace data, displayed as an execution transition map in the AZ:Analyze
Window.
The detailed information about trace data can be obtained by using this window.
This window can be opened from the AZ:Analyze Window by any of the following.
• Select the [Browse] menu -> [Trace View...].
• Click the
button on the toolbar.
• Press the [Alt], [B] and [T] keys in that order.
• Press the [Ctrl]+[T] keys at the same time.
Figure A-20. AZ:Trace View Window
(1) [Time]
(2) [Address]
(3) [Task]
(4) [Event]
This section describes the following items:
- Explanation of each area
- Menubar
- Display method
- Viewing method
- Caution
- Error
86
User’s Manual U19439EJ1V0UM
(5) [Parameter] (6) [Return]
APPENDIX A WINDOW REFERENCE
Explanation of each area
(1) [Time]
This area is used to display the relative time from the AZ trace start time. The units are milliseconds (ms).
(2) [Address]
This area is used to display the execution address of the program.
(3) [Task]
This area is used to display the name of a task (function) or the name of an interrupt source upon occurrence of an
event. Refer to the "About objects" for details on the displaying of names.
(4) [Event]
This area is used to display the type of an event in trace data.
The types of events that can be displayed are as follows:
Table A-11. Types of Events In AZ:Trace View Window
Name
Description
ServCall
Indicates the issue of a service call.
The name of the issued service call is indicated in parentheses.
ServRet
Indicates a return form a service call.
The name of the returned service call is indicated in parentheses. If the event issued by
corresponding service call dose not exist in the trace buffer, however, inside the
parentheses is blank. This happens if the program is executed from the middle.
Int
Indicates the entry of an interrupt.
The name of the interrupt source is indicated in parentheses.
IntRet
Indicates the exit of an interrupt.
The name of the interrupt source is indicated in parentheses.
TaskStart
Indicates the initial start up of a task.
Idle
Indicates transition to the Idle state.
(5) [Parameter]
This area is used to display the name of the target object of the service call when the event type is "ServCall" or
"ServRet".
(6) [Return]
This area is used to display the return value form the service call in a macro name when the event type is
"ServRet".
Note that when can_wup, can_act, ican_wup, or ican_act has been terminated normally, not "E_OK" but the
number of invalidated activation requests is displayed.
For details of the return value, refer to the user's manual of the real-time OS used.
User’s Manual U19439EJ1V0UM
87
APPENDIX A WINDOW REFERENCE
Menubar
(1) [File] menu
Save...
Opens the Open/Save As dialog box. The current display information for this window is
saved to a display file, which can either be created newly or by copying and renaming an
existing file.
The default extension for the display file of this window is ".azt".
Close
Closes this window.
(2) [View] menu
Find...
Opens the Trace Search dialog box.
Timetag
Toggles the display of the [Time] area between on and off.
Select either the [Show] (default) or [Hide], displayed in the cascade menu.
Address
Toggles the display of the [Address] area between on and off.
Select either the [Show] (default) or [Hide], displayed in the cascade menu.
Task]
Toggles the display of the [Task] area between on and off.
Select either the [Show] (default) or [Hide], displayed in the cascade menu.
Event
Toggles the display of the [Event] area between on and off.
Select either the [Show] (default) or [Hide], displayed in the cascade menu.
Parameter
Toggles the display of the [Parameter] area between on and off.
Select either the [Show] (default) or [Hide], displayed in the cascade menu.
Return
Toggles the display of the [Return] area between on and off.
Select either the [Show] (default) or [Hide], displayed in the cascade menu.
(3) [Operation] menu
Active
Switches this window from the hold status to the active status (default).
Hold
Switches this window from the active status to the hold status.
(4) [Help] menu
88
This Window
Displays the help window for this window.
Help Topics
Displays the AZ850V4 help window.
User’s Manual U19439EJ1V0UM
APPENDIX A WINDOW REFERENCE
Display method
By the following method, the list of trace data is displayed from the position specified.
(1) Setting the cursors:
Specify the up temporary cursor to the start position from which trace data is to be displayed, on the execution
transition map in the AZ:Analyze Window (if the up temporary cursor is not displayed, the beginning of trace
data becomes the display start position).
(2) Open the AZ:Trace View Window:
Select the [Browse] menu -> [Trace View...] on the AZ:Analyze Window to open this window.
If the AZ:Trace View Window is left open and the up temporary cursor is repositioned in the execution transition
map, the displayed trace data is automatically updated.
Viewing method
Figure A-21 describes how to read the trace data.
Figure A-21. Trace Data Viewing Method
(a)
(b)
(a) When 0.292 ms has elapsed after the start of the system, task "TSK_MAIN" issued a "sta_tsk" service call to task
"TSK_SUB" at address 0x000212.
(b) When 0.297 has elapsed after the start of the system, the previously issued "sta_tsk" service call returned with a
return value of "E_OK(0000)", at address 0x000212.
[Caution] Regarding [Event] area, if no event for which a service call was issued exists in the trace buffer, the
parentheses include no data. This is caused by execution from a location other than the beginning of the
program, etc.
[Remark] By selecting the [View] menu -> [Find...] on this window to open the Trace Search dialog box, a search
can be made according to conditions such as "task names, interrupt sources, event types, or service call
arguments" (refer to the "Search method").
Caution
- Closing the AZ:Analyze Window also closes this window.
- If this window is in the active status and the up temporary cursor is repositioned in the AZ:Analyze Window, the
displayed trace data is shifted automatically.
User’s Manual U19439EJ1V0UM
89
APPENDIX A WINDOW REFERENCE
Error
In the following cases, the AZ:Error dialog box is opened to display messages.
- If an attempt is made to set the AZ:Trace View Window in the hold status to the active status when another
AZ:Trace View Window in the active status exists.
90
User’s Manual U19439EJ1V0UM
APPENDIX A WINDOW REFERENCE
Trace Search dialog box
This dialog box is used to specify the search conditions applied when searching for trace data in the AZ:Trace View
Window.
This dialog box can be opened from the AZ:Trace View Window by any of the following.
• Select the [View] menu -> [Find...].
• Press the [Alt], [V] and [F] keys in that order.
• Press the [Ctrl]+[F] keys at the same time.
Figure A-22. Trace Search Dialog Box
(1) Search item setting area
(2) Search condition setting area
This section describes the following items:
- Explanation of each area
- Function buttons
- Search method
Explanation of each area
(1) Search item setting area
This area is used to select the search items for trace data in the AZ:Trace View Window.
Select the check box corresponding to the desired search items. Any number of boxes can be selected.
Task
Searches for a task name or an interrupt source name.
Event
Searches for an event type.
Parameter
Searches for a service call argument.
(2) Search condition setting area
This area is used to specify the search conditions for each search item.
The drop-down list displays the task names and interrupt source names, event types, and service call arguments
that exist in the collected trace data.
User’s Manual U19439EJ1V0UM
91
APPENDIX A WINDOW REFERENCE
Function buttons
Button
Function
Search(Fore)
A search is made for a position which satisfies the set search conditions, in the direction of
the trace time axis, and the AZ:Trace View Window is displayed with the search position as
the beginning.
Search(Back)
A search is made for a position which satisfies the set search conditions, in the direction
opposite to the trace time axis, and the AZ:Trace View Window is displayed with the search
position as the beginning.
Cancel
Closes this dialog box.
Help
Displays the help window for this dialog box.
Search method
A search can be made for the desired position in the AZ:Trace View Window by the following method.
(1) Selecting search item(s):
Select the item(s) to be searched in the Search item setting area (any number of items can be selected).
(2) Specifying search condition(s):
Specify the search condition(s) for each search item by using the drop-down lists in the Search condition setting
area.
(3) Click the function button.
- When the [Search(Fore)] button is clicked:
A search is made for a position which satisfies the set search conditions, in the direction of the trace time
axis, and the AZ:Trace View Window is displayed with the search position as the beginning.
- When the [Search(Back)] button is clicked:
A search is made for a position which satisfies the set search conditions, in the direction opposite to the trace
time axis, and the AZ:Trace View Window is displayed with the search position as the beginning.
Examples of setting search conditions in the Trace Search dialog box is shown below.
Figure A-23. Specification Example 1
(To search for the task "TSK_MAIN")
92
User’s Manual U19439EJ1V0UM
APPENDIX A WINDOW REFERENCE
Figure A-24. Specification Example 2
(To search for those locations where the task "TSK_MAIN" has issued a "sta_tsk" service call.)
Figure A-25. Specification Example 3
(To search for those locations where the task "TSK_MAIN" has issued a "sta_tsk" service call for the task "TSK_SUB".)
User’s Manual U19439EJ1V0UM
93
APPENDIX A WINDOW REFERENCE
About dialog box
This dialog box is used to display the version information of AZ850V4.
This dialog box can be opened from the AZ850V4 window by any of the following:
• Select the [Help] menu -> [About...].
• Press the [Ctrl]+[A] keys at the same time.
Figure A-26. About Dialog Box
(1) Version information display area
This section describes the following items:
- Explanation of each area
- Function buttons
Explanation of each area
(1) Version information display area
This area is used to display "Product name, Version number of AZ850V4 [date of product build] and Copyright
year".
Function buttons
Button
OK
94
Function
Closes this dialog box.
User’s Manual U19439EJ1V0UM
APPENDIX A WINDOW REFERENCE
AZ:Error dialog box
This dialog box is used to display the error information of AZ850V4.
This dialog box opens automatically when an invalid operation is performed in the AZ850V4’s window/dialog box.
Figure A-27. AZ:Error Dialog Box
(1) Error information area
This section describes the following items:
- Explanation of each area
- Function buttons
Explanation of each area
(1) Error information area
This area is used to display "error number and error message".
For details of the error information, refer to the "B. 2 Error Massages".
Function buttons
Button
Function
OK
Closes this dialog box.
Help
Displays the help topic corresponding to error information.
User’s Manual U19439EJ1V0UM
95
APPENDIX B MESSAGES
APPENDIX B
MESSAGES
Appendix B provides the error information output from AZ850V4.
B. 1 Overview
If an error occurs during an operation in a window/dialog box, the following AZ:Error dialog box that displays the
error information is displayed.
Figure B-1. Error Information Output Format
Error number
Error messages
B. 2 Error Massages
The error number, error message, description of the error, and action to be taken are explained below.
Table B-1. Error Information List
Error Number
1000
Description
Message
Not enough memory.
Cause
The memory in the machine is insufficient.
Action by User After closing unneeded windows, perform the operation again.
1001
Message
Internal error.
Cause
An error that could not be anticipated has occurred.
Action by User Perform the operation again from the beginning.
1010
Message
The active window already exists.
Cause
Since an active window already exists, the status of the window cannot be
changed to active.
Action by User Either change the status of the active window to hold or close the active window
before making the desired window active.
1021
Message
The file does not exist.
Cause
The specified file name does not exist.
Action by User Specify a correct file name.
96
User’s Manual U19439EJ1V0UM
APPENDIX B MESSAGES
Error Number
1022
Description
Message
Fail to write the file.
Cause
Either there is not sufficient free disk space or the specified file is a read-only file,
so that it cannot be written to.
Action by User Specify a file in a separate disk, or a file that is not read-only.
1023
Message
The file format is illegal.
Cause
The file cannot be read because its format is incorrect.
Action by User Check if it is a file for the AZ850V4’s trace data or not.
1031
Message
The RX850 (μITRON3.0) is downloaded.
Cause
RX850V4 (μITRON4.0) is not embedded into the load module.
Action by User Embed RX850V4 (μITRON4.0) into the load module.
1032
Message
The RX850 Pro(μITRON3.0) is downloaded.
Cause
RX850V4 (μITRON4.0) is not embedded into the load module.
Action by User Embed RX850V4 (μITRON4.0) into the load module.
1100
Message
The debugger does not support AZ interface.
Cause
CubeSuite does not support AZ Interface.
Action by User Confirm that CubeSuite supports AZ Interface.
1110
Message
Fail to switch AZ trace mode.
Cause
An error occurred during the switching processing of the AZ trace mode. The
address mask value may not be correct or communication between CubeSuite
and AZ850V4 may have failed.
Action by User Check that the address mask value is set correctly with the [Address Mask] area
in the AZ Option dialog box. Otherwise restart CubeSuite and AZ850V4.
1118
Message
The buffer region not specified.
Cause
AZ Trace ON was set without a trace buffer area being specified.
Action by User Specify the trace buffer area with the [Soft Form Buffer Region] area in the AZ
Option dialog box, and then set AZ Trace ON.
1120
Message
Fail to load the trace data.
Cause
An error occurred during trace data uploading. The settings of the trace buffer
area may not be correct.
Action by User Check if correct addresses have been specified as the trace buffer area.
1121
Message
The trace data does not exist.
Cause
There is no trace data in the executed data.
Action by User Execute the program in the AZ Trace ON mode and upload the trace data again.
1122
Message
The trace data is illegal.
Cause
The time tag in the trace data may not be correct.
Action by User Check if the user own coding block is correctly coded.
1128
Message
Task level data not included.
Cause
Task-level trace data was not included in the collected trace data.
User’s Manual U19439EJ1V0UM
97
APPENDIX B MESSAGES
Error Number
1210
Description
Message
The trace buffer address is illegal.
Cause
The address range specified for the trace buffer is incorrect.
Action by User Specify a correct address range with the [Soft Form Buffer Region] area in the AZ
Option dialog box.
1220
Message
The address mask is illegal.
Cause
An illegal value that cannot be handled as a mask value was input for the address
mask specification in the AZ Option dialog box.
Action by User Specify a hexadecimal number with the [Address Mask] area in the AZ Option
dialog box.
1400
Message
The pattern does not exist.
Cause
The specified pattern dose not exist in the trace data between the up cursor and
the down cursor.
Action by User Expand the interval between the up cursor and the down cursor, and perform the
operation again. If this error occurs even with the maximum interval, the
specified pattern does not exist in the trace data.
1700
Message
The specified file has an invalid RX type.
Cause
An attempt was made to read an AZ file whose real-time OS differs form the realtime OS specified (RX850V4).
Action by User Check if the appropriate real-time OS (RX850V4) is specified with the [RTOS
Select] area in the AZ Option dialog box.
98
User’s Manual U19439EJ1V0UM
APPENDIX C INDEX
APPENDIX C
INDEX
A
Search method
About dialog box
Toolbar
... 94
Explanation of each area
Function buttons
About objects
Address
Menubar
... 25
... 42
__AZMON_GetCounter
... 26
AZ850V4 window
... 56
Menubar
... 63
Toolbar
... 58
Verification method in execution transition map
... 71
Explanation of each area
... 74
... 46
Equal mode
... 95
... 50
... 50
... 61
Error messages
... 95
Event
... 80
... 96
... 87
Extension of display file
... 85
... 85
Menubar
... 59
E
... 95
Explanation of each area
... 41
... 72
Down temporary cursor
Explanation of each area
Caution
Connection status area
Down cursor
... 72
... 73
AZ:Pattern Window
... 35
Display file
Function buttons
... 41
Detailed mode
... 74
... 75
AZ:Error dialog box
... 39
D
... 74
CPU usage display method
Toolbar
Cautions
CPU usage
... 62
Menubar
... 26
C
... 55
Understanding the execution transition map
Caution
... 26
... 41
Toolbar
... 50
... 53
AZ:Cpu Window
... 26
... 39
Statusbar
... 63
Menubar
Error
... 26
__AZMON_TimePerCount
... 49
Explanation of each area
Error
__AZMON_CountMode
__AZMON_MaxCount
... 40
About objects
... 89
... 28
__AZMON_InitTimer
... 40
AZ:Analyze Window
Caution
AzInit( )
... 44
... 45
AZ trace mode status area
AZ trace ON
... 89
Viewing method
Explanation of each area
... 87
... 88
Search method
... 43
... 45
AZ trace OFF
... 89
... 90
Explanation of each area
... 44
Function buttons
... 86
... 89
Display method
Error
AZ Option dialog box
Error
Caution
... 94
... 87
AZ Monitor
Error
AZ:Trace View Window
... 94
... 56
Address mask
... 84
... 83
... 48
F
... 81
Features
... 82
Pattern distribution display method
... 84
Pattern distribution viewing method
... 84
User’s Manual U19439EJ1V0UM
... 15
99
APPENDIX C INDEX
G
Explanation of each area
Grid mode
Function buttons
... 53
Search method
H
... 70
Pattern Set dialog box
Hard trace form
Hide objects
Error
... 15, 23
... 76
... 79
Explanation of each area
... 65
Function buttons
I
... 29
... 87
inirtn
Int
... 77
... 79
Procedure for debugging
Idle
... 68
... 69
R
... 28
Resource
... 87
IntRet
Return
... 87
... 16
... 87
S
J
Jump to beginning button
Jump to end button
Scale modify button
... 51
Search condition
... 51
Search item
L
... 42
M
Marks of the execution transition map
... 60
... 68, 91
... 91
Search Mode
Load module execution status area
... 51
... 68
ServCall
... 87
ServRet
... 87
Show objects
... 65
Simple mode
... 58
Simple search button
N
Soft trace form
Number of histogram divisions
... 81
Sort mode
Summary
... 51
... 15, 17, 21
... 65, 66
... 14
O
Object
T
... 50
Object Select dialog box
... 64
Adding objects to be displayed
Explanation of each area
Function buttons
Task
... 66
TaskStart
... 65
Time
... 65
... 66
Restricting the objects to be displayed
... 66
... 46
... 87
Display information reproduction
Trace buffer
... 48
... 19
... 18
Trace buffer area
... 44
Trace buffer type
... 44
Trace form
Display file extensions and file formats
Error
... 87
Time accuracy
Modifying the order in which objects are displayed
Open/Save As dialog box
... 87
... 15, 17, 44
Trace Search dialog box
... 48
Explanation of each area
... 48
Function buttons
Explanation of each area
Function buttons
... 91
... 47
Search method
... 92
... 92
... 48
U
P
Parameter
Up cursor
... 87
Pattern condition
Pattern mode
Up temporary cursor
... 77
Upload
... 40
... 77
Pattern Search dialog box
100
... 50
... 67
User’s Manual U19439EJ1V0UM
... 50
... 91
APPENDIX C INDEX
V
Version information
View mode
... 94, 95
... 58
W
Window reference
... 37
User’s Manual U19439EJ1V0UM
101
For further information,
please contact:
NEC Electronics Corporation
1753, Shimonumabe, Nakahara-ku,
Kawasaki, Kanagawa 211-8668,
Japan
Tel: 044-435-5111
http://www.necel.com/
[America]
[Europe]
[Asia & Oceania]
NEC Electronics America, Inc.
2880 Scott Blvd.
Santa Clara, CA 95050-2554, U.S.A.
Tel: 408-588-6000
800-366-9782
http://www.am.necel.com/
NEC Electronics (Europe) GmbH
Arcadiastrasse 10
40472 Düsseldorf, Germany
Tel: 0211-65030
http://www.eu.necel.com/
NEC Electronics (China) Co., Ltd
7th Floor, Quantum Plaza, No. 27 ZhiChunLu Haidian
District, Beijing 100083, P.R.China
Tel: 010-8235-1155
http://www.cn.necel.com/
Hanover Office
Podbielskistrasse 166 B
30177 Hannover
Tel: 0 511 33 40 2-0
Munich Office
Werner-Eckert-Strasse 9
81829 München
Tel: 0 89 92 10 03-0
Stuttgart Office
Industriestrasse 3
70565 Stuttgart
Tel: 0 711 99 01 0-0
United Kingdom Branch
Cygnus House, Sunrise Parkway
Linford Wood, Milton Keynes
MK14 6NP, U.K.
Tel: 01908-691-133
Succursale Française
9, rue Paul Dautier, B.P. 52
78142 Velizy-Villacoublay Cédex
France
Tel: 01-3067-5800
Sucursal en España
Juan Esplandiu, 15
28007 Madrid, Spain
Tel: 091-504-2787
Tyskland Filial
Täby Centrum
Entrance S (7th floor)
18322 Täby, Sweden
Tel: 08 638 72 00
Filiale Italiana
Via Fabio Filzi, 25/A
20124 Milano, Italy
Tel: 02-667541
Shanghai Branch
Room 2509-2510, Bank of China Tower,
200 Yincheng Road Central,
Pudong New Area, Shanghai, P.R.China P.C:200120
Tel:021-5888-5400
http://www.cn.necel.com/
Shenzhen Branch
Unit 01, 39/F, Excellence Times Square Building,
No. 4068 Yi Tian Road, Futian District, Shenzhen,
P.R.China P.C:518048
Tel:0755-8282-9800
http://www.cn.necel.com/
NEC Electronics Hong Kong Ltd.
Unit 1601-1613, 16/F., Tower 2, Grand Century Place,
193 Prince Edward Road West, Mongkok, Kowloon, Hong Kong
Tel: 2886-9318
http://www.hk.necel.com/
NEC Electronics Taiwan Ltd.
7F, No. 363 Fu Shing North Road
Taipei, Taiwan, R. O. C.
Tel: 02-8175-9600
http://www.tw.necel.com/
NEC Electronics Singapore Pte. Ltd.
238A Thomson Road,
#12-08 Novena Square,
Singapore 307684
Tel: 6253-8311
http://www.sg.necel.com/
NEC Electronics Korea Ltd.
11F., Samik Lavied’or Bldg., 720-2,
Yeoksam-Dong, Kangnam-Ku,
Seoul, 135-080, Korea
Tel: 02-558-3737
http://www.kr.necel.com/
Branch The Netherlands
Steijgerweg 6
5616 HS Eindhoven
The Netherlands
Tel: 040 265 40 10
G0706