1
How to utilize the I/Q Software
Interface of the R&S®RTO
Oscilloscope with MATLAB®
Application Note
Products:
l
R&SRTO-K11
l
R&SRTO1014
l
R&SRTO1002
l
R&SRTO1022
l
R&SRTO1004
l
R&SRTO1024
l
R&SRTO1012
l
R&SRTO1044
This application note presents the I/Q
Software Interface (R&S® K11 option) of the
R&S®RTO in the context of remote
applications. It demonstrates the basic
operation, application examples, and an
Rafael Ruiz;Dr. Mathias Hellwig
11.01.2013
Application Note RTO-K11 SW-IQ
analysis in MATLAB®.
Table of Contents
Table of Contents
1TD01_0e
1
Introduction ............................................................................ 3
1.1
Benefits of the I/Q Software Interface Option ............................................4
2
I/Q Software Interface Functionality ..................................... 5
2.1
I/Q Modulated RF Signals ............................................................................7
2.2
Complex I/Q Modulated Signals in low-IF Range ......................................9
2.3
Complex I/Q Baseband Signals ................................................................13
2.4
Common Parameters .................................................................................14
3
Analysis of RTO I/Q Data with MATLAB® ........................... 15
3.1
Measurement Setup ...................................................................................16
3.2
RTO Basic Configuration ...........................................................................19
3.3
RTO I/Q Software Interface – Configuration ............................................20
3.4
Retrieval of I/Q Data ...................................................................................20
3.5
Analysis of I/Q Data ....................................................................................22
4
Conclusion............................................................................ 24
5
Literature............................................................................... 25
6
Ordering Information ........................................................... 26
7
Index ...................................................................................... 26
Rohde & Schwarz - RTO-K11 - 2
Introduction
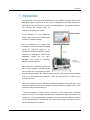
1 Introduction
This application note presents the R&S®RTO-K11 I/Q Software Interface option for the
R&S®RTO Digital Oscilloscope in the context of MathWorks MATLAB® applications.
MATLAB remotely accesses and controls the R&S®RTO-K11 I/Q Software Interface,
and extracts the acquired data for
analysis of I/Q modulated signals.
In the following, the term R&S®RTO
Digital Oscilloscope will be abbreviated
as RTO for simplified reading.
The I/Q modulation is a widely used
modulation scheme for analog and digital
signals [1], frequently referred to as
quadrature amplitude modulation (QAM).
The variety of applications, which can be
addressed,
ranges
from
e.g.
NFC,
WCDMA, LTE, DVB-T to proprietary
digitally modulated signals.
With activated I/Q Software Interface the
RTO acquires digitally modulated signals
and provides the corresponding I/Q data
at a user-defined sample rate. This I/Q data can then be exported to external software
tools to be demodulated and analyzed. There are three options to utilize the I/Q
Software Interface:
Users can configure the RTO manually and start the acquisition of the I/Q data. In this
case the acquired I/Q data can be stored in various formats on a USB memory or the
internal hard disk for a later analysis.
A second possibility is remote control of the RTO. A few simple SCPI commands
suffice to set up the I/Q Software Interface and to transmit the acquired I/Q data to the
analysis tool. Several programming languages can be used for this purpose. However
for this task MATLAB® is an ideal tool, as it offers a wide range of analysis functions
and convenient remote operation.
1TD01_0e
Rohde & Schwarz - RTO-K11 - 3
Introduction
As third alternative Rohde & Schwarz offers off-the-shelf tools for application specific
analysis, for example the R&S®FS-K10xPC [2] LTE analysis software, the R&S®FSK112PC [3] NFC analysis software or the R&S®FS-K96PC [4] OFDM Vector Signal
analysis software. Those tools provide a complete integration of the RTO with installed
I/Q Software Interface option.
First, this application note explains the benefits and the functionality of the RTO I/Q
Software Interface. Afterwards it explains the associated MATLAB instructions via
SCPI commands. These instructions allow a MATLAB program to connect to the
RTO, to configure the I/Q Software Interface, to run an acquisition, to download I/Q
data from the RTO and to import it to MATLAB for further processing.
1.1 Benefits of the I/Q Software Interface Option
The I/Q Software Interface option offers the following major benefits:
The first one is the wide bandwidth of up to 4 GHz (RTO1044) for the acquisition of I/Q
modulated signals. This is advantageous for applications like wideband radar, pulsed
RF signals, high data rate satellite links and frequency hopping communications, which
require a wide bandwidth.
As a second benefit, the RTO provides a multichannel measurement capability. If an
application requires a multi-channel measurement setup like LTE MIMO [5] signals, the
RTO synchronously samples up to 4 channels and maintains the timing relationship
among all channels. In the LTE MIMO application example a synchronous acquisition
of all channels is mandatory.
Another benefit is the ability to acquire long sequences of I/Q data, due to an efficient
use of the acquisition memory. Due to hardware based digital processing steps in the
acquisition path (down-conversion, filtering, resampling - see chapter 2), the total
acquisition time is increased compared to an acquisition without the aforementioned
digital processing. In chapter 3.1 an example will describe this benefit in more detail.
In addition, the bandwidth reduction of the I/Q signal results in an enhancement in
resolution so that the user will benefit from a more precise signal analysis. Filtering and
resampling implement this bandwidth reduction and spectral components of noise
1TD01_0e
Rohde & Schwarz - RTO-K11 - 4
I/Q Software Interface Functionality
outside the filter bandwidth is removed. This results in an improvement of the SNR and
hence in an enhanced resolution.
The RTO shows good hardware performance. It has a highly sensitive, wideband, lownoise front-end, in combination with a high precision, single core ADC, featuring an
ENOB greater than 7. This leads to very good signal analysis results, e.g. EVM. An
example is the analysis of an IEEE802.11ac signal with a channel bandwidth of
80 MHz. The IEEE802.11ac signal, down-converted into the baseband or IF band, is
acquired with the RTO and analyzed with the FS-K96 OFDM Vector Signal Analysis.
The EVM comes out to -42 dB [6], which is very close to the EVM figure that an
analysis with a mid-range spectrum analyzer would provide.
The RTO is the only oscilloscope currently on the market, which offers a processing of
I/Q modulated signals. In comparison with other products, the user does not have to
care about down-conversion, filtering and resampling in his external analysis tool.
Implementing this functionality in software turns out to be slow and error-prone. With
the RTO, which takes care of it, the user can start right away with the analysis of I/Q
modulated signals.
2 I/Q Software Interface Functionality
In order to gain a good understanding of the potential of the I/Q Software Interface, a
simple example is chosen, to elaborate on the features of the I/Q Software Interface.
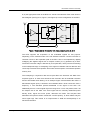
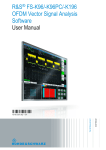
Figure 1 shows a conventional I/Q receiver, which should serve in the following section
as a model for discussion (DUT). It feeds an I/Q modulated RF signal, received from
an antenna to an input amplifier. In the next step, the signal is split and multiplied with
two orthogonal sinusoidal signals, derived from the same source with the carrier
frequency fc. Whether the input signal is shifted into the baseband or to an IF
frequency does not matter for the I/Q Software Interface as the RTO will deal with both
measurement setups. The conventional receiver digitizes the down-converted I/Q
signal and makes it available for further digital signal processing steps.
In the provided example, the RTO can tap the signal at various stages up to 4 GHz,
either directly at the antenna, past the first amplifier stage or as an already downconverted I/Q signal past the band filter. The letters A, B, C in Figure 1 denote the
corresponding measurement points respectively. Based on the measurement point (A,
1TD01_0e
Rohde & Schwarz - RTO-K11 - 5
I/Q Software Interface Functionality
B, C) the appropriate mode in the RTO-K11 needs to be selected. Each mode shows a
block diagram (see Figure 3, Figure 6, and Figure 8) to ease configuration of the RTO.
ADC
Q
ADC
AMP
fc
90°
Digital signal processing
I
I/Q Receiver
A
B
C
Figure 1 Conventional I/Q receiver with measurement points A, B, C
The RTO supports the acquisition of I/Q modulated signals for test purpose.
Depending on the selected mode in the I/Q Software Interface a down-conversion in
real-time is done in the acquisition path of the RTO. This is accomplished by digitally
multiplying the digitized signal with a complex number (ej2πfct) generated by a NCO.
The down-conversion stage is followed by a low-pass filter, which prevents an aliasing
in the subsequent stage. A resampling of the signal in hardware reduces data rate and
conversely increases the acquisition time under the assumption of a limited acquisition
memory size.
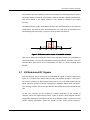
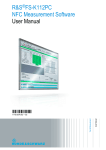
The resampling in conjunction with the low-pass filter also increases the SNR of the
acquired signal or in other terms enhances the resolution due to bandwidth reduction
and the associated noise filtering. As an example Figure 2 demonstrates this effect. A
band-limited signal S(f+fc) is located in the baseband after a down-conversion from a
frequency fc. The allocated spectral bandwidth of the signal is less than 2*fB.
Additionally there is a noise signal N(f) in the range from –fs/2 to fs/2 present, with fs as
the sample rate of the ADC. This noise signal has an uniformly distributed power
density. Both, signal and noise power, determine the SNR. The low-pass filter
attenuates the spectral content outside the cut-off frequency fB, which affects only the
noise signal N(f). This results in an improvement in SNR and subsequently in an
enhanced resolution.
1TD01_0e
Rohde & Schwarz - RTO-K11 - 6
I/Q Software Interface Functionality
The hardware provides sufficient precision so that after the resampling step the data is
stored with higher precision in the acquisition memory than the originally sampled 8-bit.
The user’s benefit in his signal analysis is the enhanced resolution and higher
accuracy.
The different blocks of the I/Q Software Interface are activated based on the selected
configuration. The effect of these functional blocks to the I/Q signal is discussed in the
associated figures (see Figure 4, Figure 7) in the specific sub-sections.
S(f+fC)
N(f)
-fs/2
-fB
0
fB
fs/2
Figure 2 SNR enhancement based on bandwidth reduction
After the I/Q data is processed and stored in the acquisition memory, it is available for
remote download. To keep the computational and transmission overhead small, the
recommended data format for the transmitted I/Q data is a binary floating point
number.
2.1 I/Q Modulated RF Signals
The most intuitive way to connect an I/Q modulated RF signal to a RTO is depicted in
Figure 3. It occupies just a single channel. Using the example of Figure 1 the RTO in
this case is connected to the measurement points A or B. The RTO acquires the RF
signal, performs the A/D conversion followed by a hardware based down-conversion.
The resulting complex data is low-pass filtered, and resampled to the selected sample
rate.
At max four channels can be acquired in parallel depending on the number of
channels, which the oscilloscope provides. Figure 3 shows a block diagram and the
configurable parameters associated with the block diagram. Table 1 at the end of this
section clarifies parameters, which are specific for this mode (carrier frequency,
1TD01_0e
Rohde & Schwarz - RTO-K11 - 7
I/Q Software Interface Functionality
sideband option, input type). Table 4, in chapter 2.4, discusses common settings
(relative bandwidth, sample rate, record length).
Figure 3 RF signals
The associated effect on the signal in the frequency domain is shown in Figure 4 for
either sideband option. The I/Q modulated RF signal exhibits a band-limited spectrum
around the origin shown in black, solid lines. Due to the down-conversion, which is a
multiplication with e±j2πfct, the spectrum is shifted. The direction of the shift depends on
the algebraic sign in the exponent, and is controlled by the sideband option. The
resulting spectrum is shown in solid, red lines. The low-pass filter is denoted with a
dashed black line, and will remove the shifted undesired part of the spectrum at ±2fc.
DownConv.
-2fC
0
-fC
normal
DownConv.
fC
-fC
0
fC
2fC
inverse
Figure 4 RF signals – sideband options
1TD01_0e
Rohde & Schwarz - RTO-K11 - 8
I/Q Software Interface Functionality
Parameter
Min
Max
Incr
SCPI command
Carrier frequency [Hz]
0.1k
5.0G
0.1k
IQ:CFRequency <IQCarrierFreq>
Sideband
Normal / Inverse
IQ:SBRF <IQSidebandRF>
Input type
Real
IQ:INPType <IQInputType>
SCPI commands are prefixed by the channel
CHANnel<m>:
Table 1 specific configuration options for RF signals
The maximum, configurable carrier frequency of 5 GHz in Table 1 denotes the
mathematical limit of the down-conversion.
2.2 Complex I/Q Modulated Signals in low-IF Range
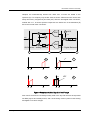
Referring back to the example of a conventional I/Q receiver in Figure 1, the RTO also
supports the measurement of complex I/Q modulated signals in the low-IF range. The
RTO can tap such a signal at the measurement point C in Figure 1, if it needs to be
analyzed to test the correctness of the design. The RTO acquires the signals (I & Q) at
this measurement point and down-converts them. The entire measurement setup is
shown in Figure 5, where on the left-hand side the example I/Q receiver implements
the analog front end up to the point C, marked with a red dashed line. The RTO
connects from this point on the right-hand side, implementing the digital back end for
test purpose.
A concept using a low intermediate frequency fIF is commonly the choice, if the design
of a I/Q receiver is sensitive to DC offset and 1/f noise of elements in the signal path.
E.g. A/D converters tend to have a DC offset, causing signal problems and SNR
degradations. Therefore the I/Q receiver in the example does not down-convert the
signal into the baseband, rather it converts the I/Q modulated RF signal down to a nonzero low intermediate frequency fIF in a first step. In a second step, the digital back-end
of the low-IF-receiver will digitize the signal, shift it from the IF frequency to baseband.
In a last step it simply filters out the undesired spectral components. In the application
example (see Figure 5), the RTO, which taps the I/Q signal at measurement point C,
does the same as the digital back-end of the example receiver.
The effect on the signal in the frequency domain is shown in Figure 5 with the
measurement points B, C, D, E. The original I/Q modulated RF signal (B), is downconverted by the analog front end of the I/Q receiver (C), marked with “1 st”. The
resulting intermediate frequency fIF is typically only a few MHz. Once this signal is
1TD01_0e
Rohde & Schwarz - RTO-K11 - 9
I/Q Software Interface Functionality
sampled, the unintentionally inserted DC offset and 1/f noise are added to the
spectrum (D). For simplicity only the DC offset is shown. Offset and noise can be then
easily removed by a digital low pass filter (LPF) after the final digital down-conversion,
marked with “2nd”, as these spectral components are shifted out of the baseband (E)
due to the second down-conversion.
NCO
ADC
I
e-j2πfIFt
fc-fIF
x(t)
I
Q
90°
ADC
Q
I/Q Receiver – analog frontend
B
RTO - Digital Backend
C
D
B
0 fIF
fC
C
1st
0 fIF
fC
D
0 fIF
E
2nd
fC
LPF
0 fIF
E
fC
Figure 5 Complex modulated signals in low-IF range
Such low-IF-receivers are nowadays widely used in the tiny FM receivers incorporated
into MP3 players and mobile phones; and it is becoming common place in both analog
and digital TV receiver designs.
1TD01_0e
Rohde & Schwarz - RTO-K11 - 10
I/Q Software Interface Functionality
Figure 6 complex modulated signals in low-IF range
The digital backend of a low-IF-receiver can be emulated by the RTO by connecting
the separate I and Q signals to channels 1 & 2 or 3 & 4 as shown in Figure 6. The RTO
acquires the IF signal, performs the A/D conversion followed by a hardware based
down-conversion from the IF band into the baseband. The resulting complex data is
low-pass filtered, and resampled to the selected sample rate.
Table 2 at the end of this section describes parameters, which are specific for this
mode (carrier frequency, sideband option, input type, input mode). Table 4, in chapter
2.4, discusses common settings (relative bandwidth, sample rate, record length).
The associated effect on the signal in the frequency domain is shown in Figure 7 for all
sideband options. The IF signal exhibits a band-limited spectrum around the carrier
frequency fc shown in black, solid lines. From the RTO point of view this is the carrier
frequency fc, though from the system point of view, it is the IF frequency fIF. In the
following discussion only the term carrier frequency fc will be used, instead of the term
IF frequency fIF. Four sideband options are possible. First, the down-conversion shifts
the spectrum by a numerical multiplication with e±j2πfct. The direction of the shift
depends on the algebraic sign in the exponent, and is controlled by the upper/lower
sideband option. Furthermore, the spectrum in the baseband is required to be in
normal position. Depending on the position, the spectrum must be mirrored after the
down-conversion. The mirroring is achieved by the conjugate complex operation, which
1TD01_0e
Rohde & Schwarz - RTO-K11 - 11
I/Q Software Interface Functionality
is controlled by the normal/inverse sideband option. The resulting spectrum is shown in
solid, red lines. A dashed black line denotes the low-pass filter, which will remove any
undesired part of the original spectrum.
Downconversion
0
Downconversion
fC
lower sideband in inverse position
Downconversion
0
0
-fC
upper sideband in normal position
Downconversion
fC
-fC
upper sideband in inverse position
0
lower sideband in normal position
Figure 7 complex modulated signals in low-IF range – sideband options
In this setup, either one I/Q signal can be acquired with a 2 channel RTO, or two I/Q
signals with a 4 channel RTO.
Parameter
Min
Max
Incr
SCPI command
Carrier frequency
0.1k
5.0G
0.1k
IQ:CFRequency <IQCarrierFreq>
[Hz]
Sideband
Upper sideband in normal position
IQ:SBIF <IQSidebandIF>
Lower sideband in normal position
Upper sideband in inverse position
Lower sideband in inverse position
Input type
Input mode
Complex
IQ:INPType <IQInputType>
IF
IQ:INPMode <IQInputMode>
SCPI commands are prefixed by the channel
CHANnel<m>:
Table 2 specific configuration options for complex modulated signals in low-IF range
1TD01_0e
Rohde & Schwarz - RTO-K11 - 12
I/Q Software Interface Functionality
2.3 Complex I/Q Baseband Signals
The complex I/Q baseband signal setup is the last out of three use cases as lined out
in Figure 8. Using the receiver example in Figure 1 the RTO acquires signals at
measurement point C that are already available as I/Q baseband signals. In this case,
the carrier frequency fc of the I/Q modulated RF signal matches the frequency of the
local oscillator. As a consequence a down-conversion is not necessary. Just a lowpass filtering and a resampling to the selected sample rate is applied.
Table 3 explains parameters, which are specific for this mode (input type, input mode).
Table 4, in chapter 2.4, discusses common settings (relative bandwidth, sample rate,
record length).
Parameter
Value
Input mode
Baseband
IQ:INPMode <IQInputMode>
Input type
Complex
IQ:INPType <IQInputType>
SCPI commands are prefixed by the channel
SCPI command
CHANnel<m>:
Table 3 specific configuration options for complex I/Q modulated baseband signals
In this setup, similar as in chapter 0, either one I/Q signal can be acquired with a 2
channel RTO, or two I/Q signals with a 4 channel RTO. This mode has no effect on the
signal in the frequency domain.
Figure 8 complex I/Q baseband signals
1TD01_0e
Rohde & Schwarz - RTO-K11 - 13
I/Q Software Interface Functionality
2.4 Common Parameters
A few parameters are common in the acquisition path of I/Q data for all use cases (I/Q
Modulated RF Signals, The maximum, configurable carrier frequency of 5 GHz in
Table 1 denotes the mathematical limit of the down-conversion.
Complex I/Q Modulated Signals in low-IF Range, Complex I/Q Baseband Signals);
these are explained in this section. All the common parameters are summarized in
Table 4. These parameters are the record length, the sample rate and the filter
bandwidth, which is specified relative to the sample rate. In this section, the sample
rate is the rate at which the data samples are stored in the acquisition memory. Figure
9 gives a detailed view of the menu, where to configure these parameters.
Figure 9 Common Parameters for I/Q signals
As discussed in previous chapters, the low-pass filter ensures the suppression of any
undesired spectral components to comply with the Nyquist theorem [7] and it improves
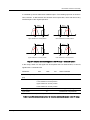
the SNR of the I/Q signal. The relationship between sample rate (fS) and filter
bandwidth (fB) is visualized in Figure 10. Within the filter bandwidth the filter has a flat
frequency response (no 3 dB bandwidth).
Parameter
Min
I/Q mode activation
Max
Incr
IQ:STATe <IQMode>
ON
Sample rate [Sa/s]
1.0k
10.0G
1
relative bandwidth
0.04
0.80
0.01
Record length [Sa]
1.0k
10M/6M
1
acquisition time
SCPI command
= ‘record length’ / ‘sample rate’
IQ:SRATe <SampleRate>
IQ:RBWidth <RelBandwidth>
IQ:RLENgth <RecLength>
--
Table 4 specific configuration options for RF signals
1TD01_0e
Rohde & Schwarz - RTO-K11 - 14
Analysis of RTO I/Q Data with MATLAB®
After resampling, the data is written into the acquisition memory. The record length
defines the number of contiguous samples. The maximum record length is
10 MSamples in case of one or two active channels and 6 MSamples in case of three
or four active channels. The record length divided by sample rate implicitly gives the
acquisition time.
S(f)
-fs/2
-fB/2
0
fB/2
fs/2
fB
‘filter bandwidth fB’ = ‘rel. bandwidth’ * ‘sample rate’
Figure 10 relation of filter bandwidth and sample rate
For more detailed information about the I/Q Software Interface functionality, please
refer to the user manual [8].
3 Analysis of RTO I/Q Data with MATLAB®
The MATLABaccess to the RTO is explained in five parts; the first one explains the
measurement setup. The second one explicates the configuration of the RTO for
remote access; the third part is the specific configuration of the I/Q Software Interface,
which has been described in detail in the previous chapter “I/Q Software Interface
Functionality”. The fourth one is the retrieval of sampled I/Q data from the RTO down
to the host PC. Finally the last part demonstrates a simple analysis of the retrieved I/Q
data.
Rohde & Schwarz supplies a wide set of information to support the automated
measurement with MATLAB. A detailed reference to individual SCPI commands can
be found in the RTO user manual [8] chapter 17.2.16. A specific instruction, how to
access the RTO remotely can be found in an application note [9], and a complete
MATLAB sample script to configure and retrieve I/Q data as discussed in this
application note can be found as a separate file on the web.
1TD01_0e
Rohde & Schwarz - RTO-K11 - 15
Analysis of RTO I/Q Data with MATLAB®
3.1 Measurement Setup
The simplest way to analyze I/Q data is either plotting the baseband I and Q signals in
an XY-diagram (see Figure 13, top trace) or the I/Q modulated RF signal over time
(see Figure 13, yellow trace in the middle). Nevertheless, the result has limited
meaning. In order to demonstrate a meaningful measurement, the recovery of the
constellation diagram from an I/Q modulated RF signal, for example, would be a
relevant statement about the capabilities of the RTO I/Q Software Interface.
A R&S®SMBV100A signal generator [10] generated the I/Q modulated RF signal for the
analysis under discussion. The signal generator was connected to the RTO, providing
a signal with a carrier frequency of 400 MHz and a magnitude of -10 dBm. The data
subjected to I/Q modulation was a PRBS-9 signal with a symbol rate of 500 ksym/s 16QAM [1] modulated, with a configured cosine window of 500 kHz (Figure 12) and a rolloff factor of 0.75.
The RF clock of the signal was referenced to the internal oscilloscope clock
(REF_CLK, Figure 11), in order to simplify the MATLAB post processing. This requires
the RTO to have the RTO-B4 option installed. The reference to the RTO clock avoids a
non-trivial code sequence in MATLAB, which would be required to estimate the RF
frequency and the symbol rate of the I/Q data. Though this kind of setup does not
match a real world application like DVB-T or WCDMA, it explains in great detail the
ability of the I/Q Software Interface in MATLAB.
Processing real world I/Q signals is far beyond the scope of this application note. The
MATLAB communication toolbox offers complete communication models e.g. DVB-T
[11]. Those can be adapted to the I/Q Software Interface.
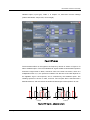
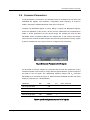
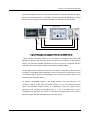
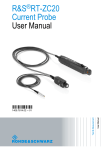
The measurement arrangement is shown in Figure 11. The RTO was connected to the
SMBV on channel 1 with the RF output and on channel 3 & 4 with the baseband I/Q
signal. In the rear, the reference clock output of the RTO was connected to the
reference input of the SMBV100A.
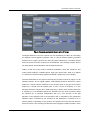
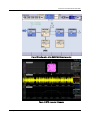
Before the signal was processed with MATLAB, a brief check with the RTO was done
(Figure 13). The I/Q baseband signal was displayed as XY-diagram (pink) and the 16QAM constellation diagram is recognizable at the top of the display. The middle trace
in yellow shows the time domain representation of the RF signal.
1TD01_0e
Rohde & Schwarz - RTO-K11 - 16
Analysis of RTO I/Q Data with MATLAB®
The bottom diagram shows the Fast-Fourier-Transform of the time domain RF signal.
Clearly the center frequency of 400 MHz and the approximate bandwidth of about
500 kHz can be observed. The signal bandwidth is widened by the roll-off factor.
REF_CLK
RF
I
Q
Figure 11 Measurement setup with RTO (l) and SMBV100A (r)
A brief example calculation based on the described I/Q modulated RF signal shall
highlight the ability of the RTO-K11 option to acquire long sequences. In the following
section, the maximal possible acquisition time for the signal is compared with the
acquisition of the same signal using the I/Q Software Interface option.
For the signal analysis without the RTO-K11, the RTO is setup with a sample rate of
2.5 GSa/s, as the signal shows significant 2nd and 3rd harmonics in the spectrum. Using
the maximal sample memory of 20 MSamples, the maximum acquisition time is 8 ms
without any I/Q signal processing.
To achieve comparable results in the signal analysis using the RTO-K11, the
acquisition settings of the RTO are kept the same. For the I/Q Software Interface
option, the maximum sample memory is 10 MSamples. Using the symbol rate of
500 ksym/s and a typical oversampling factor of 4, the
I/Q sample rate is set to
2 MSamples/s in the RTO. This results in a maximum acquisition time of 5 s, which is
625 times longer than the acquisition time of the raw signal.
1TD01_0e
Rohde & Schwarz - RTO-K11 - 17
Analysis of RTO I/Q Data with MATLAB®
Figure 12 Configuration of the SMBV100A Signal generator
Figure 13 RTO measured I/Q signals
1TD01_0e
Rohde & Schwarz - RTO-K11 - 18
Analysis of RTO I/Q Data with MATLAB®
3.2 RTO Basic Configuration
The MATLABcode snippet in this section demonstrates the remote configuration for
the acquisition of I/Q data. In order to communicate with the instrument, the VISA
object must be connected to the instrument using an IP address, based on the name
resolution (line 011 & 013 ). A number of MATLAB® commands perform the basic
setup, which consists of: turn on the display (line 019 ), preset the RTO (line 022 ), set
the channel to 50Ω and DC coupling (line 025 ), and set the autolevelling (line 028 ).
To be able to retrieve the I/Q data using the constructed MATLABobject (line 013 ), it
is necessary to increase the allocated memory. The default buffer size in MATLAB is
512B, which is too small in this application for a single step download of data. The
required buffer size in bytes can be calculated by multiplying ‘# of samples’ * 2 (for I &
Q) * 4 (IEEE 754 4 byte float value). With the maximum record length of 10 MSamples
per channel of the RTO with the software I/Q option, 50MB covers the data transfer
under most circumstances for the visa input buffer in MATLAB to access the R&S®
RTO (line 015 ).
001
002
003
004
005
006
007
008
009
010
011
012
013
014
015
016
017
018
019
020
021
022
023
024
025
026
027
028
029
1TD01_0e
% carrier frequency 400MHz
nCarrierFrequency = 400e6;
% oversampling with a factor of 80 given a symbol rate of 500ksym/s
nSampleRate = 40000000;
% number of samples
nNofSamples = 800000;
% channel connected to the IQ signal source
nChannelNo = 1;
% name of the RTO to access remotely via network
sRTO_hostname = 'RTO-200300';
sIPAddress = resolvehost(sRTO_hostname, 'address');
% Create a VISA connection to the specified IP address
RTO = visa('ni', ['TCPIP::' sIPAddress ]);
% increase the buffer size to, e.g., transport IQ data
RTO.InputBufferSize = 80e6;
% Open the instrument connection
fopen(RTO);
%Activate View-Mode in Remote Mode
fprintf(RTO,'SYST:DISP:UPD ON');
%% ----- Configure the RTO ----% Preset the RTO and wait till action is finished
fprintf(RTO,'*RST; *OPC?');
[~] = fscanf(RTO);
% Set Coupling to 50 Ohm
fprintf(RTO, ['CHAN' int2str(nChannelNo) ':COUP DC']);
% Perform Autoleveling,
%this might take some time so synchonization by fscanf() is appropriate
fprintf(RTO, ' AUToscale; *OPC?');
[~] = fscanf(RTO);
Rohde & Schwarz - RTO-K11 - 19
Analysis of RTO I/Q Data with MATLAB®
3.3 RTO I/Q Software Interface – Configuration
Now the RTO can be configured for the specific I/Q mode, which is in this case an
acquisition of a RF signal, according to chapter 2. The subsequent settings (line 030 052 ) follow the described settings in chapter 2.1 and 2.4.
030
031
032
033
034
035
036
037
038
039
040
041
042
043
044
045
046
047
048
049
050
051
052
%% ----- RTO-K11 I/Q Software Interface SETUP ----sInputType = ‘REAL’;
sInputMode = ‘RFIF’;
sSideband = 'NORMal';
nRelBW = 0.6;
% Activate IQ Mode
fprintf(RTO,'IQ:STATe ON');
% Single Sweep Mode
fprintf(RTO,'STOP');
%Set the input signal, input mode and sideband
fprintf(RTO, ['CHAN' int2str(nChannelNo) ':IQ:INPType ' sInputType]);
fprintf(RTO, ['CHAN' int2str(nChannelNo) ':IQ:INPMode ' sInputMode]);
% Use Normal Sideband
fprintf(RTO, ['CHAN' int2str(nChannelNo) ':IQ:SBRF ’ sSideband]);
% Carrier Frequency or Center Frequency
fprintf(RTO, ['CHAN' int2str(nChannelNo) ':IQ:CFRequency ' …
num2str(nCarrierFrequency)]);
% Set the correct sampling rate
fprintf(RTO, ['IQ:SRATe ' num2str(nSampleRate)]);
% Set the relative Bandwidth
fprintf(RTO, ['IQ:BWIDth ' num2str(nRelBW)]);
% Record Length to be used
fprintf(RTO, ['IQ:RLEN ' num2str(nNofSamples)]);
3.4 Retrieval of I/Q Data
Once the remote access and the I/Q acquisition is configured, the RTO is ready for the
acquisition of I/Q data. In the given snippet in this section the MATLAB® script
configures the RTO to use floating point values in binary format (line 054 ). This is an
efficient way to download the data to a host, saving bandwidth during the transmission
and CPU load on the RTO. A single acquisition is started (line 061 ) and after a
successful trigger the I/Q data is available for download.
Once the acquisition is completed (line 062 ), getting the data from the RTO is straight
forward. A single command (see Table 5 in this section for more details) instructs the
RTO to provide the data of the specified channel (line 069 ) and subsequent read
commands (line 071 & 074 & 077 & 081 ) fetch the I/Q data. The transmission format
is configured as ‘REAL,32’. An ACSII based representation of floating point number is
also possible, but this format introduces more load for the CPU of the RTO and the
CPU of the host. The MATLAB® function (textscan) would convert the entire
1TD01_0e
Rohde & Schwarz - RTO-K11 - 20
Analysis of RTO I/Q Data with MATLAB®
download from a string to an array of numbers. This step can be omitted, when using
binary floating point numbers.
The retrieved I/Q data is represented as one-dimensional array of data with interleaved
real (I) and imaginary (Q) values. This was implemented to reduce the transmission
overhead. The desired format is a two dimensional array of data, one column holding
real and the other holding the associated imaginary values. An explicit rearranging of
the data into a two dimensional array is not necessary in MATLAB® as the language
provides flexible expressions to access the I/Q data in the desired manner (line 082 ).
Parameter
SCPI command
Retrieve I/Q mode data set
IQ:DATA[:VALues]?
Retrieve specified samples of recorded I/Q data.
IQ:DATA:MEMory?
<OffsetSamples>, <NoOfSamples>
Retrieve header of I/Q data
IQ:DATA:HEADer?
SCPI commands are prefixed by the channel
CHANnel<m>:
Table 5 SCPI commands for download
053
054
055
056
057
058
059
060
061
062
063
064
065
066
067
068
069
070
071
072
073
074
075
076
077
078
079
080
081
082
1TD01_0e
%% format of the transmission [ASC/UINT/REAL]
sDataFormat = 'REAL,32';
sDataFormat = sprintf('FORM %s', sDataFormat);
sBinaryFormatString = 'float';
nSizeType = 4;
fprintf(RTO, sDataFormat);
%% ----- Perform Single Sweep ----% Perform a Sweep, and sync via ‘*OPC?’ with the following read
fprintf(RTO, 'RUNSingle; *OPC?');
[~] = fscanf(RTO);
%% ----- Query the IQ Data ----% data comes in #NLLLLFFFFffff …
% with N length indicator
%
LLLL number of samples
%
FFFF/ffff 4 byte value according to IEEE 754
% Capture the IQ Data from the corresponding channel
fprintf(RTO, ['CHAN' int2str(nChannelNo) ':IQ:DATA:VALues?']);
% check the return beginning with a hash '#'
sStartIndicator = fread(RTO,1,'char');
if sStartIndicator ~= '#' fprintf('ooops!\n'); end;
% check the length of the length field in units
nLengthOfLengthfield = fread(RTO,1,'char');
nLengthOfLengthfield = str2double(char(nLengthOfLengthfield));
% check the length of the data record
nBlockLength = fread(RTO, nLengthOfLengthfield ,'char');
nBlockLength = str2double(char(nBlockLength)) / nSizeType;
% to make this work, the endianess endian must be considered!
% the RTO supports litte endian byte order
u = fread(RTO, nBlockLength, ‘float’);
u = u(1:2:end) + 1i*u(2:2:end);
Rohde & Schwarz - RTO-K11 - 21
Analysis of RTO I/Q Data with MATLAB®
3.5 Analysis of I/Q Data
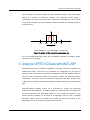
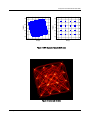
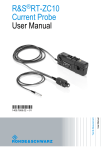
The following snipplet demonstrates the analysis of data. The retrieved data is
normalized to a mean power of one (line 085 - 086 ) and simply plotted in a XYdiagram (line 087 ). Due to the oversampling, the result is not exactly a constellation
diagram, and transitions from state to state are visible. Additionally due to the
uncompensated null phase of the generator, the anticipated constellation diagram is
displayed as skewed (see Figure 14 left side).
083
084
085
086
087
088
089
090
091
092
093
094
095
%% ----- Plot I/Q data ----% normalize to mean power of 1
nMeanMagnitude = sqrt(mean(real(u).^2 + imag(u).^2));
u = u / nMeanMagnitude;
plot(u);
% second plot
nOverSampling = nSampleRate / 500000; % symbol rate -- 500 ksym/s
nSync = 60; % visually determined
meanPhase = mean(angle(u(nSync:nOverSampling:end)));
for phase=1:nOverSampling;
plot((u((1+phase):nOverSampling:end)*exp(-1i*meanPhase)), '.');
pause(0.5);
end
Two things need to be done to recover the PRBS-9, 16-QAM modulated, from the
acquired data. First, the optimal sampling phase needs to be detected, and second the
constellation diagram for a 16-QAM deskewed. To perform this automatically a digital
PLL would be required, which is not anymore in the focus for this application note, so a
simple manual correction is done.
To find the optimal phase for a correct sampling point of the symbols, the I/Q signal is
over-sampled by a factor of 80 and plotted in all possible phases in a loop (line 092 095 ). The phase with the least sample deviation from the symbol grid is chosen as the
optimal one. The optimal phase of the oversampled I/Q data was found to be #60.
This sampling phase is used to estimate the null phase of the generator based on the
assumption that, for uniformly distributed data like a PRBS sequence, the mean phase
is zero (line 091 ). To remove the skew, the data is multiplied with the negative,
complex phase estimate (e-jφ, line 093 ). For the phase #60, it displays a nice,
recovered constellation diagram of 16-QAM modulated data (Figure 14 right side).
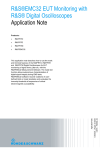
Another way of presentation is colorization of the complex I/Q data diagram (see
Figure 15), not covered in the example code. Using a temperature color grading, the
frequency of occurrence of the I/Q data reveals the constellation map.
1TD01_0e
Rohde & Schwarz - RTO-K11 - 22
1.5
1.5
1
1
0.5
0.5
Imag(u)
Imag(u)
Analysis of RTO I/Q Data with MATLAB®
0
0
-0.5
-0.5
-1
-1
-1.5
-1.5
-1.5
-1
-0.5
0
0.5
1
1.5
-1.5
-1
-0.5
0
0.5
1
1.5
Real(u)
Real(u)
Figure 14 XY-diagram of acquired I/Q data
Figure 15 colorized I/Q data
1TD01_0e
Rohde & Schwarz - RTO-K11 - 23
Conclusion
4 Conclusion
The I/Q Software Interface option (RTO-K11) offers a comprehensive acquisition
toolset for modern I/Q modulated communication protocols, high data rate satellite
links, wideband radar, etc.. These applications implement state of the art modulation
and encoding schemes, which make the I/Q Software Interface option very valuable for
design and test.
Adopting the RTO for the acquisition of I/Q modulated data improves data capture and
accelerates processing compared to a conventional PC based setup. The I/Q Software
Interface option is easy to handle and integrates seamlessly in a common MATLAB ®
framework, which makes it a comfortable interface for analysis tools.
MATLAB is a registered trademark of The MathWorks, Inc.
R&S is a registered trademark of Rohde & Schwarz GmbH & Co. KG.
1TD01_0e
Rohde & Schwarz - RTO-K11 - 24
Literature
5 Literature
[1] J. G. Proakis, Digital Communications, Mcgraw-Hill Higher Education, 2008.
[2] „FS-K101PC/-K103PC/-K105PC EUTRA/LTE Uplink Specifications,“ Rohde &
Schwarz,
June
2012.
[Online].
Available:
http://www.rohde-
schwarz.de/file_18344/FS-K101-103-105PC_FSx-K101-103-105_dat-sw_en.pdf.
[3] „FS-K112PC NFC Measurement Software Specifications,“ Rohde & Schwarz, July
2012.
[Online].
Available:
http://www.rohde-schwarz.de/file_18584/FS_K112-
PC_dat-sw_en.pdf.
[4] „FS-K96 OFDM Vector Signal Analysis Software Specifications,“ Rohde &
Schwarz,
February
2012.
[Online].
Available:
http://www.rohde-
schwarz.de/file_17782/FS-K96_dat-sw_en.pdf.
[5] Schindler, Schulz, „Introduction to MIMO -- Application Note,“ July 2009. [Online].
Available: http://www2.rohde-schwarz.com/file_12364/1MA142_0e.pdf.
[6] Sylvia Reitz, „R&S®RTO oscilloscope with state-of-the-art signal analysis
software,“ NEWS 206, pp. 23-25, July 2012.
[7] Harry Nyquist, „Certain Topics in Telegraph Transmission Theory,“ in Winter
Convention of the A. i. E. E., New York, 1928.
[8] Test & Measurement, RTO Digital Oszilloscope - User Manual, München: Rohde
& Schwarz GmbH & Co. KG, 2012.
[9] Jürgen Engelbrecht, „How to Use Rohde & Schwarz Instruments in MATLAB® -Application Note,“ Rohde & Schwarz GmbH & Co. KG, 16 March 2012. [Online].
Available: http://www2.rohde-schwarz.com/file_13938/1MA171_5e.pdf.
[10] Rohde & Schwarz GmbH & Co. KG, R&S®SMBV100A Vector Signal Generator -Operating Manual, München, 2012.
[11] MathWorks®, „Digital Video Broadcasting - Terrestrial,“ 2012. [Online]. Available:
http://www.mathworks.com/help/comm/examples/digital-video-broadcastingterrestrial.html.
1TD01_0e
Rohde & Schwarz - RTO-K11 - 25
Ordering Information
6 Ordering Information
Naming
Digital Oscilloscopes
Type
Order number
600 MHz, 2 channels
10 Gsample/s, 20/40 Msample
R&S RTO1002
1316.1000.02
600 MHz, 4 channels
10 Gsample/s, 20/40 Msample
R&S RTO1004
1316.1000.04
1 GHz, 2 channels
10 Gsample/s, 20/40 Msample
R&S RTO1012
1316.1000.12
1 GHz, 4 channels
10 Gsample/s, 20/80 Msample
R&S RTO1014
1316.1000.14
2 GHz, 2 channels
10 Gsample/s, 20/40 Msample
R&S RTO1022
1316.1000.22
2 GHz, 4 channels
10 Gsample/s, 20/80 Msample
R&S RTO1024
1316.1000.24
4 GHz, 4 channels
20 Gsample/s, 20/80 Msample
R&S RTO1044
1316.1000.44
R&S®RTO-B4
1304.8305.02
R&S RTO-K11
1317.2975.02
Clock option - OCXO 10 MHz
®
®
®
®
®
®
®
Software Options
I/Q Software Interface
®
7 Index
DUT
Device Under Test .......................................... 5
DVB-T
Digital Video Broadcasting – Terrestrial .......... 3
ENOB
Effective Number Of Bits ................................ 5
EVM
Error Vector Magnitude................................... 5
I/Q
In-phase / Quadrature-Procedure ................... 3
NCO
Numerically Controlled Oscillator .................... 6
NFC
Near Field Communication ............................. 3
OFDM
Orthogonal Frequency-Division Multiplexing ... 3
PRBS
Pseudo Random Bit Sequence ..................... 16
1TD01_0e
QAM
Quadrature Amplitude Modulation ................ 16
radar
RAdio Detection And Ranging ........................ 4
RF
Radio Frequency............................................ 4
RTO
Real-Time oscilloscope ....... 3, 7, 11, 13, 15, 26
SCPI
Standard Commands for Programmable
Instruments ................................................. 4
SNR
Signal-to-Noise Ratio ..................................... 6
WCDMA
Wideband Code Division Multiple Access....... 3
XML
eXtended Mark-up Language ......................... 3
Rohde & Schwarz - RTO-K11 - 26
About Rohde & Schwarz
Rohde & Schwarz is an independent
group of companies specializing in
electronics. It is a leading supplier of
solutions in the fields of test and
measurement, broadcasting,
radiomonitoring and radiolocation, as well
as secure communications. Established
more than 75 years ago, Rohde &
Schwarz has a global presence and a
dedicated service network in over 70
countries. Company headquarters are in
Munich, Germany.
Environmental commitment
● Energy-efficient products
● Continuous improvement in
environmental sustainability
● ISO 14001-certified environmental
management system
Regional contact
USA & Canada
USA: 1-888-TEST-RSA (1-888-837-8772)
from outside USA: +1 410 910 7800
[email protected]
East Asia
+65 65 13 04 88
[email protected]
Rest of the World
+49 89 4129 137 74
[email protected]
This application note and the supplied
programs may only be used subject to the
conditions of use set forth in the download
area of the Rohde & Schwarz website.
R&S® is a registered trademark of Rohde
& Schwarz GmbH & Co. KG; Trade names
are trademarks of the owners.
Rohde & Schwarz GmbH & Co. KG
Mühldorfstraße 15 | D - 81671 München
Phone + 49 89 4129 - 0 | Fax + 49 89 4129 – 13777
www.rohde-schwarz.com