1
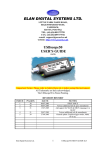
Advanced Signal Analysis
using the History Mode of the
R&S®RTO Oscilloscope
Application Note
Products:
ı
R&S RTO1002
ı
R&S RTO1004
ı
R&S RTO1012
ı
®
ı
R&S® RTO1022
®
ı
R&S® RTO1024
®
ı
R&S®RTO1044
®
R&S RTO1014
Dr. M. Hellwig;Dr. T. Kuhwald
5.2013 - 1TD02_0e
Application Note
Rare faults and intermittent signals are difficult to
capture. The R&S®RTO Oscilloscope supports the
acquisition and the detailed signal analysis of these
signals by using the history mode. The history mode
allows the user to look back to previous acquisitions
and apply the wide set of analysis functions of the
RTO. Furthermore it stores the accurate recoding
time of the waveforms for subsequent analysis.
Table of Contents
Table of Contents
1 Introduction ......................................................................................... 3
2 Digital Oscilloscope Background ...................................................... 5
2.1
Operating Principle ......................................................................................................5
2.2
Memory Requirements ................................................................................................6
2.2.1
Setup Parameters ..........................................................................................................6
2.2.2
Memory Requirement for a Pulse Sequence Example ..................................................7
2.3
Acquisition and Trigger Control.................................................................................7
3 RTO History Mode............................................................................... 9
3.1
Operational Description ..............................................................................................9
3.2
Memory Organization ................................................................................................10
3.3
Determining the Fidelity of Signal Acquisition .......................................................11
3.3.1
Evaluating the Blind Time ............................................................................................11
3.3.2
The Ultra-Segmentation Mode .....................................................................................13
3.4
Limitations of the History Mode ...............................................................................15
4 Application Examples....................................................................... 16
4.1
Configuration Scheme for the Time Base ...............................................................16
4.2
Pulsed Radar Signals ................................................................................................16
4.3
Debug of Intermittent Faults .....................................................................................21
5 Conclusion ........................................................................................ 26
6 Literature ........................................................................................... 27
A
Appendix A .................................................................................................................28
B
Appendix B .................................................................................................................29
7 Ordering Information ........................................................................ 31
1TD02_0e
Rohde & Schwarz - History Mode
2
Introduction
1 Introduction
Digital oscilloscopes are indispensable for testing and debugging of electronic and
system designs, due to their versatility and flexibility. The requirements for state-of-theart oscilloscopes are a higher sample rate for a better resolution of signal details and a
deeper memory for capturing longer signal sequences. A remaining challenge is the
acquisition of rare, random or intermittent events. These events typically appear only
for a short duration and infrequently. In order to acquire such events in sufficient detail,
a high resolution and a long acquisition time is needed. Both requirements, together,
mean a challenge for the size of the sample memory.
To meet this challenge, the RTO provides the history mode to look up previous
waveforms, if the acquisition is stopped, regardless whether manually, by violating
measurements, or by mask limits.
ı
The most important application of the RTO history mode is the test and debugging
of electronic designs. Modern electronic designs are complex and not trivial to test,
because of high signal rates in combination with small signal magnitudes and a
dense design footprint. In particular, rare faults affect digital designs. The effects
caused by these faults in digital circuits are for example damage, outage due to
reboot, or performance degradation.
ı
Another application example for the RTO history mode is the analysis of rare or
random events in the area of nuclear and high-energy physics, pulsed laser, and
pulsed radar applications. Physical events are converted to an electrical signal, but
their presence is not necessarily predictable, but they occur as a series, and it is
important to capture all events with reference to a consistent time base.
Besides the two mentioned examples, which particularly benefit from its functionality,
the history mode can also be useful for many other applications.
Once enabled, the history mode provides complete access to previous acquisitions.
The user can apply the entire suite of RTO analysis functions for each recorded
waveform. The analysis functions include zoom, cursor, search, math, protocol
decoding, mask test and measurement functions.
For repetitive signals with longer idle times in between the RTO is able to capture the
active signals sequences applying high timing resolution in combination with a long
observation time. For this case, the RTO acquires short waveforms with the signal
events and maintains with its precision time base the timing relationship between the
recorded waveforms. With the history mode, the user can analyze these recorded
waveforms, as well as the timing relation among the waveforms in detail.
Additionally, the RTO offers a high waveform acquisition rate of up to 1 Million
acquisitions per second to ensure a high probability of signal fault detection, which in
turn reduces overall measurement time [1]. For signals with an unpredictable
occurrence the high acquisition rate might be insufficient for capturing all signal events.
In this case, the RTO features the "Ultra-Segmentation Mode" with a minimal idle
('dead') time between consecutive acquisitions of 300ns. These two features
significantly raise the confidence in the integrity of the sequences of acquired
waveforms.
1TD02_0e
Rohde & Schwarz - History Mode
3
Introduction
To gain a good understanding of the history mode and to utilize its benefits best, the
next chapter of this application note describes the general internal architecture and
operation of the RTO. The third chapter explains the operation of the history mode, the
organization of the associated memory and the limitations of the history mode. In the
fourth chapter two examples demonstrate, how the history mode is configured for
specific measurement tasks and how the user benefits from this feature.
1TD02_0e
Rohde & Schwarz - History Mode
4
Digital Oscilloscope Background
2 Digital Oscilloscope Background
2.1 Operating Principle
8b@10Gsps
CPU & Display
(HW based processing)
Post-Processing
Acquisition Memory
Digital
Trigger
Acquisition
ADC
analog
frontend
(HW based processing)
Input
Channel
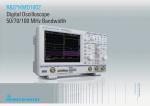
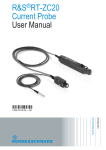
Figure 1 shows the block diagram of the RTO, in which arrows indicate the data-flow
between different processing blocks. The entire data-path from the analog front-end to
the display is divided into two different sections, each one marked with a different color
code.
PCIe
Figure 1 – R&S®RTO Oscilloscope Block Diagram
The first section is the acquisition path including the digital trigger block, marked in
pink. It processes all input data in parallel before the sample data of each channel are
stored in the acquisition memory. The processing steps consist of an analog preconditioning by the analog frontend, the sampling of the input signals with the A/D
converter (ADC), and digital filtering and decimation stage in the acquisition block. At
the end of the acquisition path, the samples are stored in the sample memory. In
parallel to the acquisition processing, the RTO's digital trigger generates an event
based on the digitized input signal. A valid trigger event controls the start of the
acquisition.
The second section is the post-processing path denoted with a light green color. In this
path, the RTO processes the selected analysis operations, like measurement, math,
mask tests, cursor before the final display of the waveform. The acquisition memory is
involved in both, the acquisition and post-processing phase, so it is marked with color
grade from pink to light green.
These two sections work mutually exclusive in phases, in the following called
acquisition phase and post-processing phase. A typical mode of operation is the
continuous acquisition mode. During this mode, the two phases work in an alternating
manner. Figure 2 shows the scheduling of this alternating operation, using the label
'acq' for acquisition phase, and 'pp' for post-processing phase. A trigger event starts
the acquisition. The acquisition phase stops, once the acquisition memory has
1TD02_0e
Rohde & Schwarz - History Mode
5
Digital Oscilloscope Background
accumulated as many samples as specified by the record length. The next phase
begins with the read-out of the recorded waveform from the acquisition memory to the
post-processing section. Only if its processing is completed, the next acquisition phase
can start again.
acq
pp
acq
pp
acq
pp
time
Figure 2 – Phase Scheduling of the RTO for "Continuous Acquisition" Mode
Figure 3 shows the complete RTO operation using the introduced color code. On the
left-hand side, there is the acquisition block, which writes waveforms, indexed by a
negative integer [1-n,0], into the acquisition memory marked by an arrow labeled with a
'W'. Right-hand side there is the post-processing block, reading the acquired
waveforms out of the acquisition memory marked by an arrow labeled with an 'R'.
Acquisition Memory
-4
...
n-1
-3
void
W
Acquisition
-1
0
-2
R
void
Post-Processing
Digital Trigger
Figure 3 – Data Flow of the RTO
2.2 Memory Requirements
2.2.1 Setup Parameters
During the acquisition phase, the sample memory stores the acquired samples. The
configured record length determines, how many samples are stored, and the sample
rate determines how many samples per seconds are acquired. In the "Horizontal"
dialog box of the RTO, both items can be configured (see Figure 4).
The maximum sample rate equals the sample rate of the ADC, which is 10 Gsample/s
for the RTO. The standard size of the waveform memory of the RTO is 20 Msample
per channel. Memory options for the RTO are available to upgrade to a deeper
waveform memory. 50 and 100 Msample per channel are available with the RTO-B101
and the RTO-B102 options.
1TD02_0e
Rohde & Schwarz - History Mode
6
Digital Oscilloscope Background
Figure 4 – Horizontal / Resolution Dialog Box
2.2.2 Memory Requirement for a Pulse Sequence Example
The example below highlights the memory requirements for the pulsed signal (see
Figure 7) as introduced in chapter 1. The number of samples during an observation
period depends on the selected sample rate, the number of pulses to be recorded and
the pulse repetition rate. Equation (2-1) shows the corresponding calculation. Realistic
and reasonable parameters to investigate the required sample memory are listed in
Table 1 in the column marked with “Example”. The required size of the sample memory
would be 2 Gsamples. This exceeds the size of the sample memory for typical real
time oscilloscopes presently on the market. In chapter 3.4 this example will be
reviewed applying the history mode to show its benefits.
SM
RS N P
RP
(2-1)
Table 1
Example
SM
2 GSa
Required sample memory
RS
10 GSa/s
Sample rate / samples per second
NP
20
Number of pulses
RP
100 s
-1
Average pulse repetition rate / pulses per second
2.3 Acquisition and Trigger Control
Analysis of the specific signals as mentioned above requires configuration of the acquisition and the trigger control.
1TD02_0e
Rohde & Schwarz - History Mode
7
Digital Oscilloscope Background
The RTO provides powerful trigger functions, which enables the acquisition to be more
selective. The user has to specify the decisive trigger condition. However this can be
difficult, as conditions to isolate dedicated signal events are not always known. With
the support of the mask and measurement functions, the user has to detail the
expected result and the RTO stops the acquisition in case of a violation of them. Then
the data is available for examination and the user can create a suitable trigger
condition.
An acquisition phase starts with arming of the digital trigger system. The RTO provides
a comprehensive list of trigger types like Edge, Glitch, Width, Runt, Window, Timeout,
Interval, Slew Rate, Data2Clock, State, Pattern, Serial Pattern, near field
communication trigger and TV trigger. If the user chooses the right trigger type and
configures all trigger settings correctly, various incidents in analog, digital, and logic
signals can be detected. In chapter 4.3 an example of a specific trigger type will be
demonstrated.
If the trigger mode is set to "auto mode" and the trigger condition is not met for a
certain period of time an internal trigger event is created to enforce a signal display.
For rare faults and sporadic signals it is important to trigger solely on their occurrence
and choosing the "normal mode" sustains to acquire just the sporadic signals. In this
case, and if the trigger is missing for a certain period of time, a window will pop up to
display the elapsed time since the last trigger event.
1TD02_0e
Rohde & Schwarz - History Mode
8
RTO History Mode
3 RTO History Mode
The RTO's history mode mitigates the inherent contradiction between sample rate and
observation time.
Typically, a digital real-time oscilloscope acquires not just one long waveform. Instead
multiple waveforms, triggered by a dedicated trigger condition are stored in multiple
records in the acquisition memory. The associated memory organization is explained in
detail in chapter 3.2.
3.1 Operational Description
The RTO's history mode enables the user to access previously recorded waveforms
stored in records in the acquisition memory. This history mode can only be used if the
acquisition sequence has been stopped. The user may replay the waveforms from the
last acquisition just for viewing, or he may apply analysis functions out of the RTO
toolset for each record. These analysis functions include measurement, math, mask
test, cursor and display operations.
The post-processed data are displayed either as graphical waveforms or as numerical
values. With respect to the phase scheduling, introduced in Figure 2, the history mode
successively schedules individual post-processing phases, whereas the continuous
acquisition mode alternatingly schedules acquisition phase and post processing phase.
The “History” result dialog box (see Figure 5) contains controls for the access and
display of acquired waveforms. The “History” menu is invoked by pressing the “History”
key on the front panel, or from the menu bar "Display" > "Show history". Once
activated, a continuously running acquisition stops immediately.
The most recent acquired waveform is indexed as zero, which is also the initial
displayed waveform. Older records are indexed backwards in a descending order.
When changing the sequence number manually in the input box labeled with “Current
acq”, the RTO post-processes and displays the waveform with the selected sequence
number accordingly. Instead of displaying waveforms individually, the user can replay
all acquired waveforms, by pressing the “Play” button. In the preference dialog box of
the history, the user can specifically select the range of records, which will be
processed and displayed (see Figure 6). It is possible to set the replay time per
acquisition. Changing this setting to smaller values is useful to reduce the analysis
time, if the RTO has acquired a huge number of waveforms and the user applies these
to an automated mask or measurement function. Regardless of the manual setting of
the replay display of the waveforms, the absolute or relative time of recording is shown
in the history preference dialog box.
1TD02_0e
Rohde & Schwarz - History Mode
9
RTO History Mode
Figure 5 – History Result Dialog Box
Figure 6 – History Setup Dialog Box
An important prerequisite for the history mode is to stop a running acquisition, when
the RTO is in the continuous acquisition mode. There are several ways to stop the
acquisition either manually by pressing the HISTORY, "RUN CONT" or "RUN Nx
SINGLE" key at the front panel or by configuration of a "Stop on Violation" condition in
the mask or measurement function. Chapter 4.3 shows an example of such a
configuration.
3.2 Memory Organization
The acquisition memory and its organization is of great importance for the history
mode-and its segmentation is very useful for storing of the acquisition data. This can
be demonstrated on basis of the application example of a pulsed signal (see chapter 1
and 2.2). In the top row of Figure 7 a pulse train of such a pulsed signal is shown.
Because of its fast rise-time, it requires a high resolution, and a large observation time
due to the pulse distance, which is typically in the µs range. The example of the pulse
train shows five pulses with a similar, but not equal, outline and not equidistant time
spacing. The time axis is discontinuous to indicate an arbitrary, but large time inbetween the pulses, compared to the pulse width.
time
1-n
t1
t1+ts t2
2-n
t2+ts
-1
-2
tn-2
tn-2+ts
tn-1
tn-1+ts
0
tn
tn+ts
time
Figure 7 – Acquisition of a Pulse Train with Single or Multiple Acquisitions
The bottom row of Figure 7 displays the same signal as the top row. In case of a single
acquisition, the RTO would record these pulses with the time interval [t1,tn+ts]. A
stippled frame around the pulses indicates the acquisition time interval in this case.
1TD02_0e
Rohde & Schwarz - History Mode
10
RTO History Mode
In the acquisition path, a delay line retards the signal relative to the trigger event, which
is generated by a digital oscilloscope from the same signal. The digital oscilloscope
trigger starts the acquisition shortly before the beginning of the pulse for a predefined
acquisition time ts. Gray-color-graded frames around the five, displayed pulses indicate
the acquisition time [tk,tk+ts] with k €[1,n]. Here it is assumed that n-times multiples of
the acquisition time ts is much smaller than the observation time, as discussed in
chapter 2.2. As a result, the RTO does not record the vast periods of inactivity. Now it
becomes obvious that the total number of waveform samples is reduced. This can
save a lot of memory space and result in a very efficient usage of the acquisition
memory.
For further illustration of this advantage, the numerical example of Table 1 is used with
an assumed pulse width of less than 100 ns. Using an acquisition time ts of 100 ns and
-1
keeping the same parameters (RS = 10 Gsample/s, NP = 20,RP = 100 s ), the total
amount of required memory space turns out to be 20 ksample. In this chosen example,
this results in a significant improvement of a factor of 200.000 (2 Gsample/
20 ksample).
The records are logically arranged as if they were stored in a ring buffer, while
physically mapped to a linear addressable DRAM memory. Figure 8 shows in the top
row the pulsed signal. As already discussed, the individual pulses are sampled for an
acquisition time ts, which, multiplied with the sample rate plus a minor overhead,
determines the corresponding memory requirement of a waveform.
The ring buffer is shown in Figure 8 with the recorded waveforms indexed from 0 to 1-n
with 0 as the most recent recorded waveform and 1-n as the oldest one. The memory
organization associates each waveform with a small block of overhead (OVH) and a
time stamp for the record. In chapter 3.4, the maximal possible number of records,
called history depth, will be discussed. With the addition of a time stamp, the exact
timing relation among the recorded waveforms is maintained. Unused records out of
the previous acquisitions are voided and not accessible. If the memory demand of an
acquisition exceeds the history depth, the most recent record overwrites the oldest one
(1-n).
When the RTO enters the history mode, the actual, displayed waveform is the most
recent acquired one, and the user can select the display sequence for the recorded
waveforms as indicated in the bottom row of Figure 8.
3.3 Determining the Fidelity of Signal Acquisition
This chapter will introduce the observation time with the associated fault detection
probability, and a mode with minimized blind time. Based on the introduction it will
explain why these topics are important for the history mode.
3.3.1 Evaluating the Blind Time
In order to use the history mode effectively, it is important to understand the fidelity of
the acquired data. The concept of the alternating phase of acquisition and postprocessing was already introduced, but the user should be aware that during the postprocessing phase the oscilloscope is not able to acquire data, it is blind. This is a
1TD02_0e
Rohde & Schwarz - History Mode
11
RTO History Mode
general characteristic of a digital oscilloscope, not RTO-specific. In case of interest, an
application note [1] provides more details on the impact of blind time of the
measurement and a derivation for the probability of signal fault detection.
time
1-n
t1
2-n
t1+ts t2
-2
t2+ts
tn-2
-1
tn-2+ts
tn-1
0
tn-1+ts
tn
tn+ts
void
---
void
---
1-n
void
OVH
OVH
-3
OVH
-4
OVH
OVH
logical ring buffer
2-n
OVH
OVH
---
time
-2
-1
1-n
OVH
0
OVH
-1
OVH
-2
OVH
-3
OVH
max
OVH
0x0
OVH
0
2-n
-4
linear memory organisation
0
tn
tn+ts
-1
-2
display
-3
se q u e n
1-n
ce
Figure 8 – Acquisition Memory Organization
The blind time of an oscilloscope consists of fixed and variable portions of time (see
Figure 9). The individual oscilloscope architecture determines the fixed part tfb. The
variable part tvb depends on the time required for post-processing, particularly record
length, the number of active channels, the selected post-processing functions, and the
display rendering of the waveforms.
In Figure 9 the continuous acquisition mode is shown. After the trigger event at time t1
caused by a pulse (1-n), the RTO starts the acquisition for the acquisition time ts. Once
the RTO has finished this acquisition, it requires a fixed time of tfb to continue with the
post-processing phase. During this phase, it works on the acquisition data for a time of
tvb. After a time of t1+ts+tfb+tvb, the RTO is ready to accept the next trigger event and
waits for it.
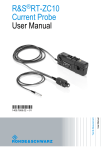
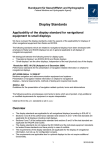
Using the concept of blind and acquisition time the application note analyzes the
probability of detecting a random fault in the acquired signal. In this application note,
Figure 10 displays the probability of signal fault detection over time as a function of the
acquisition rate. The user will notice that a high acquisition rate is imperative for high
confidence in the acquired data. The RTO offers with 1 M waveforms per second a
1TD02_0e
Rohde & Schwarz - History Mode
12
RTO History Mode
high acquisition rate to ensure this high confidence. For the RTO, the user can check
the waveform acquisition rate by enabling the Performance result box (see Figure 11).
To enable this box the user has to select the "Display > Performance" menu entry.
acq.
time
blind time
fixed
variable
wait for trigger
1-n
t1
2-n
t1+ts
t1+ts+tfb
t1+ts+tfb+tvb
t2
t2+ts
time
Figure 9 – Acquisition and Post-Processing Cycle of a Digital Oscilloscope
It is worth mentioning two effects may prevent the RTO from reaching this high
acquisition rate. First, if the record length is high, the associated acquisition time will
reduce the acquisition rate. Second, if the RTO trigger is setup in normal mode, and if
the rate of trigger events is slower than the maximum acquisition rate, this will, of
course, reduce the acquisition rate.
Probability of Signal Fault Detection
1.0
0.8
10 faults/s; 10GSa/s; 1 kSa
0.6
100
10000
50000
100000
250000
1000000
0.4
0.2
0.0
0
10
20
30
40
50
60
Observation Time [s]
70
80
90
100
Figure 10 – Fault Detection Probability
Figure 11 – Performance Result Box
3.3.2 The Ultra-Segmentation Mode
The previous section focused on the importance of the waveform acquisition rate under
the assumption of a randomly distributed fault. This is a valid assumption for some
applications; however, other applications like the pulsed signal will not necessarily
1TD02_0e
Rohde & Schwarz - History Mode
13
RTO History Mode
benefit from a high acquisition rate. For these signals, it is required to capture possibly
all of the pulses not just some. If the RTO is able to trigger on the signal of interest, it is
more important to reduce the blind time to be able to record the next pulse.
Specifically for this case the RTO implements the Ultra-Segmentation mode. With
reference to Figure 9, it appears that the blind time consists of two parts, which are not
in the same range (tfb≈0.3 µs, min tvb≈0.9 µs [2]). The dominant part is the variable
blind time tvb, which the post-processing phase contributes. Scheduling only
consecutively acquisition phases will leave out the variable part of the blind time (see
Figure 9). Consequently, there is no display update of the acquired waveforms in the
Ultra-Segmentation mode. After the sequence of acquisitions is finished, the history
mode function is used to access and display the previously acquired waveforms.
In Figure 12 the Ultra-Segmentation mode shows the advantage of the omitted variable
blind time. After a trigger event at time t1 and acquisition of a pulse (1-n) it samples for
an acquisition time ts, afterwards the RTO needs only a fixed blind time of tfb, before
the next trigger can occur and the RTO acquires the next signal.
fixed (tfb)
fixed (tfb)
1-n
t1
t1+ts
fixed (tfb)
2-n
t2
t2+ts
3-n
t3
4-n
t3+ts
t4
t4+ts
time
Figure 12 – Ultra-Segmentation Cycle of a Digital Oscilloscope
The Ultra-Segmentation is invoked by pressing the "HORIZONTAL" key on the front
panel and selecting the "Ultra Segmentation" tab. This brings up the dialog box, which
allows the user to enable this mode and to specify the number of waveforms to be
acquired (see Figure 13).
Figure 13 – Dialog Box for Ultra-Segmentation
Once the series of acquisitions using the Ultra-Segmentation Mode is complete, the
user has the option to start the history mode including the automatic replay by
selecting the "Show history" button in the dialog box. Another way would be pressing
the "HISTORY" key on the front panel. The user can now apply the functions as
already described in chapter 3.1.
1TD02_0e
Rohde & Schwarz - History Mode
14
RTO History Mode
3.4 Limitations of the History Mode
Some limitations apply to the use of history mode. First, the read access to the
acquisition memory is only possible if the acquisition is stopped as aforementioned.
Starting a new acquisition will void the acquired waveform data. This happens if the
user presses the RUN key on the front panel or sends a similar remote command.
Second, adding an input channel or changing the time scale will void the data in the
acquisition memory, even if the acquisition is stopped.
There are also two separate acquisition modes in which the history mode is not
available, the “equivalent time” sampling mode and the roll-mode. Due to the specific
use of the waveform memory in these modes, the captured data is not accessible by
the history mode.
For the acquisition memory, there is a limitation on the maximum number of acquired
waveform records, which can be stored. This limit is called history depth. The user can
approximately calculate it as follows:
H
SM
1
RL 1000
(3-1)
Table 2
H
History depth per channel
SM
available sample memory per channel (20 / 50 / 100 Msample1)
RL
Record Length, typically 5 ksample
Depending on configured decimation mode, waveform arithmetic modes or active math
signals, the history depth might be smaller. If an input channel is unused, the active
channel allocates the sample memory of the inactive channel. For example, a four
channel RTO with 20 Msample per channel, will have 80 Msample of sample memory
available for one channel if the other channels are inactive.
1
1TD02_0e
RTO-B101 option supports 50 Msample per channel, RTO-B102 100 Msample per channel
Rohde & Schwarz - History Mode
15
Application Examples
4 Application Examples
Prior to the introduction of the application examples, it is worthwhile to review the
configuration of the RTO and consider a strategy to maximize the benefits of the
history mode.
4.1 Configuration Scheme for the Time Base
The most important constraint is the choice of a suitable sampling rate, which is
compliant with the Nyquist-Shannon sampling theorem [3]. Generally, the sample rate
should be more than twice the highest frequency component in the signal spectrum.
For pulsed RF signals, the user should take harmonics of the carrier frequency and the
modulation bandwidth into account.
After the sample rate is determined, the user should decide on acquisition time or
record length. All three numbers can be configured in the HORIZONTAL dialog box
(see Figure 4), but they are related, because sample rate multiplied by acquisition time
yields the record length. For the pulsed signal, the maximum pulse length constrains
the minimum acquisition time.
For a digital signal, the required acquisition time might be not as easy to determine as
in the case of a pulsed signal. A good choice strongly depends on the content of the
signal. The symbol length might be a good choice, for example for a UART protocol, it
would be 10 bits, which comprise a data byte plus stop bits.
The last item to consider is the observation time. Pulsed signals require the user to
think about the number of pulses to record. In any case, the user should investigate,
whether his memory requirement exceeds the available history depth of the RTO in
use, based on the calculation given in chapter 3.4.
4.2 Pulsed Radar Signals
After this theoretical preparation, a detailed investigation of a pulsed radar signal is
presented .This example demonstrates several RTO features, including the analysis in
the frequency domain across several recorded waveforms and the associated mask
testing, as well as measurements in the time domain. Additionally it will show case the
superior, short blind time of the RTO, in particular, when the RTO is in UltraSegmentation mode. This ensures that all required data is captured, so that the user
has a high confidence in the acquisition. Again it should be emphasized that UltraSegmentation and history mode are two different things, but the waveforms captured
during Ultra-Segmentation mode can only be accessed by using the history mode.
To maintain the focus on RTO-specific features, this application note makes some
assumptions to simplify the setup. Instead of measuring real world signals and in order
to ensure flexibility, a vector signal generator SMBV100A [2] from Rohde & Schwarz
generates the signal, and allows an easy generation of a complex pulse train. Channel
1 of the RTO connects directly to the output of the vector signal generator with a 50 Ω
termination. The nominal carrier frequency of the signals is selected to be at 400 MHz,
1TD02_0e
Rohde & Schwarz - History Mode
16
Application Examples
which is not a typical radar band, but a real-world radar signal is usually subjected to a
RF-down-conversion into a comparable IF band. The RTO can directly capture and
measure the 400 MHz signal.
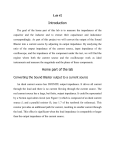
The radar signal consists of a sequence of three different pulse types with 21 pulses in
total. Figure 15 shows these captured pulses, grouped in one acquisition and
frequently referred as a pulse train. This pulse train repeats every 100 ms and is
closely related to a real world example. The chirp pulse parameters are explained in
Figure 14. The first pulse type, marked with 'Type 1', occurs only once, and it is
characterized by a (Δf) 2 MHz ramp-down LFM chirp with a 8 µs pulse width. It has
also an offset of 2 MHz to the nominal carrier frequency. With the given horizontal
scale of 500 µs/div it is hardly visible, because of low amplitude and close spacing to
the adjacent pulse. The following pulses are from a second pulse type, marked with
'Type 2', with a 3.5 MHz ramp-up LFM chirp at the nominal carrier frequency and a
5 µs pulse width, repeated ten times with a pulse repetition of 80 µs. Finally, ten pulses
of a third pulse type are recorded, which have a pulse repetition of 800 µs, marked with
'Type 3'. These pulses show also a 3.5 MHz ramp-down LFM chirp at the nominal
carrier frequency but a 13 µs pulse width. All three types have different amplitude
levels.
pulse width
Δf
pulse repetition
0
time
Time
Figure 14 – Chirp Parameter
Based on the signal parameters as described above, the time base is set to a
resolution of 400 ps to meet the Nyquist criteria taking all the harmonics of the carrier
into account. With a record length of 12.5 Msample and a continuous acquisition, 5 ms
are stored per waveform, so that the RTO displays a complete pulse train. The
acquisition rate is low, because this pulse train occurs only ten times per second due to
the 100 ms interval.
A comprehensive analysis will cover multiple pulse trains, as it is insufficient to analyze
just a single one. Therefore the total observation time is expanded to 3 s in a next step.
With 100 ms repetition rate and a required resolution of 400 ps, it is clear that the
history mode is required for this analysis. In order to maximize the detection capability,
meaning minimized blind time, the Ultra-Segmentation is enabled. With the apriori
knowledge of the pulse train this seems not logical, but recoding unknown pulse trains
with unknown pulse repetition times, this is an important feature. The time base is kept
to 400 ps resolution with 50 ksample record length, which results in a 20 µs acquisition
time for 600 pulse trains. Without the use of the history mode, the memory requirement
would definitely exceed the available sample memory.
For the validation of the setup, it is important to ensure that all signal details are
captured. Therefore, the initial part of the RTO investigation is the analysis of the time
®
stamps. A MATLAB scripts in this application note (see p. 28) retrieves the relative
time stamps of the individual, captured waveforms. A further analysis of the
1TD02_0e
Rohde & Schwarz - History Mode
17
Application Examples
timestamps (for details see Appendix B p. 29) retrieved with the MATLAB
shows, that all pulses are properly captured.
®
script
Type 3
Type 2
Type 1
Figure 15 – Pulse Train
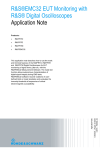
In Figure 16 the timestamps of 21 recorded pulses are displayed in a 5 ms interval with
the described spacing followed by a 95 ms period of inactivity, which isn't shown for
better visibility. Secondly, the time difference between the first and the second pulse,
20.29846 µs, is rather small. Since the acquisition time (ts) is 20 µs, the time difference
between acquisition number -34 and -33 reduced by the acquisition time is just 298 ns
(see p. 29), which equals the minimized blind time (tfb). Capturing pulses so close
together in separate acquisitions is very challenging for a digital oscilloscope!
0
-0.101
-0.1
-0.099
-0.098
-0.097
Time [s]
Figure 16 – Recorded Timestamps
The second step is the verification of the individual pulses. To analyze the parameter
of interest the user may enable the measurement function for burst-length and
amplitude; furthermore, the user can easily study other parameters of interest in the
frequency domain, like the chirp bandwidth. To do so, the user configures the MATH
function FFT of the RTO, with a center frequency of 400 MHz and a span of 12.5 MHz
and applies the measurement function "signal bandwidth" to the spectrum. In order to
1TD02_0e
Rohde & Schwarz - History Mode
18
Application Examples
obtain best results, the signal is plotted as a frame average using a Hamming window.
This window type is recommended in the user manual [4] for sinusoidal signals. To
ensure that the spectrum of 3.5 MHz around a carrier frequency of 400 MHz is met for
all waveforms the user can add a mask to check this behavior for all pulses.
This setup is shown in Figure 17, and the measurement results for burst width and
signal bandwidth matches the described configuration. To check these parameters
now for all waveforms, the user simply presses the PLAY button of the History result
box, and the history mode will access all waveforms in the memory for measurement.
As a result, the pulse type two and three show intended simulated deviation. For the
pulse type one the mask test in the frequency domain shows an intended shift of the
center frequency of 2 MHz (see Figure 18). Also the reduced signal bandwidth of
2 MHz is measured.
In summary, high timing resolution as well as a long observation time are key for the
analysis of pulsed signals in time and frequency domain. The RTO efficiently support
these requirements, where the history mode and the full set of test and measurement
functions are available, like in the standard continuous acquisition mode or "RUN Nx
SINGLE" mode.
1TD02_0e
Rohde & Schwarz - History Mode
19
Application Examples
Figure 17 – Radar Pulse Type 3
Figure 18 – Radar Pulse Type 1
1TD02_0e
Rohde & Schwarz - History Mode
20
Application Examples
4.3 Debug of Intermittent Faults
The second application example as described in chapter 1 is debugging of a digital
circuit to find intermittent faults. Particularly the mask and trigger features of the RTO
turn out to be useful for this application and this chapter will discuss the features in
more detail. As a test setup, the RTO connects to the RTO demo board. On the board
there is a 10 MHz TTL signal asserting a PRBS signal, which an active probe (RTZS30) captures for analysis with the RTO. This PRBS signals exhibits random signal
anomalies.
For a targeted search of a so far unknown problem of the demo board signal using the
RTO, the user may take a three-step approach. To localize the issue in a first step, the
RTO plots the digital signal of the design in an eye diagram using the display
persistence. Anomalies in the eye pattern will lead to the second step. The observed
anomalies are unspecific, and provide just an indication (Figure 19). For convenience,
the AUTOSET key will configure the scope, and setting the trigger to a double edge
trigger will display the eye. Clearly visible in the eye pattern is a runt for low and high
level of the digital signal. But there are some spurs in the middle, which will be in the
focus of the next step.
Figure 19 – Eye Pattern with Persistence
As a second step, the user specifies the desired tolerances by defining a mask, based
on either an interface standard or by design considerations. In this example, it is simply
a mask with a rectangular shape based on the design knowledge of TTL signals. The
mask menu is invoked for example with the "MASK" key on the face plate, and lets the
user specify a mask. In this case an inner mask is defined in the range of [5,95] ns and
[0.45,3.05] V. When this mask is applied, the RTO captures specific violations (see
Figure 20) and reports the statistics in the signal icon.
1TD02_0e
Rohde & Schwarz - History Mode
21
Application Examples
Figure 20 – Applied MASK Test (cont.)
Figure 21 – Applied MASK Test (stop on fail)
1TD02_0e
Rohde & Schwarz - History Mode
22
Application Examples
In Figure 21, the RTO stopped the acquisition of the signal, because a mask violation
was detected. This behavior was specified in the "Event Actions /Reset" tab of the
mask menu. The captured signal trace shows a glitch of about 10 ns pulse width.
For the third step, the information gathered is used to guide the user in taking
advantage of specific trigger features. In this case he will configure a GLITCH trigger
with a pulse width of less than 25 ns, as he might be unsure about the pulse width
variation of the glitch. In order to capture only waveforms with glitches, the trigger
mode is set to "Normal" and the resolution is set to 500 ps. Following the
dependencies in chapter 4.1, a record length 100 ksample is configured allowing the
recording of an arbitrary number of 500 bit-periods. If a fault occurred, it is of interest
what happened prior to this occurrence, so the reference point of the trigger is set to
98% of the display in the examples of Figure 22 and Figure 23.
With reference to chapter 4.1, the alerted user should check the history depth. For this
configuration, a scope with a standard acquisition memory of 20 Msample per channel
would support a history depth of 800 waveforms for a four channel RTO. The user may
specify the number of waveforms to be recorded in the trigger control box. With the
configured glitch trigger, an acquisition of a waveform will only happen if a glitch
occurs.
Figure 22 – Debug using the History Mode
After the acquisition is completed, the user can apply the comprehensive set of
analysis functions. In this case, the RTO has sampled 500 bit-intervals per waveform
(see top window Figure 22), a zoom into the time window shows the glitch and
applying the cursor helps to measure its characteristics. By changing the "Current acq"
field, for example with the navigation knob, the user scans through the individual
waveforms. This way the RTO enables the user to analyze the cause of the glitch in
1TD02_0e
Rohde & Schwarz - History Mode
23
Application Examples
the acquired data stream in detail and give him a high confidence in capturing all
intermittent faults.
Besides this directed analysis, the user has also the option with the RTO to analyze
the acquired data statically in the post-processing phase. For example, the
measurement functions will show him the pulse width for positive and negative pulses,
for all pulses in each acquired waveform and for the complete set of waveforms.
Additionally the user can enable a histogram for these values, including the statistics.
Once the user has configured this function, the replay of the history will complete the
statistics.
In Figure 23, the RTO displays these measurement functions in the lower, two
windows. It is apparent from the statistics that all 401 waveforms are counted and that
the minimum glitch pulse width is 9.5 ns. This can be determined with high confidence
as the RTO was setup to capture pulses up to a width of 25 ns, and the hardware can
2
detect pulses down to a width of 100 ps. The pulse width histogram shows distinct
bins at 100 ns and multiple of it, weighted by the relative occurrence, for more than
50.000 pulses.
Figure 23 – Debug using the History Mode
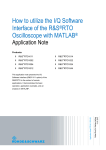
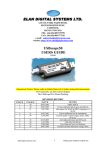
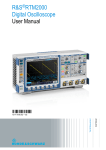
Similar to the application example in chapter 4.2, the timestamps are downloaded,
analyzed and shown in Figure 24. The time difference between glitches is displayed in
red versus the number of occurrence. From this graph, it becomes clear that the glitch
occurs after two and three seconds. However, for the moment, it is unclear whether the
2
1TD02_0e
50 ps for a RTO-1044
Rohde & Schwarz - History Mode
24
Application Examples
time difference is randomly distributed between 2 and 3 s. A second histogram in the
same axis in blue shows the time difference between every second glitch. This
histogram reveals that the glitches are distributed alternatingly between 2 and 3 s with
a periodicity of 5 s. The second plot in Figure 24 increases the resolution of this
histogram and plots the distribution relative to the mean value. The jitter distribution of
the glitch becomes apparent.
Timestamp Analysis
Timestamp Analysis
500
30
25
# of Occurence
# of Occurence
400
300
200
100
0
1
20
15
10
5
2
3
4
5
Delay between Glitches [s]
6
0
-2
-1
0
1
2
Normalized Delay
between two Glitches [us]
Figure 24 – Analysis of Timestamps
Looking at the overall observation time of 1000 s, the user may notice that a digital
oscilloscope could not acquire such a signal in a single acquisition with the selected
resolution. So the use of the history mode becomes mandatory for an in-depth
analysis. The history mode is not limited to the two application examples
aforementioned; the user might also use this mode for serial protocol or parallel
protocol analysis in combination with the Mixed Signal Option (MSO).
1TD02_0e
Rohde & Schwarz - History Mode
25
Conclusion
5 Conclusion
The history mode of the RTO allows the user to access previous acquisitions and to
apply the rich set of analysis functions of the RTO. The timing relation among these
acquisitions is retained and can be used as a basis for subsequent analysis.
Moreover this mode mitigates the trade-off between a high sample rate and a long
observation time. Several applications may benefit from the history mode; among
others, this application note has presented the analysis of two of them.
The versatile trigger of the RTO lets the user focus on the important parts of his
analysis through a selective recording. Moreover the RTO leverages the memory
architecture in a very efficient manner, and provides a rich set of test and
measurement functions to analyze the acquired waveforms. Furthermore, the
continuous time base lets the user extend the observation time far beyond the storage
capabilities of the acquisition memory. In summary, the described features make the
history mode an important tool, e.g. for debugging of digital circuits and analysis of
infrequent, intermittent signals or serial protocol data. Notably the history mode is a
standard feature for the RTO.
MATLAB is a registered trademark of The MathWorks, Inc.
R&S is a registered trademark of Rohde & Schwarz GmbH & Co. KG.
1TD02_0e
Rohde & Schwarz - History Mode
26
Literature
6 Literature
1TD02_0e
[1]
Guido Schulze, Bob Barnett, „The Impact of Digital Oscilloscope Blind Time on
Your Measurements,“ Rohde & Schwarz GmbH & Co. KG, August 2010. [Online].
Available: http://www2.rohde-schwarz.com/file_15192/1ER02_1e.pdf.
[2]
Test & Measurement, „R&S®RTO Digital Oscilloscope Specifications,“ Rohde &
Schwarz GmbH & Co. KG, December 2012. [Online]. Available: http://cdn.rohdeschwarz.com/dl_downloads/dl_common_library/dl_brochures_and_datasheets/pd
f_1/RTO_dat-sw_en.pdf.
[3]
Harry Nyquist, „Certain Topics in Telegraph Transmission Theory,“ in Winter
Convention of the A. i. E. E., New York, 1928.
[4]
Rohde & Schwarz GmbH & Co. KG, R&S®SMBV100A Vector Signal Generator -Operating Manual, München, 2012.
[5]
Test & Measurement, RTO Digital Oszilloscope - User Manual, München: Rohde
& Schwarz GmbH & Co. KG, 2012.
Rohde & Schwarz - History Mode
27
Literature
Appendix
A Appendix A
®
A MATLAB code example is given below, which was used to retrieve the timestamp
information of the recorded waveforms from the RTO for further analysis. Examples of
the analysis are discussed in the chapters 4.2 and 4.3.
1
2
3
4
5
6
7
8
9
10
11
12
13
14
15
16
17
18
19
20
21
22
23
24
25
26
27
28
29
30
31
32
33
1TD02_0e
%% ---- Establish Connection to the RTO ---RTO = visa('ni', 'TCPIP::10.113.10.39');
RTO.Timeout = 10;
fopen(RTO);
% Query and display the connected instrument ID String
fprintf(RTO, '*IDN?'); disp(['
ID: ' fscanf(RTO)])
% Work with the RTO history mode
% - get available number of acquisitions
% - get timestamps for every acquisition
%% ---- Configure the RTO ---% Enable history mode
fprintf(RTO, ':CHANnel:WAVeform:HISTory:STATe 1');
% Get available acquisitions and print
nofAcq = str2num(query(RTO, 'ACQuire:AVAilable?'));
fprintf('\n=======================================================\n');
fprintf('Number of available acquisitions: %i\n', nofAcq);
fprintf('=======================================================\n\n');
% create an array
timeStampRel = zeros(nofAcq,1,'double');
% Get timestamps for every acquisition and print
for idx = -(nofAcq-1):0
fprintf(RTO, 'CHANnel:WAVeform:HISTory:CURRent %i', idx);
fprintf(RTO, '*OPC?'); [~] = fscanf(RTO);
fprintf(RTO, 'CHANnel:WAVeform:HISTory:TSRelative?');
timeStampRel(nofAcq + idx) = str2double(fscanf(RTO));
fprintf('Acquisition %i\t%9.7f\n', ...
idx, timeStampRel(nofAcq + idx));
end
% Close connection
fclose(RTO);
% store data for further processing
save timeStamp.m timeStampRel;
Rohde & Schwarz - History Mode
28
Literature
B Appendix B
Table 3 shows a subset of retrieved timestamps of the recorded waveforms. The first
column indicate the acquisition index, the second one the associated timestamp. The
host based post-processing added the third column, showing the time difference
between two adjacent timestamps.
Table 3
1TD02_0e
Current acq.
Relative Timestamp [s]
Time Difference [µs]
-34
-0.196799628
95179.52141
-33
-0.101620106
20.29846
-32
-0.101599808
79.99993
-31
-0.101519808
79.99977
-30
-0.101439808
79.99997
-29
-0.101359808
79.99973
-28
-0.101279808
79.99995
-27
-0.101199808
79.99975
-26
-0.101119809
79.99997
-25
-0.101039809
79.99973
-24
-0.100959809
79.99995
-23
-0.100879809
479.99913
-22
-0.10039981
399.999143
-21
-0.099999811
399.999356
-20
-0.099599811
399.999145
-19
-0.099199812
399.999356
-18
-0.098799813
399.999161
-17
-0.098399814
399.999166
-16
-0.097999814
399.999351
-15
-0.097599815
399.99915
-14
-0.097199816
399.999373
-13
-0.096799817
95179.52106
-12
-0.001620296
20.298469
Rohde & Schwarz - History Mode
29
Literature
Index
ADC
Analog Digital Converter ............................. 5, 6
DRAM
Dynamic Random Access Memory ............... 11
LFM
1TD02_0e
Linear Frequency Modulated ........................ 17
PRBS
Pseudo Random Bit Sequence .................... 21
TTL
Transistor–Transistor Logic .......................... 21
Rohde & Schwarz - History Mode
30
Ordering Information
7 Ordering Information
1TD02_0e
Naming
Digital Oscilloscopes
Type
Order number
600-MHz, 2 channels
10 Gsample/s, 20/40 Msample
R&S RTO1002
1316.1000.02
600-MHz, 4 channels
10 Gsample/s, 20/40 Msample
R&S RTO1004
1316.1000.04
1 GHz, 2 channels
10 Gsample/s, 20/40 Msample
R&S RTO1012
1316.1000.12
1 GHz, 4 channels
10 Gsample/s, 20/80 Msample
R&S RTO1014
1316.1000.14
2 GHz, 2 channels
10 Gsample/s, 20/40 Msample
R&S RTO1022
1316.1000.22
2 GHz, 4 channels
10 Gsample/s, 20/80 Msample
R&S RTO1024
1316.1000.24
4 GHz, 4 channels
20 Gsample/s, 20/80 Msample
R&S RTO1044
1316.1000.44
Memory upgrade, 50Msample
per channel
R&S RTO-B101
1304.8428.02
Memory upgrade, 100Msample
per channel
R&S RTO-B102
1304.8438.02
Mixed Signal, 400 MHz,
5Gsample/s, 16 channels,
200 Msample/channel
R&S RTO-B1
1304.9901.03
®
®
®
®
®
®
®
®
®
®
Rohde & Schwarz - History Mode
31
About Rohde & Schwarz
Regional contact
Rohde & Schwarz is an independent group of
companies specializing in electronics. It is a leading
supplier of solutions in the fields of test and
measurement, broadcasting, radiomonitoring and
radiolocation, as well as secure communications.
Established more than 75 years ago, Rohde &
Schwarz has a global presence and a dedicated
service network in over 70 countries. Company
headquarters are in Munich, Germany.
Europe, Africa, Middle East
+49 89 4129 12345
[email protected]
North America
1-888-TEST-RSA (1-888-837-8772)
[email protected]
Latin America
+1-410-910-7988
[email protected]
Asia/Pacific
+65 65 13 04 88
[email protected]
China
+86-800-810-8228 /+86-400-650-5896
[email protected]
Environmental commitment
ı
Energy-efficient products
ı
Continuous improvement
sustainability
ı
ISO
14001-certified
management system
in
environmental
environmental
This and the supplied programs may only be used
subject to the conditions of use set forth in the
download area of the Rohde & Schwarz website.
PAD-T-M: 3573.7380.02/02.00/CI/1/EN/
R&S® is a registered trademark of Rohde & Schwarz GmbH & Co.
KG; Trade names are trademarks of the owners.
Rohde & Schwarz GmbH & Co. KG
Mühldorfstraße 15 | D - 81671 München
Phone + 49 89 4129 - 0 | Fax + 49 89 4129 – 13777
www.rohde-schwarz.com