1
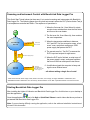
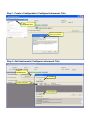
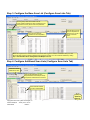
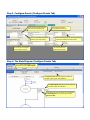
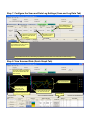
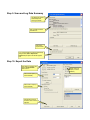
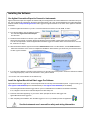
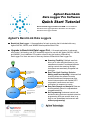
Agilent BenchLink
Data Logger Pro Software
Quick Start Tutorial
BenchLink Data Logger Installation CD-ROM. You can install the
BenchLink Data Logger applications listed below from the Agilent
BenchLink Data Logger CD-ROM.
Agilent's BenchLink Data Loggers
BenchLink Data Logger - A free application for basic scanning that is included with every
Agilent 34970A, 34972A, and 34980A Data Acquisition/Switch Unit.
Upgrade to BenchLink Data Logger Pro! - A licensed application for advanced
scan control, limit testing, and SCPI instrument control for use with the Agilent 34970A, 34972A,
and 34980A. Your installation CD contains a free 30-day trial version of BenchLink
Data Logger Pro. Here are some of the many features of BenchLink Data Logger Pro:
Start
Scan List A
(Base)
Event
Control Instruments
Send Notification(s)
Stop Scan
Events
Ev
en
ts
Scan List B
Control Instruments
Send Notification(s)
Stop Scan
ts
en
Ev
Scan List C
Event
Event
Control Instruments
Send Notification(s)
Stop Scan
Scanning Flexibility! Multiple scan lists
allow you to tailor individual scans to your
measurement needs. Event-based decision
making controls the scanning. Multiple
instruments are seamlessly integrated into
scan lists.
Real-Time Limit Checking, Decision
Making and Event Handling! Advanced limit
checking allows the software to make
decisions and branch between scan lists,
control instrumentation with flexible SCPI
commands, handle errors and send
notifications in response to events.
Easy Data Storage and Analysis! Data can
be automatically stored in a spreadsheetcompatible data file.
No Programming! Instrument control and
decision making that once required extensive
programming skills can now be done in an
easy to use spreadsheet environment...all
without programming!
Scanning and Instrument Control with BenchLink Data Logger Pro
This Quick Start Tutorial shows just how easy it is to control scanning and instruments with BenchLink
Data Logger Pro. The following pages show a typical test scenario where the DUT (Device Under Test) is
in a temperature-controlled test fixture. The sequence of operations is:
1. When the first scan list, Oven Warm-Up, starts,
a script closes switches that close the test fixture
and turn on the oven heater.
Start
2. The first scan list, Oven Warm-Up, then monitors
the oven temperature.
Oven Warm-Up
Scan List
Temp. 25°C Event
Test DUT
Scan List
Scan Start Event
Close Fixture
Turn on Oven
3. When the temperature stabilizes to between
24°C and 26°C for five successive scans, a limit
event* runs a script that configures a GPIB
power supply that powers the DUT.
4. The second scan list, Test DUT, measures the
DUT's input and outputs for eight scans.
Set Power Supply Output
5. When the DUT test is finished, a script turns off
the power supply's output, and opens switches
that turn off the oven and open the test fixture.
Scan Stop Event
Save Data
Send Notifications
Oven Off, Fixture Open,
Power Supply Off
6. A notification signals the computer to beep and
logs the scan finished event.
...all without writing a single line of code!
*Limit events include: above a high value, below a low value, out of range, in range, stabilized in a delta band, and
destabilized outside a delta band. You can set any of these limits to occur after a specified number of successive scans.
Starting BenchLink Data Logger Pro
After installing the Agilent IO Libraries and BenchLink Data Logger Pro, click this icon on your desktop to
start the application:
Once the application has started, click Help > Quick Start Videos to watch videos that show you how to
get started with BenchLink Data Logger Pro.
Note: If you are having difficulty running the application, refer to the software installation instructions at
the end of this document.
Step 1. Create a Configuration (Configure Instruments Tab)
A. Click
Configuration > New
B. Enter a Configuration
Name and Comments
Step 2. Add Instruments (Configure Instruments Tab)
A. Click
Add Instruments...
B. Click Find
C. Select Instrument(s)
D. Click Connect
Step 3. Configure the Base Scan List (Configure Scan Lists Tab)
Scanning always starts with the Base scan list.
In this example, the Base scan list is monitoring the oven
temperature in a DUT (Device Under Test) test fixture.
This channel continuously
measures the oven temperature.
This limit will occur when
the oven temperature is
between 24°C and 26° C
for five successive
scans.
Note: The images shown in of this tutorial are from a built-in Data Logger Pro simulation. Simulations allow you to view
BenchLink Data Logger Pro operations without having equipment connected. You can access this simulation by clicking:
Help > Start Simulation Mode > Getting Started with Multiple Scan Lists.
Step 4. Configure Additional Scan Lists (Configure Scan Lists Tab)
Click here to create
additional scan lists.
This scan list starts when the oven
temperature limit is reached (see above)
and performs measurements on the DUT.
These channels measure
the DUT's characteristics.
Turn
Over for
Step 5
Copyright © 2007-2010 Agilent Technologies, Inc.
Printed In Malaysia
January 2010 E0110
34830-90005
Edition 3
*34830-90005*
Step 5. Configure Events (Configure Events Tab)
Each script runs when the
corresponding event occurs.
These events are configured for the
Base scan list (Oven Warm-Up).
This is the limit event associated
with the Oven Temp channel.
These events are configured
for the Test DUT scan list.
When the limit event occurs, stop scanning on this
scan list and start the Test DUT scan list.
The configuration stops
when this scan list ends.
Step 6. The State Diagram (Configure Events Tab)
Click the Show State Diagram... button
(see above) to view the State Diagram.
The Sequence Table shows the order of execution for
scan lists, events, scripts, and notifications.
The State Diagram graphically shows the configured
scan lists, scripts, and notifications.
These codes (A2 > B2 >C2 and so on) cross-reference
the State Diagram to the rows and columns of the
Sequence Table.
Step 7. Configure the Scan and Data Log Settings (Scan and Log Data Tab)
Click a Start button to
start the configuration.
Click here to configure the
Base scan list's start and
stop settings.
Set data log naming
preferences here.
Click this button (one button for
each additional scan list) to set the
stop event for this scan list.*
* Only the Base scan list has a start setting. Any additional scan lists start on an event such as a limit occurring.
Step 8. View Scanned Data (Quick Graph Tab)
This is the Oven Temp channel.
The red dot indicates when the
limit occurred.
DUT measurements.
Text
This line indicates the
start of the Oven
Warm-Up scan list.
Configure the graph(s) here.
This line indicates the start
of the Test DUT scan list.
Current data.
Step 9. Scan and Log Data Summary
This dialog box appears
automatically when
scanning is finished.
Scan and data summaries
are listed here.
Click here to
export the data.
If you configured data to be saved automatically
during the scan (Data > Export Data
Preferences) the path to the data file appears
here.
Step 10. Export the Data
This dialog box appears after
clicking the Export Data...
button above.
Select format options (or
use the defaults).
Select rows to export (or
use the defaults).
Click a button to export
the data to a file or to the
clipboard.
Select columns to
export (or use the
defaults).
Installing the Software
Use Agilent Connection Expert to Connect to Instruments
Agilent Connection Expert is an Agilent IO Libraries utility that configures the IO interface between the instruments and your
PC. The IO Libraries are contained on the Agilent Automation-Ready CD or may be downloaded from the Agilent Developer
Network website at: http://adn.tm.agilent.com. Data Logger Pro supports the M.01.01.04 version of the Agilent IO Libraries
and newer.
1. Install the Agilent IO Libraries on your PC. Connect the instrument to the PC via LAN, GPIB, or USB.*
2. From the PC taskbar, click the Agilent IO Control
icon and select Agilent Connection Expert
from the menu.
3. Double-click the interface from the list. If your instrument appears in the list,
with a green check mark, Connection Expert has already found and verified communication with the instrument.
You can now skip ahead to Install the Agilent BenchLink Data Logger Pro Software below. If the instrument is not in the
list, continue on to step 4.
4. With the interface selected, right-click and select Add Instrument. If this is a LAN interface, click the Auto Find button.
Follow the instructions on the screen to complete the installation. When finished, you should see your instrument in the
list with a green checkbox.
5. If you are having difficulty connecting to the instrument, use the instrument's front panel to ensure the interface is enabled
and configured properly. Refer to the instrument's user's guide for details.
*You can also use a serial interface for the 34970A only.
Install the Agilent BenchLink Data Logger Pro Software
Agilent BenchLink Data Logger Pro is a licensed product that has a 30-day free trial evaluation period. To get a license, go to
www.agilent.com/find/34830A (for the 34970A/34972A) or www.agilent.com/find/34832A (for the 34980A).
1. Insert the Agilent BenchLink Data Logger CD into your PC's CD ROM drive. Installation should start immediately.
If not, navigate to the CD drive in Windows Explorer and click Setup.exe.
2. Follow the instructions appearing on your screen. When prompted to select a data logger click:
Agilent BenchLink Data Logger Pro.
3. After completing the installation, click the Data Logger Pro icon on your desktop to start the application:
See the instrument user's manual for safety and wiring information.