1
Khalil Ismailov
3.
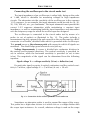
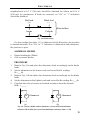
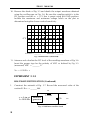
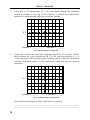
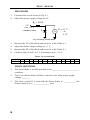
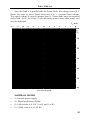
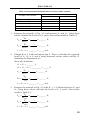
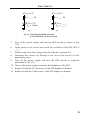
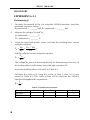
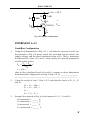
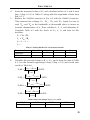
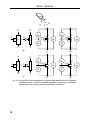
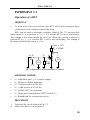
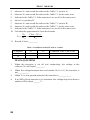
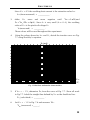
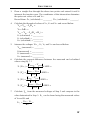
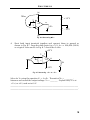
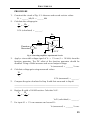
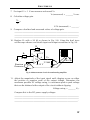
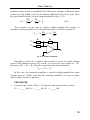
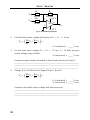
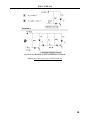
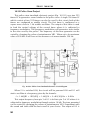
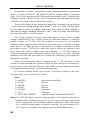
Using the VT of Experiment 3.1.1 for each diode sketch the expected
output waveform v0 on Fig. 3.22. Choose a vertical and horizontal
sensitivity commensurate with the secondary voltage.
0V
Volts/Div = ________
Time base = ________
Fig. 3.22 Waveform v0 (expected)
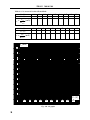
4.
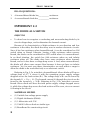
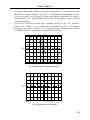
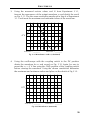
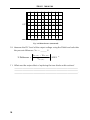
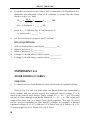
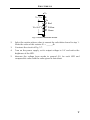
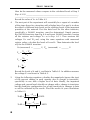
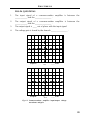
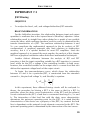
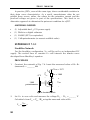
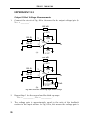
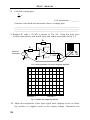
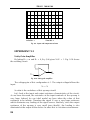
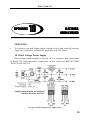
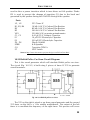
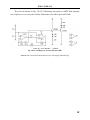
Using the oscilloscope with the coupling switch in DC position obtain
the waveform for v0 and record on Fig 3.23. Be sure to preset the v0 = 0
V line using the GND position of the coupling switch. Label the maximum
and the minimum values of the waveform using the chosen vertical
sensitivity.
0V
Volts/Div = ________
Time base = ________
Fig. 3.23 Waveforms v0 (measured)
How do the waveforms of Step 3 and Step 4 compare?
_______________________________________________________________
______________________________________________________________.
52