1
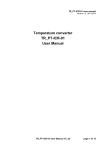
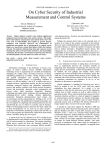
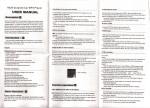
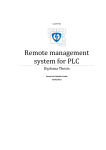
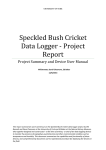
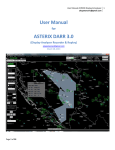
Olivera JANKOVIĆ1, Ratko JANKOVIĆ2 AIR DEPOT "ORAO" – Bosnia and Herzegovina (1), "CICAK" – Bosnia and Herzegovina (2) Remote monitoring RH&T using sensor and PIC MCU over Zigbee Abstract. This article describes realized system for remote monitoring relative humidity & temperature (RHT) using accurate SHT21 sensor and PIC MCU over ZigBee. PIC MCU is programmed to communicate using I2C interface with this sensor and display the information on a character LCD. Using XBeeRS-232 Adapters/XBeePRO RF Modules provides wireless link to remote PC's GUI which was realized using C# & ZedGraph. The system can be used in many applications for RH&T monitoring especially where high precision and long term stability is required. Streszczenie. W artykule opisano system zdalnej kontroli temperatury I wilgotności. Do tej kontroli użyto czujnika SHT21 oraz oprogramowania PIC MCU. Cały system przesyła dane do zewnętrznego komputera za pośrednictwem interfejsu Zigbee. Zdalne monitorowanie wilgotności i temperatury z wykorzystaniem interfejsu Zigbee Keywords: Remote monitoring system, sensor, microcontroller, ZigBee network. Słowa kluczowe: zdalne monitorowanie, pomiar temperatury i wilgotności, Zigbee doi:10.12915/pe.2014.09.42 Introduction Temperature and relative humidity are two very important ambient parameters that are directly related to human comfort. On the other hand to avoid damage of products, or to achieve proper process conditions, it is often important to keep the environment and the indoor climate within certain temperature and humidity limits. Low relative humidity may dry up the product, or high relative humidity can cause significant, sometimes irreparable damage to sensitive equipment, supplies, and products. There is a recommended value for relative humidity & temperature, minimum and maximum acceptance limit for RH&T in production and process environments like libraries, breweries, storages, inside medical and other warehouses. Temperature and humidity specifications need to be based on the needs for the raw materials/finished products that you are storing in the warehouse. In case there are no other requests one possible solution is to read the labels on things you store to determine the storage conditions required, and to base your warehouse specifications on these. Remote monitoring and data acquisition begins with the physical property or physical phenomenon which is to be measured and monitored. Sensors are the devices which generate the data for the system to acquire. In this example was used SHT21 acurate humidity and temperature sensor (sensing accuracy 2%) of Sensirion [1] which is to set new standards in terms of size (3x3mm) and intelligence. SHT21 features a generation 4C CMOSens chip. Besides the capacitive relative humidity sensor and the band gap temperature sensor, the chip contains an amplifier, AD converter, OTP memory and digital processing unit. Every sensor is individually calibrated and tested and provides calibrated, linearized signals in digital, I2C (Inter-Integrated Circuit, I²C) format. The sensor is connected with control circuit board via the I2C serial digital interface. This mode is especially appropriate in case like this, when the integrated circuit and microcontroller which the integrated circuit should exchange data with, are within the same device. The realized system for monitoring is composed of custom designed PCB (printed circuit board) built around the PIC16F877 microcontroller. PIC microcontroller is programmed to communicate using I2C interface with these sensor, read the temperature and relative humidity data, and display the information on a character LCD. The circuit board can be controlled remotely, from a PC through an GUI application that is running on the PC, via RS232 port using ZigBee wireless technology (see Fig.1). ZigBee is a universal wireless language connecting radically dissimilar devices to work together and enhance everyday life. ZigBee standard [2] is mainly for wireless sensor networks, like Bluetooth is for short distance communications and Wi-Fi is for internet. ZigBee Alliance provides a simple, low cost and low power wireless control standard for remote monitoring and controlling, based on IEEE 802.15.4, the standard for low data rate wireless personal area networks (WPANs). As part of Digi's drop-in networking product family, Digi XBee with ZigBee adapters can be used [3] in virtually any location where conditions are extreme, including industrial applications where it can be used both for monitoring and control. In this case Digi's XBee RS-232 adapters based on XBee/PRO RF modules are used to enable existing devices for ZigBee connectivity [4,5], end-to-end device networks without the need for a wired network infrastructure. An indoor/outdoor range for XBee-PRO devices is 90 m / 1600 m. PC application in the form of a GUI (Graphical User Interface) is created and then used to set appropriate input control parameters and for monitoring RH&T data from sensor. This user software is realized using C# & ZedGraph for graph plotting and enables data acquisition, various data analysis and data presentations [6]. In industrial plants, large amounts of data must be recorded during production, storage products and quality certificates (for QMS - Quality Management System, etc.). Due to portability and simple wireless setup, realized system of wireless monitoring & measurement of RH&T automates documentation (QMS records, etc.) of these data and performs appropriate alarm if limit values are close to or exceeded (e.g. yellow alarm or red alarm). The system (shown in Fig. 5) is realized in accordance with user requirements of "Čičak" - metal and machine building industry in Mostar. Quality and accuracy of the described system is acknowledged by several tests and user satisfaction. PRZEGLĄD ELEKTROTECHNICZNY, ISSN 0033-2097, R. 90 NR 9/2014 165 Fig.1. The implemented system overview Microcontroller Support Circuitry The system that is used for monitoring relative humidity and temperature is based on custom designed and developed printed circuit board (see Fig. 2), a compact controller board based on the Microchip technologies. The PCB is designed in a modular manner. The schematic (shown in Fig. 3) and board layout diagrams have been created using the Eagle (Easily Applicable Graphical Layout Editor - Version 5.10.0 for Windows), PCB design tool [7] and it was used laser printer transfer method of board etching [8]. The PCB supports RS-232 communication with a PC; SPI and I2C busses for communicating with other chips; PCB supports Parallel Slave Port communication; four analog input (05V) and standard 5V CMOS digital I/O for anything else. Real-Time Clock (RTC) and calendar (PFC8583P) with battery supply is used to keep track of the current time even when the MCU is off. Additional features of the PCB is bootloader. A bootloader is a small program running in the microcontroller which is to be programmed and bootloader needs to be the first thing which is running after device reset. This program allows downloading new firmware to the microcontroller via RS232 serial interface and to develop and load new code to the PIC without use of device called "programmer". Together with a relatively powerful processor and I/O capability the PCB allows multi-purpose using and the wide range of projects and applications. Fig. 2. Photograph of the PCB with SHT21 sensor For higher level connectivity, the board has RS232 DB9 connector, power switch and there are very useful four user buttons on the board which may be programmed using polling or interrupt service routine. 166 In order to present the system output, standard two line LCD (2x16 characters) with backlight is placed on the board, where the output from the RH&T sensor displaying both the temperature and humidity level on the screen (see Fig. 2). The humidity level is shown as % of RH (relative humidity) while temperature as unit of C (degree of Celsius). The PIC16F877 [9,10] is the heart of the PCB containing the central processing unit of the board. The PIC16F877 is 8-bit microcontroller based on reduced instruction set computer (RISC) architecture with only 35 instructions. It features all the components which modern microcontrollers normally have. For its low price, high quality and easy availability, it is a good solution in applications such as: measurement of different values, machine control devices, the control of different processes in industry, etc. The PIC has a flash type program memory (up to 8K x 14 words of FLASH Program Memory), which can be written, erased and rewritten (chip can be reprogrammed up to 100.000 times). The PIC16F877 has 33 I/O pins, divided into 5 ports (Port A-Port E), which can be configured in various ways to communicate with many different peripheral devices. Many of these pins are multiplexed with more than one function. Each port has an associated PORTx register (bi-directional port) and a TRISx register (data direction register). Setting a bit in the TRISx register makes the corresponding pin an input, clearing the bit makes it an output. Here PIC16F877 microcontroller is connected to HD44780 LCD in 8-bit data interface - eight bus lines (D0 to D7) are used for data transfer (as it is presented in Fig. 3). LCD Device uses PORTD (RD0-RD7 Data Lines) and PORTE (RE0-RE2 Control Lines (RS, RW and E). When RS pin is low (RS=0) instruction register is selected, information on data bus is taken as commands. When RS pin is high (RS=1) data register is selected and information on data bus is taken as ASCII value of respective character to be displayed on HD44780 LCD. To add SHT21 sensor, SMD (surface mount technology) type sensor chip is mounted to custom developed small, mini PCB that uses the standard I2C bus for control and data transfer. Recommended supply voltage (VDD) of SHT21 is 3.0V (range of 2.1- 3.6V) and power supply pins VDD and VSS(Ground) must be decoupled with a 100nF capacitor, that shall be placed as close to the sensor as possible. Typical application circuit (see Fig. 4) includes pull-up resistors for both SDA (Serial Data) and SCK (Serial Clock) lines. For soldering SHT21, standard reflow soldering is used but it is important that after soldering, the devices should be stored at ambient conditions (>40%RH) during more than 5 days to allow the sensor element to re-hydrate. PRZEGLĄD ELEKTROTECHNICZNY, ISSN 0033-2097, R. 90 NR 9/2014 Fig 3. Printed circuit board schematic SHT21(SHT21D) communicates with I2C protocol that allows communication of data between I2C devices over two wires. The I2C protocol defines the concept of master (the device that is in charge of the bus at the present time) and slave (simply listen to the bus) devices. It sends information serially using one line for data (SDA) and one for clock (SCL). Fig. 4. Typical application circuit, including pull-up resistors Rp (e.g. 10k) and decoupling of VDD and VSS by a capacitor There are two modes to communicate with the SHT21 sensor: hold master (used in this case) or no hold master mode. In the first case SCL line is blocked and SHT21 keeps the bus busy until measurement is finished. No hold master mode allows processing of other I2C communication tasks on bus while the sensor is measuring. By default sensors have the same I2C address set during production. It is I2C 7-bit, device address equal '1000'000' (0x40). Each transmission sequence begins with Start condition (a high to low transition on the SDA line while SCL is high) and ends with Stop condition (a low to high transition on the SDA line while SCL is high). After sending the Start condition, the subsequent I2C header consists of I2C address and an SDA read/write direction bit (for writing the first I2C byte will be 0x80, for reading 0x81). The sensor indicates the proper reception of a byte by ACK bit. After the issue of a measurement command (0xE3 for temperature – temperature sensor output ST; 0xE5 for relative humidity - relative humidity sensor output SRH ), the MCU must wait for the measurement to be completed. Measured data are transferred in two byte package (MSB,LSB) and with relative humidity signal output -SRH the relative humidity RH (Humidity Range: 0% to 100% RH) is obtained by the following formula (1) and result is in %RH. (1) RH 6 125 S RH 216 The temperature T (Operating Temp. Range: -40°C to +125°C) is calculated by inserting temperature signal output ST into formula (2) and result is in C. (2) T 46.85 175.72 ST 216 For measurement is used the highest resolution (12 bit for RH and 14 bit for T) but in both formulas for computing no matter which resolution is chosen. Relative humidity reading strongly depends on temperature. In case of testing or qualification the reference sensor and test sensor must show equal temperature to allow for comparing humidity readings. For implementations of the firmware programs (code programmed into the microcontroller) on the previously designed hardware modules is used MPLAB IDE [11]. MPLAB IDE and HI TECH C are used to write, compile and debugging of the programs and PICBootloader+ software to "burn" .hex file onto the flash memory of the microcontroller [12]. The PIC will then begin executing the program immediately upon power up. Here described Microcontroller Support Circuitry may be used alone for monitoring RH&T( "user interface" realized using four buttons on the PCB, mentioned before) and can be used as a transmission module to send the measured data using ZigBee wireless link. ZigBee wireless link The wireless remote monitoring system has more and more application and here a remote monitoring system based on ZigBee is presented. ZigBee is a wireless communications protocol is built upon the IEEE802.15.4 standard (standard defines robust radio PHY (physical) and MAC (medium access control) layers). ZigBee defines the network layer specifications and provides a framework for application programming in the application layer. It is designed for low speed (20-250kb/s), low cost communication between two or more devices, making it ideal for many applications. In this system ZigBee network (point-to-point topology) is a medium for data transfer between GUI, running on host PC and MCU board. Here used the XBee RS-232 Adapters with XBee-PRO RF modules, shown in Fig. 6 provides wireless connectivity to any RS-232 serial device. Unlike an embedded wireless module, which requires design integration and development time, these off-the-shelf adapters provide instant wireless connectivity to existing RS-232 serial devices. Quite often, wireless modules are used as a bridge between a computer and a microcontroller or sensor. PRZEGLĄD ELEKTROTECHNICZNY, ISSN 0033-2097, R. 90 NR 9/2014 167 Fig. 5. Photograph of the implemented system The XBee-PRO RF modules were engineered to operate within the ZigBee protocol and support the unique needs of low-cost, low-power wireless networks. The XBee-PRO RF modules operate within the ISM 2.4 GHz and interface to a host device through a logic-level asynchronous serial port. Through its serial port, the module can communicate with any logic and voltage compatible UART, as shown in Fig. 7. Serial communications depend on the two UARTs (the microcontroller's/PC's and the RF module's) are to be configured with compatible settings (baud rate, parity, start bits, stop bits, etc.). GUI A graphical user interface or GUI is a type of user interface which allows people comfortable way to interact with a computer and computer controlled devices [13]. The Wi-RH&T, user friendly graphical interface was developed to display current, time stamped information about air conditions, such as temperature and relative humidity. GUI is programmed in the C# language (MS Visual C# 2010 Express Edition) and ZedGraph [14] was used for chart plotting and MS Access database for storing data. ZedGraph is a set of classes, written in C#, that provide a high degree of flexibility, for creating 2D line and bar graphs of arbitrary datasets. When the user starts the WiRH&T program, the first step is to connect with the XBee modul using COM port. The desired port and parameters used during serial communication (baud rate, stop bits, etc.) should be selected from appropriate a pull-down lists (located inside group "Port" in the upper right corner of the Wi-RH&T window). When the port is opened (pressing button "Otvori port") the main GUI functions are enabled. Fig. 6. Photograph of the XBee PRO ZB RS-232 Adapter (inside and outside) with external antenna The pre-condition for the XBee modules to perform firmware updates and to configure the modules is to be connected to a computer. Using free Digi's X-CTU configuration software, one module is configured as Coordinator (each network requires one and only one coordinator) and the other as End Device. Personal area network identifier must be a unique and the same (e.g. PAN ID= 3333) for both modules and network addresses (short 16-bits/long 64-bits) have to match. This ensures that the End Device and the Coordinator talk to each other. Fig. 7 System Data Flow Diagram in a UART-interfaced environment 168 Fig.8. GUI view at the online acquisition mode with RH&T graphs The parameters, temperature and humidity are measured once per interval. This interval can be changed by selecting the desired value from the slider (labeled as "Interval") by dragging on it. The user can define a location and appropriate max/min limit value for temperature and humidity (inside group "Alarmne granice"), so as to differentiate between the locations and conditions for alert. These information will be recorded in database. When the measurement process is active (starting and stopping of the measurement process can be done using "Start" and "Stop" buttons) the user is able to see the current RH&T data coming from the sensor in the corresponding fields. If program detects relative humidity or temperature outside/near the acceptable ranges, alerts will PRZEGLĄD ELEKTROTECHNICZNY, ISSN 0033-2097, R. 90 NR 9/2014 be displayed on the GUI through the change in the background color (red/yellow) of these corresponding fields after which a long beeps will sound. Also on the GUI is illustrated air parameter RH&T flow in the form of an easy to read graphs, as can be seen in Fig. 8. Aside from the user being able to view continuously updated data on the GUI, the system has other features and functionalities (on the menu strip, there are different drop-down menus named File, Port, PAN, etc.). Using PAN menu (or "PAN" group options on the GUI) for example, it's possible to view and (pre)configure XBee parameters with AT commands. List of all AT commands available from Help menu. Fig. 9. Offline mode - The data set includes a set of pairs of values (temperature, RH) and this is ideal for the use of a Scatter chart The "Grafovi" feature provides 2D plotting facilities in offline mode, provides user with ability to zoom, resize and print graph too. In this mode the whole drawing points must be provided copying from database (using menu named "Baza podataka") to appropriate text box and the user can ( provided through menu item "Naslovi") give titles and axis labels, and a legend for chart (see Fig. 9). For example, user can plot the variation of relative humidity with temperature. In these situations there are two parameters where one depends on another; for every temperature value (in centigrade) there will be a corresponding value of relative humidity. The data set includes a set of such pairs of values (temperature, RH) and this is ideal for the use of a Scatter chart. The chart, as shown in Fig. 9. has temperature along the horizontal axis and relative humidity along the vertical axis. Fig. 10. Report from the database – measured temperature in the period of time (Quality Record) Monitoring is the systematic and regular collection of a measurement. During the planning phase the user (e.g. manufacturer) should define what when and how data should be monitored - the monitoring of data may be continuous or periodic, depending on the user requirements. Measurement data may be retained as a quality record (see Fig. 10) in a form that is retrievable, suitable for analysis and meets both QMS and regulatory requirements. The RH&T monitoring data should be recorded and available for review (to assess whether the required storage conditions have been met). Described GUI may be modified and upgraded easily by adding custom fields or adding new features in accordance with user requirements. Conclusion Measurement and monitoring of temperature and relative humidity finds applications in numerous areas. The use of smart sensors which have both temperature and humidity sensors (with calibration and communication interface all built inside them) simplifies the design and implementation, and reduces the overall cost. The experimental results show that the realized system implements safe and convenient remote monitoring of the environment in warehouse and has high availability and reliability. The implemented database stores the data collected by sensor, enabling the local management of environmental data. Due to portability and easy installation, the system can be used both for long and short term monitoring. The developed printed circuit board allows adding additional sensors for monitoring other air parameters e.g. carbon dioxide, and realized GUI allows easy upgrade. REFERENCES [1] SHT21 datasheet, Sensirion - Switzerland, Ver.3, December 2011 [2] ZigBee Specification, ZigBee Alliance document 053474r17, January 2008 [3] Olivera Janković, Monitoring data from the sensor in the drop-in network concept, 56th ETRAN Conference - Zlatibor, presented paper, June 2012. [4] XBee/XBee-PRO RF Modules - 802.15.4 -v1.xEx, Product Manual Digi International, 2009 [5] Olivera Janković, Using XBee OEM Modules for the implementation of the ZigBee Network, International Symposium INFOTEH-JAHORINA Vol. 11, p. 1066-1070, March 2012. [6] Wiliem, D.Hargreaves, R.F.Stapelberg, Prasad K.D.V.Yarlagadda, Identification of Critical Criteria of On-line Data Acquisition system, AIJSTPME journal, (2008) Vol. 1, No.2, pp. 11-15 [7] EAGLE- User Language ver.10.0, User documentation CadSoft, 2010 [8] Robot Platform, PCB Etching Using Toner Transfer Method, Feb, 2012. [9] PIC16F877XA datasheet, Microchip Technology Inc, 2003 [10] Easy PIC Development Board User Manual, Microchip Technology Inc, 1st Edition, April 2005 [11] MPLAB IDE Quick Start Guide, Microchip Technology Inc., 2006 [12] Olivera Janković, Using MPLAB IDE with PICDEM Z Development Platform, International Symposium INFOTEHJAHORINA Vol. 9, Ref. E-V-19, p. 782-786, March 2010. [13] Olivera Janković, GUI interface as support the integration of ZigBee Networks, International Symposium INFOTEHJAHORINA Vol. 11, p. 1134-1139, March 2012. [14] JChampion, A flexible charting library for .NET, Jun 2007 Authors: Mr inż. Olivera Janković, Air Depot "ORAO", str. Šabačkih đaka bb. 76300 Bijeljina Bosnia and Herzegovina, E-mail: [email protected]; Dipl. inž. Ratko Janković, "Ćićak" d.d. - metal and machine building industry, Rodoč bb 88000 Mostar Bosnia and Herzegovina, E-mail: [email protected]; PRZEGLĄD ELEKTROTECHNICZNY, ISSN 0033-2097, R. 90 NR 9/2014 169