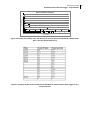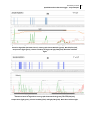
1
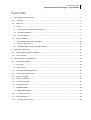
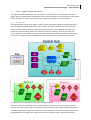
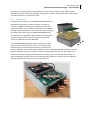
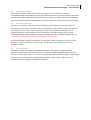
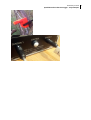
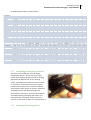
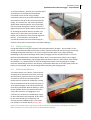
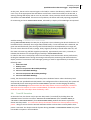
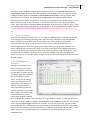
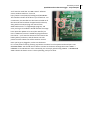
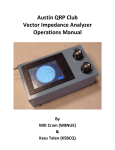
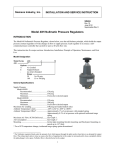
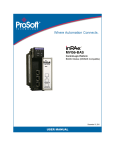
UNIVERSITY OF YORK
Speckled Bush Cricket
Data Logger - Project
Report
Project Summary and Device User Manual
Wil Bennett, David Chesmore, Ed Baker
12/6/2013
This report summarises work carried out on the Speckled Bush Cricket data logger project by Wil
Bennett and Dave Chesmore at the University of York and Ed Baker at the Natural History Museum,
who together designed and constructed - at the time of writing - a total of ten data logging devices
to monitor the presence of Leptophyes punctatissima and other environmental variables such as
temperature and humidity. This document summarises the capabilities and functionality of these
devices, and comprehensively documents correct operational procedure for deploying the devices in
the field.
University of York 2
Speckled Bush Cricket Data Logger - Project Report
Contents
1.
2.
3.
Data Logger System Summary............................................................................................................... 3
1.1.
Overview ......................................................................................................................................... 3
1.2.
Main Unit ........................................................................................................................................ 4
I)
Power.............................................................................................................................................. 6
II)
User Interaction & Operational Behaviour ................................................................................... 6
III)
SD Card Capabilities ..................................................................................................................... 7
IV)
GPS Capabilties............................................................................................................................. 7
1.3.
Sensor Modules .............................................................................................................................. 8
I)
Air Temperature & Relative Humidity .......................................................................................... 10
II)
Ambient Light Level..................................................................................................................... 10
III)
Broadband Microphone, Amplifier and Filter............................................................................ 10
Field Trials and Results ........................................................................................................................ 12
2.1.
Speckled Bush-cricket in Yorkshire ............................................................................................... 12
2.2.
The Trial Sites................................................................................................................................ 12
Device Operation (User Manual)......................................................................................................... 19
3.1.
SD Card Information ..................................................................................................................... 19
I)
User Input...................................................................................................................................... 19
II)
Data Output.................................................................................................................................. 21
3.2.
Attaching & Detaching Sensors..................................................................................................... 22
3.3.
Opening & Closing the Lid............................................................................................................. 22
3.4.
Battery Charging ........................................................................................................................... 23
3.5.
Battery Installation........................................................................................................................ 23
3.6.
Turn-On Procedure ....................................................................................................................... 24
3.7.
Device Operation .......................................................................................................................... 24
I)
STANDBY MODE ............................................................................................................................ 24
II)
MONITORING MODE.................................................................................................................... 26
3.8.
Turn-Off Procedure....................................................................................................................... 27
3.9.
Reset Procedure............................................................................................................................ 28
3.10.
Flashing new firmware ............................................................................................................... 28
University of York 3
Speckled Bush Cricket Data Logger - Project Report
1.
Data Logger System Summary
This report has been divided into two main sections. The first section is an overview of the data
logger device, detailing what it is capable of, what it contains and its exact specifications. The second
section functions as a user manual, with a full, comprehensive guide to use of the device.
1.1.
Overview
The Speckled Bush Cricket Data Logger is a fully custom-built device capable of being deployed in a
field and operating independently for weeks at a time. The device itself consists of a central unit
inside a waterproof box, with two smaller environmental sensor units attached to the box and
broken out onto five meter cables. The central box contains a battery, processor, SD card, LCD
screen, GPS unit and a number of other peripherals supporting the device’s operation. Each sensor
unit contains a high-sensitivity broadband microphone, light sensor, temperature sensor and a
humidity sensor. An overview of the system is displayed below.
The device uses two microphones to constantly listen to the local environment and processes all
audio in real-time. Using a series of audio-processing techniques and carefully designed algorithms,
it is able to identify the song of the song of any nearby Leptophyes punctatissima, also known as the
Speckled Bush Cricket (SBC), with a high level of accuracy. When an SBC is detected, the device
University of York 4
Speckled Bush Cricket Data Logger - Project Report
increments an internal counter of the number of “clicks” that have been heard, and this data is
periodically saved to an SD card alongside temperature, humidity, ambient light level, date, time of
day and the system’s current battery level.
1.2.
Main Unit
At the heart of the device is an STM32F4DISCOVERY board, an
affordable commercially available “breakout” board that
contains an ARM Cortex M4 microcontroller. The M4 uses a
32-bit architecture and is capable of running at up to 168MHz,
making it suitably powerful for the data-heavy task of ongoing,
real-time audio processing. The STM32F4DISCOVERY board
also includes an integrated ST-LINK programmer, allowing full
software updates to be carried out easily by anyone with
access to a Windows PC and a USB cable.
The STM32F4DISCOVERY board is them mounted to a large,
custom circuit board (referred to as the “main board”) that
accommodates all the peripherals necessary to support the
device’s operation. This includes power regulation, user interactivity and GPS capability. The main
board is mounted securely to a two-tiered, laser-cut plywood chassis that not only supports the
board, but also keeps the 4kg Lead-Acid battery securely in place. On the side of the device is a
robust pushbutton, used for all user-control during field operations. There are also two adjacent
waterproof sockets for the sensors to attach securely to.
University of York 5
Speckled Bush Cricket Data Logger - Project Report
University of York 6
Speckled Bush Cricket Data Logger - Project Report
I)
Power
Power to the device is controlled through use of a simple electrical “jumper”, as described in the
“Device Operation” section.
Each device is powered from a 12 volt, 12 ampere-hour lead-acid battery. At the tradeoff of its
relatively large size and weight, the battery provides enough energy for the system to run at fullpower for a number of weeks on a single charge; lead-acid batteries are also affordable and well
suited to extreme variations in temperature and full discharge-charge cycle s, so should operate
better than a lighter lithium-ion alternative.
The system contains a high-efficiency synchronous-buck voltage regulator that converts the battery’s
10 - 14 volts to a carefully maintained 5 volts, used throughout most of the digital systems on the
board. During operation, the regulator emits a faint, very high-pitched whine; this is a normal
phenomenon caused by the rapidly-oscillating inductor, and should not be mistaken for a device
malfunction!
Each device contains a battery level monitor; the reading can be displayed on the screen at any time,
and is also saved to the SD card alongside other collected data. During field use, the device monitors
the battery voltage closely, and automatically shuts-down if the battery level falls below a userspecified threshold to help prevent battery damage that can result from a so-called “deep
discharge”.
II)
User Interaction & Operational Behaviour
During operation, the device is controlled primarily through use of a single button on the side of the
box (referred to as the CONTROL button). There is a backlit LCD screen in the center of the device
that displays the status of the box at any given time, and its various modes and menus are navigated
intuitively using the CONTROL button.
Once a battery has been connected and the device is running, it runs in one of three operational
states, as controlled by the user. Whilst a full description of each operation and how it may be
controlled is given in the “Device Operation” section, they are also summarized briefly here.
(i)
SLEEP MODE
In this mode, the central processor is almost entirely shut-down, and all other peripherals such as
the LCD screen and GPS module are set to low-power modes to further reduce overall current draw.
SLEEP MODE is the default state of the device when the battery is plugged in.
(ii)
STANDBY MODE
This is the mode used when the device is started and being prepared for monitoring. Entering this
mode, the device reads user-configuration values from the SD card, tests the sensors, microphones,
GPS and other peripherals to ensure everything works. Once these start-up checks have been
completed, information from all peripherals is displayed on the LCD screen, and messages are
scrolled though using the CONTROL button.
University of York 7
Speckled Bush Cricket Data Logger - Project Report
(iii)
MONITORING MODE
This mode is the actual state in which the device 'listens' to its surroundings, collecting
environmental data and periodically writing the collected information to the SD card. The device will
operate in this mode indefinitely until it is turned off by the user, or until the battery falls beneath a
certain user-defined threshold, at which point it will auto-shutdown to help prevent battery damage.
III)
SD Card Capabilities
There is an SD card slot on the device used to read from and save data to an SD card. This is an
essential part of the device’s operation; there is a configuration file stored on the SD card that may
be edited by the user, and is read by the device on start-up to determine some aspects of its
operational behavior. These include, but are not limited to, microphone gain settings, sensor
enable/disable flags and parameters to allow fine tuning of the insect-recognition algorithms. The
device will not run without an SD card containing this parameter file.
As well as providing operational parameters, the SD card is used to log all data to. Data is saved in
the form of a plain-text file with a .txt extension. Further details are provided in the “Device
Operation” section.
IV)
GPS Capabilties
Each device is fitted with a Maestro A2035H GPS module, which when activated can obtain
millisecond-accurate time and date information, as well as a latitude-longitude location typically
accurate to within a few meters. The device usually takes less than a minute to acquire a signal when
used outdoors. It performs with varying reliability indoors; in cases where a signal is found it
invariable takes much longer than when used outdoors.
University of York 8
Speckled Bush Cricket Data Logger - Project Report
1.3.
Sensor Modules
There are two sensor units supplied with each device that are used to monitor the local
environment. The devices themselves each consist of a small, densely-populated circuit board
fabricated to a high-standard to ensure durability during outdoor use. The circuit board is mounted
inside a custom-designed 3D-printed enclosure, spray painted with a coat of highly visible UVprotecting paint, and then repeatedly lacquered; this was necessary to ensure all sensors gained
maximum exposure to the environment whilst simultaneously ensuring that they were thoroughly
waterproofed against all weather conditions.
Each sensor unit operates three fully-digital internal sensors operating on a single fully-buffered I2C
data bus, and a fully-analogue microphone circuit that sends an amplified audio signal back to the
main device for processing. The connecting cable has six conductive cores, carrying audio, data and
power. The sensors are connected to the main device via fully waterproofed IP67-rated connectors,
featuring gold-plated connectors and a silicone-rubber seal.
University of York 9
Speckled Bush Cricket Data Logger - Project Report
University of York 10
Speckled Bush Cricket Data Logger - Project Report
More detailed specifications of each sensor are provided in the following sections.
I)
Air Temperature & Relative Humidity
Despite being two very separate metrics, both temperature and relative humidity are measured by a
single chip within the sensor unit, a Sensirion SHT21. The large apertures on each side of the sensor
module allow good airflow through the device, which in turn allow the SHT21 to make accurate
measurements. Nonetheless, it should be kept in mind that there is a short delay between sudden
environmental changes and a corresponding change in the measured value (e.g. if stored in a
heated car and suddenly exposed to a cold winters day, it could take up to 10 minutes for the device
to adjust to the new ambient temperature and humidity).
(i)
Temperature
The SHT21 is programmed to resolve the current temperature to the nearest 0.01 °C.
It has a typical accuracy of ±0.3°C.
(ii)
Humidity
Relative humidity is resolved to the nearest 0.04%.
It has a typical accuracy of ±2%.
II)
Ambient Light Level
The light-level sensor used is an Intersil ISL29003. This device features two photodiodes, respectively
capable of measuring both full-spectrum light levels, and light levels of the infrared spectrum only.
The ISL29003 is capable of measuring an ambient light level of up to 64,000 Lux with a resolution of
1 Lux, or a light level of up to 1000 Lux with a resolution of .001 Lux.
At the time of writing, the device has been programmed to work in the maximum-range mode,
capable of measuring up to 64,000 Lux to the nearest 1 Lux. Every time a reading is taken, both the
full-spectrum measurement and the infra-red measurement are recorded to the SD card.
Note that the photodiode chip is placed directly beneath a light-diffusing panel on the sensor
enclosure. Its purpose is both to diffuse incident light and to protect the electronics from rainwater.
Though the diffuser has been carefully selected for relatively flat attenuation across the light
spectrum, there is still a reasonable level of light attenuation overall, and as such the light level
readings should not be interpreted as an exact reading of ambient light level in Lux, but rather as
relative Lux levels between different readings, for example at different times of day.
III)
Broadband Microphone, Amplifier and Filter
The microphone is the single more important aspect of the sensor unit, and has been optimized to
detect relatively quiet, high-frequency cricket songs. The microphone used is a Knowles
SPU0410LR5H-QB, which is an ultrasonic microphone with a rated frequency response of up to
80kHz (approximately 4 – 5 times the frequency response of the human ear). A SBC typically sings at
40kHz, which is well within the available range of the system. In fact, the rest of the system has also
been designed to perform well with audio at up to 80kHz, so that only a software update would be
required to adapt the system to listen to any insect or mammal with a song anywhere from 100Hz to
80kHz.
Immediately following the microphone stage is a high-gain, low-noise amplification stage that has a
fixed gain of 100, allowing the audio to be transmitted along the 5 meter cable back to the main
University of York 11
Speckled Bush Cricket Data Logger - Project Report
device for processing, whilst minimizing the introduction of electrical noise along the cable. Once the
signal reaches the main device, it passes through a final hardware stage – a Linear Technology
LTC1564 audio low-pass filter (LPF) and amplifier – the breakpoint and gain of which are digitally
configured by the microcontroller, based on user-input parameters on the SD card.
The LPF, which has a steep 8th order roll-off at the specified break frequency, can be adjusted to
attenuate frequencies from above 10kHz to above 150kHz, in 10kHz increments. This stage is not
only essential for the avoidance of aliasing when the analog audio is read by the microcontroller, but
also helps in the successful identification of the target insect song; by effectively removing all
frequencies above approximately 40kHz, the audio signal is already much ‘quieter’, which will help
the software recognition algorithms to ‘pick out’ the 40kHz spikes.
The gain stage, which can be programmed to provide anything from 1 (no amplification) to 15, can
be configured on the SD card. This parameter is effectively directly adjusting the sensitivity of the
microphone, allowing it to hear quieter, more distant insect calls. Note, however, that whilst a
higher sensitivity will allow the device to pick up quieter sounds, it will be more susceptible to being
overloaded, or ‘saturated’, by common but unwanted noises such as rustling leaves or nearby roads,
which greatly reduces the device’s ability to detect SBCs.
University of York 12
Speckled Bush Cricket Data Logger - Project Report
2.
Field Trials and Results
2.1.
Speckled Bush-cricket in Yorkshire
SBC has been recorded in Yorkshire for more than 100 years but only sporadically, usually with single
records. There has been no evidence of the species breeding in the county until recent years when
three colonies have been found; these are indicated in Figure 2.1. It is interesting to note that the
two sites in East Yorkshire (North Cave Wetlands and West Hull) appear to have been colonised for a
number of years given the large number of crickets recorded, even though the first records were in
2011 and 2010 respectively.
2.2.
The Trial Sites
A number of short and extended trials were carried out at York University, gardens at North Cave
Wetlands (NCW), a Yorkshire Wildlife Trust nature reserve in East Yorkshire where the target species
is known to exist. NCW is 40ha in size and is an old sand and gravel extraction site
(http://www.northcavewetlands.com). Figure 2.2 is a map of NCW indicating where the logger was
located. This was amongst trees of various deciduous species including Sorbus aucuparia, Acer
campestre, A. pseudoplatanus, Betula pendula, Salix spp. and a sparse undergrowth. Figures 2.3 and
2.4 are photographs of the logger and one sensor respectively deployed on 25 October 2013.
Manual recording of the activity of the species at this location was undertaken using a bat detector
(Magenta Bat4) tuned to 40kHz. Results for 20 October 2013 between 10:11am and 10:39am
ranged from 23-49 calls per minute (N=28, mean=32.9, SD=7.64). The received signal strength
varied considerably indicating that the insects were spread widely. Approximate locations could be
determined and this indicated that the majority of singing insects were well above 2m, mainly in the
tree canopy.
University of York 13
Speckled Bush Cricket Data Logger - Project Report
Figure 2.1 Map of Yorkshire showing the Three known Colonies
Figure 2.2 Map of North Cave Wetlands showing Location of Logger. Photograph on
right is of the main path. Left Image credit: http://www.northcavewetlands.com
University of York 14
Speckled Bush Cricket Data Logger - Project Report
Figure 2.3 Logger Deployed at North Cave Wetlands
Figure 2.4 Sensor Deployed at North Cave Wetlands at
a Height of 2.5m above Ground
N o r m a ls ie d B B C lic k s
University of York 15
Speckled Bush Cricket Data Logger - Project Report
1
0.9
0.8
0.7
0.6
0.5
0.4
0.3
0.2
0.1
0
0
0.1
0.2
0.3
0.4
0.5
0.6
0.7
0.8
0.9
1
Normalised Clicks
Figure 2.5 Scatter Plot of BB (y-axis) and NB Clicks (x-axis) for University site 25-29 October 2013.
1210 data points (100 hours)
Garden 1-2/11/2013
1
N O rm alised BB Clicks
0.9
0.8
0.7
0.6
0.5
0.4
0.3
0.2
0.1
0
0
0.1
0.2
0.3
0.4
0.5
0.6
0.7
0.8
0.9
1
Normalised Clicks
Figure 2.6 Scatter Plot of BB (y-axis) and NB Clicks (x-axis) for Garden Site 1-2 November 2013. 277
data points (23 hours)
North Cave Wetlands 20-21/10/2013
N o r m a l is e d B B C l ic k s
1
0.9
0.8
0.7
0.6
0.5
0.4
0.3
0.2
0.1
0
0
0.1
0.2
0.3
0.4
0.5
0.6
0.7
0.8
0.9
1
Normalised Clicks
Figure 2.7 Scatter Plot of BB (y-axis) and NB Clicks (x-axis) for North Cave Wetlands 24-25 October
2013. 287 data points (23.9 hours)
University of York 16
Speckled Bush Cricket Data Logger - Project Report
North Cave Wetlands 25-28/10/2013
1
0.9
N O rm a lise d B B C lick s
0.8
0.7
0.6
0.5
0.4
0.3
0.2
0.1
0
0
0.1
0.2
0.3
0.4
0.5
0.6
0.7
0.8
0.9
1
Normalised Clicks
Figure 2.8 Scatter Plot of BB (y-axis) and NB Clicks (x-axis) for North Cave Wetlands 24-25 October
2013. 557 data points (46.4 hours)
Table 2.1 Summary of SBC counts for North Cave Wetlands on 24-25 October 2013. Logger set to 5
minute intervals
University of York 17
Speckled Bush Cricket Data Logger - Project Report
Figure 2.9 Recording for North Cave Wetlands 24-25 October 2013. Upper graph shows detections
based on algorithm (46 in 46.4 hours). Lower graph shows NB clicks (green), BB clicks/50 (red),
temperature (light green), relative humidity (orange) and light/100 (pink). Black bar indicates
night.
Figure 2.10 Recording for North Cave Wetlands 25-28 October 2013. Upper graph shows 19
detections based on algorithm. Lower graph shows NB clicks (green), BB clicks/50 (red),
temperature (light green), relative humidity (lilac) and light/100 (pink). Black bars indicate night.
University of York 18
Speckled Bush Cricket Data Logger - Project Report
Figure 2.11 Recording for York University 25-29 October 2013. Graph shows NB clicks (green), BB
clicks/100 (red), temperature (light green), relative humidity (lilac) and light/100 (pink).
University of York 19
Speckled Bush Cricket Data Logger - Project Report
3.
Device Operation (User Manual)
This section of the report is designed to be a comprehensive guide to use of the data logger – from
battery charging to data retrieval.
3.1.
SD Card Information
The SD card is central to the operation of the device. Collected data is stored to the card, and
configurable device parameters are saved onto the card by the user for the system to read and act
on.
I)
User Input
There are a number of operational parameters that may be specified by the user through the
configuration file located in the SYSTEM directory of the SD card; the file is called “config.txt”. The
other file in this directory, sys.isamb, is a system file for the device that keeps track of the device ID
and run instance; This file must not be deleted, moved or modified under any circumstances.
During tests, we found that even the most basic word editors on an Apple computer running OSX
seem to do slightly odd things to the format of this .txt file when modified, saving it in more
advanced text formats than the one it’s natively saved in, and thus making it unreadable to the
device. Hence, we strongly recommend only editing the file in “Notepad” on the Windows OS. If
attempting to modify the file in a different environment, be sure to take a copy of the file
somewhere first so you’ve got a backup.
Inside the file, each variable has a name and an associated value, typically a number or a binary flag
(0 or 1). The value must always be within a pair of single quotations; Always use the ‘ (apostrophe)
character, not ` (grave accent) character. If in doubt, just don’t delete the quotations already in
there. The device will only be able to read numbers in this very specific format, and will throw an
error during load-up, displayed on the LCD screen, if this formatting has not been adhered to
(typically with a message describing a “STRING/CHAR ERROR”).
Below is an explanation of all the configurable values in the current version of the device. Note that
for the sensor parameters, sensor 1 and sensor 2 have the same format, so only sensor 1 is
explained.
(i)
Update Interval
Example: update_int
'2'
This is the time interval between recorded readings on the SD card, in minutes. E.g. In this case an
entry is made every two minutes. Note that the microphones, if enabled, are continuously
monitoring the environment for insect calls, whereas the other environmental sensors (temp, light,
humidity) will only take a reading at the end of each interval.
(ii)
Low Battery Cutoff Level
Example: batt_cutout
'10.8'
This is the battery level, in volts, at which the battery is treated as 0%. Note that at this percentage
the device will automatically enter a low-power state to avoid damage to the battery through overdischarge. Even in this state the current draw is still reasonable, and the device should not be left
connected to a flat battery for long – over-discharge may cause permanent damage to the battery.
University of York 20
Speckled Bush Cricket Data Logger - Project Report
(iii)
Minimum Narrowband Detection figure
Example: c_val
'10'
This is the value of variable ‘C’ in the Speckled Bush Cricket detection algorithm.
(iv)
Detection Threshold Ratio
Example: t_val
'0.9'
This is the value of variable ‘T’ in the Speckled Bush Cricket detection algorithm.
(v)
Broadband Detection Threshold
Example: s1_broadband_threshold
'15'
After the audio has been passed through a relatively broad band-pass filter (typically 30 – 50 KHz),
the maximum value in a given sample group is compared to this threshold level, and is counted as a
hit if it the measured value is greater than the threshold (i.e. lower threshold value = more
sensitive). Note that the units are arbitrary and some experimentation may be needed to find the
optimal level for the environment.
(vi)
Narrowband Detection Threshold
Example: s1_narrowband_threshold
'15'
Similar to the above, but after passing through a high-precision 40KHz filter with an extremely
narrow band (typically 39-41 KHz). This filter takes longer than the first filter, but eliminates an
enormous percentage of false-positives picked up by the broadband filter.
(vii) Hardware Low Pass Filter – Gain setting
Example: s1_hwlpf_gain
'3'
The incoming audio signal is amplified, in hardware, by a dedicated audio chip – one for each of the
two audio channels. The chip can amplify the audio, and also adds an all-important low-pass filter to
prevent audio-aliasing. This parameter adjusts the audio gain – much higher than 5 will likely to lead
to a degree of audio clipping, but once again some experimentation is required. Values accepted are
1 – 15.
(viii) Hardware Low Pass Filter – Break Frequency Setting
Example: s1_hwlpf_brkpnt
'40'
Once again part of the hardware audio chip, this determines the breakpoint of the low-pass filter in
KHz. Once implemented, higher frequencies than this are attenuated – as such, this should typically
be set to the frequency of interest. Values between 10 to 150KHz are accepted, but must be
rounded to the nearest 10.
(ix)
ENABLE/DISABLE FLAGS
These all-important flags control which sensors are enabled for use. Possible values are 1 (enabled)
or 0 (disabled). Note: At the time of writing, the software for the internal temperature measurement
(which uses a temperature sensor physically integrated inside the main processor) is known to
contain bugs and cause problems with the rest of the device’s normal operations. It should – for now
– not be enabled.
University of York 21
Speckled Bush Cricket Data Logger - Project Report
gps_en
'1'
GPS Module
batt_read_en
'1'
Battery Level Sensor
intern_temp_en
'0'
Internal (Processor) Temperature
s1_sensor_en
'1'
Light, Temperature & Humidity, Sensor 1
s1_mic_en
'1'
Microphone, Sensor 1
s2_sensor_en
'1'
Light, Temperature & Humidity, Sensor 2
s2_mic_en
'1'
Microphone, Sensor 2
II)
Data Output
Data is written to the card in the form of a comma-separated value (CSV) text file, with a .txt
extension. The data is stored inside a single DATA directory on the card, and a new data file is
created each time the device enters MONITORING MODE. If there is no DATA folder on the card, one
is created with the naming convention D#_DATA, where # is the Device ID. A file is then created
inside the data folder for writing data to, with the naming convention D#_RUN[XXX].txt, where # is
the Device ID and XXX is the Run Instance. If the GPS is enabled and was able to establish a signal
lock1, the newly created data file will have a correct "date created" timestamp that may be viewed in
the file's properties in most operating systems. This may be useful when organising data files at a
later data. Note that if the GPS is disabled or could not establish a signal lock, the "date created"
field will be empty.
Data files should be loaded into a data-management program such as Microsoft Excel, using a CSV
importer. With this importer, Excel asks about the nature of the file; the data is in the delimited
format, with tabs and commas both being used as the delimiters. When importing into Excel using
the CSV importer, ensure that the “treat consecutive delimiters as one” checkbox is un-ticked.
1
The GPS doesn't need to have a signal at the point MONITORING MODE is started, only at some
point during STANDBY MODE, so that the real-time clock can be set at a note made of the location.
University of York 22
Speckled Bush Cricket Data Logger - Project Report
An example data import is shown below:
D5_RUN[023].txt
Update interval:
2 Minutes
Start date:
01.12.13
Start time:
15:52:34
Latitude:
N 53°56.7429'
Longitude:
W 001°03.2154'
Sensor 1:
LPF Gain:
3
LPF Rolloff:
40 kHz
Photodiode Mode:
1
Sensor 2:
LPF Gain:
3
LPF Rolloff:
40 kHz
Photodiode Mode:
1
Enable flags:
GPS device:
1
Battery Sensor:
1
Internal Temperature:
0
S1 Sensors:
1
S1 Microphone:
1
S2 Sensors:
1
S2 Microphone
1
RUNTIME(mins)
0
2
4
6
8
10
12
14
16
18
20
22
24
26
TIME
15:52:34
15:54:34
15:56:34
15:58:34
16:00:34
16:02:34
16:04:34
16:06:34
16:08:34
16:10:34
16:12:34
16:14:34
16:16:34
16:18:34
3.2.
INT S1 CLICK S1 S1 BRDBND
S1
S1 IR
S1
S1
S2 CLICK S2 S2 BRDBND
S2
S2 IR
S2
S2
DATE BATT(V) TEMP(C) DETECT CLICKS CLICKS LIGHT(Lux) LIGHT(Lux) TEMP(C) HUMID(%) DETECT CLICKS CLICKS LIGHT(Lux) LIGHT(Lux) TEMP(C) HUMID(%)
01.12.13
13.1
0
0
0
0
13.3
2.9
24.48
40.36
0
0
0
14.3
3.8
24.53
39.62
01.12.13
13.2
0
0
0
0
13.3
2.9
24.48
40.33
0
0
1
14.3
3.8
24.53
39.59
01.12.13
13.2
0
0
5
127
13.3
2.9
24.47
40.29
0
4
203
14.3
3.8
24.44
39.78
01.12.13
13.2
0
0
12
244
13.3
2.9
24.46
40.29
0
12
158
14.3
3.8
24.43
39.72
01.12.13
13.2
0
0
7
154
13.3
2.9
24.45
40.29
0
2
185
14.3
3.8
24.43
39.72
01.12.13
13.2
0
0
1
11
13.3
2.9
24.46
40.29
0
1
21
14.3
3.8
24.43
39.68
01.12.13
13.2
0
0
0
2
12.4
2.9
24.46
40.33
0
0
0
14.3
3.8
24.45
39.72
01.12.13
13.2
0
0
0
0
13.3
2.9
24.46
40.29
0
0
1
14.3
3.8
24.46
39.68
01.12.13
13.2
0
0
0
3
13.3
2.9
24.46
40.29
0
0
0
14.3
3.8
24.47
39.65
01.12.13
13.2
0
0
0
0
13.3
2.9
24.46
40.29
0
0
0
14.3
3.8
24.47
39.62
01.12.13
13.2
0
0
0
0
12.4
2.9
24.46
40.29
0
0
2
14.3
3.8
24.46
39.62
01.12.13
13.2
0
0
0
1
11.4
2.9
24.46
40.33
0
0
0
13.3
2.9
24.47
39.59
01.12.13
13.2
0
0
0
0
9.5
2.9
24.45
40.29
0
0
5
12.4
3.8
24.47
39.65
01.12.13
13.2
0
0
0
11
10.5
2.9
24.44
40.46
0
0
7
13.3
3.8
24.47
39.65
Attaching & Detaching Sensors
The sensors are mated with a box by simply
pressing the plug of a sensor firmly into a box
socket, ensuring that the white arrow of the plug
aligns with the white arrow of the receiving
socket. An audible click indicates a secure, lockedin connection. To disconnect the sensor, gently
pull the outer-sheath of the connector (marked
with a white arrow) away from the box, which will
disengage the lock and allow the plug to be
removed from the socket. To ensure the longevity
and waterproofing of the plug and socket, care
should be taken to keep the rubber seals and
contacts in both clear of debris and contaminants, particular immediately following field use.
3.3.
Opening & Closing the Lid
University of York 23
Speckled Bush Cricket Data Logger - Project Report
To access the battery, SD card, fuse and other parts
of the device, the transparent lid should be
unscrewed at each corner using a Phillips
screwdriver. Note that the screws needn't be fully
removed from the lid as they are held in place by
design, for convenience. The reverse procedure
applies when attaching the lid; use a reasonably
firm force when doing up the screws to ensure a
tight waterproof seal. Always take a moment when
re-attaching the lid after field-use to make sure
debris such as soil and dirt isn't present on the
rubber seal, and that the lid is correctly aligned to
the box. In our field tests, we found dirt
occasionally attached to the seal after being in a
field for a time, and it increased the risk of water leaking in.
3.4.
Battery Charging
Charge the batteries using the provided "Fully Automatic Battery Charger". The procedure is very
simple - attach black and red terminal clips to their respective terminals with the charger turned off,
attaching the black terminal first. Turn on the charger with the switch on the right hand side.
Depending on the level of discharge of the battery, charging can take anywhere from 3 - 15 hours.
Because lead-acid batteries are extremely robust, there is no need to worry about over-charging the charger will automatically stop charging when the batteries are full, and will then "float charge"
the batteries, i.e. it will hold them at their full charge level without over-charging them. Charge
levels are indicated by the LEDs in the chargers, and all LEDs will flicker on and off rapidly when the
battery is fully charged. Turn off the charger before detaching the charging leads.
3.5.
Battery Installation
To install a battery into a device, remove the lid
and gently drop the battery into place, ensuring
that the battery terminals are on the same side
of the box as the SD card and GPS module.
Double check to make sure the battery is sitting
flat on the bottom of the box and hasn't gone in
at an awkward angle, as this will prevent the lid
from being reattached. With the battery in place,
attach the black lead to the black terminal first,
using a firm pressure, and 'wiggling' it on if
necessary; the connection is deliberately a tight
fit. Once the black lead is attached, do the same
for the red lead and the red terminal, first
ensuring that the POWER jumper is set to OFF
(see 'jumpers' for further detail). Always take
great care to attach wires in the correct order and in the correct polarity. Attaching a red lead to a
black terminal or vice versa will result in irreparable device failure.
University of York 24
Speckled Bush Cricket Data Logger - Project Report
3.6.
Turn-On Procedure
Once a battery has been installed, power to the device is regulated by "jumpers" (these consist of
two metal pins protruding from the circuit board, and they work like an ordinary switch. A
connection is made by shorting both sides together using a plastic/metal bridge known as a
'jumper'). Most of the jumpers have been set to a default configuration for normal use, and should
not be changed under normal circumstances. The exception to this is the POWER jumper, which is
red and located in the very top-left of the main circuit board, which is used as an ON/OFF switch
when a battery is attached.
Set the red POWER jumper to ON to turn on the device. Note that it will automatically boot into
SLEEP MODE when power is supplied, as indicated by the familiar NHM logo displayed in the center
of the LCD screen. Press the CONTROL button to wake the device from SLEEP MODE and begin
normal use.
3.7.
Device Operation
I)
STANDBY MODE
When the device is started it will first attempt to read the configuration files on the SD card to
establish parameters such as its Device ID, Run # and a list of user-configuration values such as
which sensors to use. If the read is OK, it will run through a series of start-up checks to establish
communication with the desired sensors (e.g. GPS) and then enter STANDBY MODE. Observe any
warning messages and comments that appear on the screen during start up; if the SD card is not
inserted, the syntax of parameters within the configuration file is wrong or the system cannot find a
configuration file in the correct directory, it will
report that there has been an SD-related failure
and display the associated error ID. It will them
automatically re-enter SLEEP MODE.
At the completion of the start-up checks, a
"home screen" message will be displayed,
denoted by the NHM logo on the left hand side
of the display, indicating the overall status of
the device. The status is also indicated on the LEDs, as depicted below.
(i)
"PERIPHERALS ALL READY"
All desired peripherals have started OK. If GPS is active, it has a signal lock. If sensors are active,
they're established as working and OK. A solid green LED will be lit exclusively on the board.
(ii)
"PERIPHERALS NOT READY"
All desired peripherals appear to be working, but have no finished starting. The GPS may be trying to
acquire a signal, or one or more sensors may be still starting. A solid orange LED will be lit exclusively
on the board.
(iii)
"A PERIPHERAL HAS FAILED"
At least one peripheral has failed to function as expected. This may happen for example if a sensor
device has malfunctioned. A solid red LED will be lit exclusively on the board.
University of York 25
Speckled Bush Cricket Data Logger - Project Report
More information can be displayed about device parameters and about each sensor by tapping the
CONTROL button to scroll through screens. The order messages are displayed in is outlined below:
1. Device Status Summary
An instantaneous overview of the device status, as described above. Characteristically
identifiable by the NHM logo on the left hand side.
2. Device Configuration Summary
A compact summary of the device’s ID (DEV#), the run instance number (RUN#) and the userspecified monitoring interval (I).
3. Real Time Clock
The current time and date – note that this will only display correctly if the GPS is enabled and
has found a signal at least once during runtime.
4. Battery Level
The current battery level, both in volts and as a percentage. The low-threshold for “0%” is
specified in the user configuration file on the SD card. Recall also that the device will shutdown automatically if it reaches 0% in MONITORING MODE.
5. Core Processor Temperature
Temperature reading from the processors internal temperature sensor.
6. Sensor 1 Temperature & Humidity Readings
Displays the current temperature reading in centigrade, and relative humidity as a
percentage. Note that all sensor readings will update approximately every 3 – 5 seconds.
7. Sensor 1 Photodiode Readings
Displays the current light level reading in Lux. Normal mode (N) and Infrared Mode (IR) are
both displayed.
8. Sensor 1 Microphone Gain and Low-Pass Filter Settings
The user-assigned values for microphone gain and LPF breakpoint are displayed on this
University of York 26
Speckled Bush Cricket Data Logger - Project Report
screen, for the user to confirm that they have loaded correctly.
9. Sensor 1 Microphone Detection Threshold Settings
The user-assigned values for microphone broad and narrow band noise level thresholds are
displayed on this screen, for the user to confirm that they have loaded correctly.
10. Sensor 1 Microphone Real-Time Broad and Narrow Band Clicks
When this screen is viewed, the system starts running the audio-recognition algorithms for
the microphone in real-time. The system increments a count of broad and narrow band clicks
each time they are detected, and displays both on the screen. This tool is invaluable for
testing that the microphone is setup and working correctly.
11.
12.
13.
14.
15.
Sensor 2 Temperature & Humidity Readings
Sensor 2 Photodiode Readings
Sensor 2 Microphone Gain and Low-Pass Filter Settings
Sensor 2 Microphone Detection Threshold Settings
Sensor 2 Microphone Real-Time Broad and Narrow Band Clicks
16. GPS Signal Status
This screen indicates if the GPS has acquired a signal lock, and if so it displays the number of
visible satellites it is reading (SAT) and the estimated accuracy of the given Latitude and
Longitude coordinates (ACC), in meters.
17. GPS Date & Time
Displays the last date and time reading from the GPS module. Note that unlike the real-time
clock, this clock does not tick each second. It simply shows the timestamp of the latest data
update, which refreshes approximately once every five seconds. When a signal is acquired, it
is this timestamp that is used the set the system’s main real-time clock.
18. GPS Latitude & Longitude
Displays the system’s last known Latitudinal and Longitudinal coordinates, in the format
DDD°MM.MMMM
19. [LOOP BACK TO 1]
II)
MONITORING MODE
If all the desired sensors are attached and ready, the device is ready for full deployment. The user
can enter MONITORING MODE by holding the CONTROL button for a short time, until "RELEASE TO
START MONITORING" is displayed on the screen. This may be done at any point during STANDBY
MODE, from any screen. Release the CONTROL button to send the device into MONITORING MODE.
Note that once in MONITORING MODE, the LED ring indicating device status (green, orange or red)
will be turned off to save power.
University of York 27
Speckled Bush Cricket Data Logger - Project Report
At this point, the SD card is accessed again to find and/or create a data directory and file on the SD
card. If any of the appropriate files and folders could not be created successfully on the SD card, a
warning message will display with an error ID, and after a short pause the device will automatically
shut-down into SLEEP MODE. If there were no problems, the device will finish preparing peripherals
for monitoring and enter MONITORING MODE, indicated by a display of the NHM logo accompanied
with the message "MONITORING ENVIRONMENT”.
During MONITORING MODE, the LEDs play an important role in indicating the device's behaviour. If a
broad-band click is detected, the orange LED will flash briefly. If a narrow-band click is detected, the
green LED will flash briefly (note that a green flash will always be accompanied by an orange one,
since all narrow-band clicks will, by design, always register positively as broad-band clicks too). All
four LEDs in the LED ring will flash together periodically, approximately once every 7 seconds, to
indicate that the device is still operating successfully in MONITORING MODE.
In order for the user to easily keep track of current battery levels and monitor sensor performance,
clicking the CONTROL button during monitoring mode will pause monitoring and make the device
display a series of consecutive status messages, pausing on each for approximately 2 seconds, in the
following order:
1. Real Time Clock
2. Battery Level
3. Sensor 1 Temperature & Humidity Readings
4. Sensor 1 Photodiode Readings
5. Sensor 2 Temperature & Humidity Readings
6. Sensor 2 Photodiode Readings
Finally, the device also features an in-built low-power shutdown feature. When the battery level
drops to the user-specified threshold (stored in the configuration file on the SD card), the system will
automatically finish monitoring and enter SLEEP MODE to prevent over-discharging the battery,
which can cause damage. Note that whilst this does help reduce current consumption, the device
will still draw a fair amount of current in SLEEP MODE, and should not be allowed to stay in this
mode for more than a few days when the battery is low.
3.8.
Turn-Off Procedure
At the end of use, the device may be put into Sleep mode ( 'turned off') by holding down the
CONTROL button until the LCD shows "RELEASE TO POWER DOWN" (from STANDBY MODE) or
"RELEASE TO END MONITORING" (from MONITORING MODE); Release the button to place the
device into Sleep mode. It is essential to always shut down the device in this way before removing
power - doing so ensures that the SD card and GPS modules are shut-down correctly before their
power is removed. The abrupt removal of power during STANDBY or MONITORING MODE may cause
irreversible corruption in these modules.
University of York 28
Speckled Bush Cricket Data Logger - Project Report
The device can be shutdown using the button-hold at any time - from STANDBY MODE and from
MONITORING MODE. Note that when shutting down from STANDBY mode, it is necessary to keep
holding the button when the "RELEASE TO ENTER MONITORING MODE" message appears. After
approximately five seconds, the "RELEASE TO POWER DOWN" message will appear instead
Note that whilst the device is powered (i.e. the battery is connected and the 'power' jumper is set to
ON), the device cannot be fully 'turned off' in the conventional sense, it can only put into Sleep
mode. Even in this mode, it still draws about 30 milliamps of current from the battery, which - whilst
lower-power than normal running mode - is still sufficient to drain a full battery in a couple of weeks.
As such, the battery should always be left disconnected unless the device is, or is shortly to be, in
use.
3.9.
Reset Procedure
During normal operation, a 'hard reset', i.e. not using the CONTROL button, shouldn't be required,
as all resetting can be done by powering-down and powering-up the device using the CONTROL
button. However, in the unlikely event of a software crash, where the device is otherwise
unresponsive to user input, a reset may be necessary. A reset can be performed either by
interrupting power to the device (e.g. disconnecting the battery), or by pressing the black reset
button, approximately located in the center of the main circuit board. After a battery disconnectreconnect, the device will automatically enter sleep mode. By contrast, after a reset-button reset,
the device will immediately attempt to turn on and enter standby mode. Note that hard-reset
should only ever be used as a last-resort, as there is a risk of irreversible corruption of the SD card or
the GPS module.
3.10. Flashing new
firmware
Although the software for the
device is complete, it still has
room for expansion and further
improvement, to reduce the risk
of software bugs and to improve
the overall efficiency of the
device. At the time of writing,
further improvements are still
being made to the software, so
we have a system in place to
send you firmware updates to
load onto the device as and when
they're ready, and we'd strongly
recommend that you always
update with the latest software
that's available. The update comes in the form of a single .HEX file that we can send over email, it's
usually pretty small (<1MB). To upload to the STMicroelectronics ARM microprocessor, you'd usually
need a separate uploading device (called an 'ST LINK') - that you connect to the chip with a cable and upload code to it via USB. Fortunately, the board we're using already comes with an 'ST LINK' inbuilt, so all that's needed to upload new software is a USB cable (specifically a Mini-B cable). It's the
slightly larger of the two USB sockets on the board (the one on the opposite end from the
headphone jack).
University of York 29
Speckled Bush Cricket Data Logger - Project Report
You’ll need to install the “ST LINK UTILITY” software
onto a windows machine – found at
http://www.st.com/web/en/catalog/tools/PF258168 The installer includes all the drivers you’ll need too. For
convenience, this installer has also been included on all
the SD cards that have been shipped with the devices,
along with an accompanying user manual from
STMicroelectronics. It’s a lightweight program, and
once you’ve got it installed it should look like the image
here. Open the update we’ve sent (the .HEX file) via
FILE -> OPEN FILE. Once it’s loaded OK, plug the device
into the PC – you’ll need to disconnect and remove the
battery when you do this, and the device can take
power from the USB so can still be tested as normal.
Once you’ve got it plugged in, make sure the device
isn’t in low-power mode by pressing any button to wake it from low-power mode and put it into
STANDBY MODE. You should now be able to connect to the device through the menu TARGET ->
CONNECT in ST-LINK UTILITY. Once connected, you can simply upload using TARGET -> PROGRAM &
VERIFY. Reset the device once it’s done uploading, and you’re done.