1
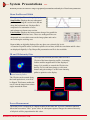
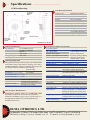
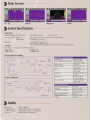
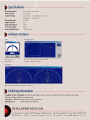
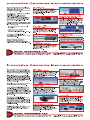
Patented Technology System Presentations (cont.) The Beam Analyzer provides a bridging technology, producing the 3D intensity reconstruction of CCD cameras, while being capable of measuring very small spots at high resolution and huge dynamic range 2D and 3D Intensity Plots The measuring technique is based on a multiple scanning knife-edge technology, combined with a tomographic image reconstruction for the creation of the 2D/3D display. When the drum spins, the knife-edges cut across the beam in an orthogonal plane to the direction of propagation. A stationary large detector inside the spinning drum measures light intensity. For attenuation, when needed, a built-in distortion free optical filter is inserted between the spinning drum and the detector. This technique provides the required attenuation without affecting beam quality. Each scanning knife-edge is oriented at a different angle on the drum and moves across the beam path in a different direction as the drum rotates. Consequently, during a single rotation of the drum, the instrument generates a set of profile curves, each representing the intensity profile of the beam from a different direction. This data is the input for the tomographic reconstruction algorithm to generate the 2D/3D intensity profile of the beam. The Beam Analyzer is offered in two types of measuring heads: The BA7 uses seven individual knife-edges, providing more accurate Filter Knife edge measurement of the true beam shape and dimensions by gathering data from all 7 scans, while the BA3 uses only three knife-edges, and is recommended for smaller beams measurement as well as for Sensor Laser Beam a near-Gaussian beams. The more knife-edges, the greater the level of detail obtained. For a beam distribution that is significantly nonGaussian the BA7 would reconstruct a plot that closely matches the Rotating drum real beam. The Projection function provides either a 2D or a 3D plot of the beam intensity profile, and is created using reconstructive tomography. The 2D contour maps and the 3D isometric plots can be displayed with or without scan axis and grids. These plots can be rotated along the beam optical axis, as well as be flipped. This feature enables the user to view the image from various angles around the beam. It is also possible to control the 3D plot wire density. Data about the beam size and centroid position is displayed digitally along with centroid and beam size data. 2D Plot 3D Plot Power Measurement The beam power can be displayed either as a digital readout, or as a bar-type display or in combination with an analog needle. Power presentation units can be chosen as mW, µW or dBm. The user can offset the zero to deactivate the ambient light suppression. Pre-defined filter transmission files can be selected. A test range can be defined and displayed to monitor beam power within specific limits, audio alarms are optional. System Presentations Beam Analyzer provides an extensive range of graphical presentations and analysis of laser beam parameters. Beam Position and Ellipticity Beam Profiles and Width The beam centroid position is continuously monitored relative to the center of the sensor area in real-time, along with beam shape, ellipticity (major and minor axes) and angular orientation. A zoom function is available for viewing the footprint of small beams more clearly. Observing beam position stability versus time is available upon setting up of the Chart function to monitor beam position at the selected clip level. Beam Analyzer control software simultaneously displays two profiles from two orthogonal knife-edges, or show each profile individually for greater visual detail. These main profiles, located at 45 degrees from the base of the head, are called V and W. Beam widths are digitally displayed for any three user selected clip levels, with up to 0.1µm resolution. The beam profile displays are auto-scaled (optional) to maximize on-screen detail and resolution. Added detail can be obtained in a special high-resolution mode. A Gaussian fit profile can be overlaid on profiles in real time, while the correlation and fit values are displayed digitally. Zoom function automatically increases the displayed spatial resolution. Chart mode It is frequently necessary to monitor the Beam Width (or alternatively Beam Position) as a function of time. In Chart Mode, these parameters can be viewed in strip chart format, showing long term time-dependent stability or drift. The measured data can be viewed on screen, saved or printed for further analysis. Beam Analyzer by DUMA OPTRONICS LTD. More Software Features - Pass/Fail testing can be performed on measured results for acceptance within specific tolerances. - Data logging to a Text file or to Excel file - Live Snapshot files replay for complete analysis of results - Average setting, Zooming - TCP/IP communication protocol and remote control - Data transmission via RS-232 link to another computer - Slave Mode controlling the measurements upon request - Screen images can be saved as BMP/JPG files or printed out - ActiveX software for integration in users application program Beam Analyzer by DUMA OPTRONICS LTD.