1
DPO7000C Series Datasheet - DPO7000C Series
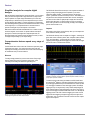
Finding the right characteristic of a complex signal can require hours of
collecting and sorting through thousands of acquisitions for the event of
interest. Defining a trigger that isolates the desired event and shows data
only when the event occurs speeds up this process. The optional Visual
Trigger makes the identification of the desired waveform events quick and
easy by scanning through all waveform acquisitions and comparing them to
on-screen areas (geometric shapes).
With up to a 500 M point record length, you can capture many events of
interest, even thousands of serial packets, in a single acquisition for further
analysis while maintaining high resolution to zoom in on fine signal details.
Investigate multiple segments of your waveform capture simultaneously with
MultiView Zoom™ to quickly compare events in real time. FastFrame™
Segmented Memory mode enables you to make efficient use of large
records by capturing many trigger events in a single record eliminating large
time gaps between events of interest. View and measure the segments
individually or as an overlay.
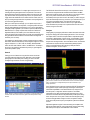
From triggering on specific packet content to automatic decode in multiple
data formats, the DPO7000C Series provides integrated support for a broad
range of serial buses – I2C, SPI, CAN, LIN, FlexRay, RS-232/422/485/
UART, MIL-STD-1553, Ethernet, USB 2.0, and MIPI D-PHY. The ability to
decode up to 16 serial buses simultaneously means you gain insight into
system-level problems quickly.
The DPO7000C Series offers the industry's most comprehensive search
and waveform navigation with the standard Advanced Search and Mark
feature and front-panel controls. User marks allow you to mark any location
that you may want to reference later for further investigation. Or,
automatically search your entire record for the criteria you define. Along the
way it will automatically mark every occurrence of your defined event so you
can quickly move between events. The advanced search and mark
capability of the DPO7000C Series can search for up to eight different
events simultaneously and stop a live acquisition when it finds an event of
interest, saving even more time.
Analyze
Verifying that your prototype's performance matches simulations and meets
the project's design goals requires analyzing its behavior. Tasks can range
from simple checks of rise times and pulse widths to sophisticated power
loss analysis, characterization of system clocks, and investigation of noise
sources. The DPO7000C Series offers a comprehensive set of integrated
analysis tools including waveform- and screen-based cursors, 53 automated
measurements, advanced waveform math including arbitrary equation
editing, custom MATLAB and .NET math plug-in analysis functions,
waveform histograms, and FFT analysis.
Search
Finding your event of interest in a long waveform record can be time
consuming without the right search tools. With today's record lengths
pushing beyond a million data points, locating your event can mean
scrolling through thousands of screens of signal activity.
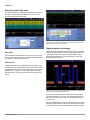
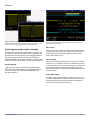
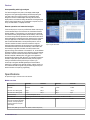
Analyze – Waveform histogram of a falling edge showing the distribution of edge position
(jitter) over time. Included are numeric measurements made on the waveform histogram
data. A comprehensive set of integrated analysis tools speeds verification of your
design's performance.
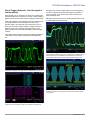
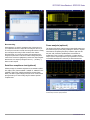
Search – Results of an advanced search for a runt pulse or a narrow glitch within a long
waveform record. Each instance of the runt or glitch is automatically marked for easy
reference.
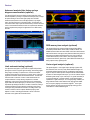
Every DPO7000C Series oscilloscope includes the DPOJET Essentials jitter
and eye pattern analysis software package, extending the oscilloscope's
measurement capabilities to make measurements over contiguous clock
and data cycles in a single-shot real-time acquisition. This enables
measurement of key jitter and timing analysis parameters such as Time
Interval Error and Phase Noise to help characterize possible system timing
issues. Analysis tools such as plots for time trends and histograms quickly
show how timing parameters change over time, and spectrum analysis
quickly shows the precise frequency and amplitude of jitter and modulation
sources.
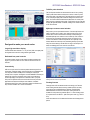
Specialized application support for serial bus debug and compliance test,
jitter and eye pattern analysis, power supply design, limit and mask testing,
DDR memory bus analysis, and wideband RF is also available.
www.tektronix.com 3