1
18
amount of time required, if we distribute the systematic search
to all world inhabitants, would be 88 years .
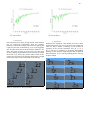
Table 6: Experiment 1 - Best performance
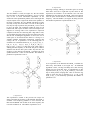
Figure 45: CPG Model 4
Observing Table 6, we see that the robot moves hardly
forward, like it was swimming on the ground. The gait
obtained is not similar to what a real dog does. Nevertheless,
it is safe to assume the optimization could be more successful
doing hypothesis on the coupling. That way, the cardinality of
the problem could be decreased.
f) Experiment 6
Keeping the same hypothesis as in experiment 5, the pairs of
oscillators (F_L_1, F_R_1) and (B_R_1, B_L_1) have now
their own set of optimized parameters. The same model is used
(see Figure 45). Since the front and back top leg oscillator are
unpaired, the number of parameters is 24.
4) Results and discussion
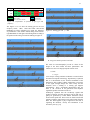
The thumbnails showing the best performance obtained so far
within the context of a given experiment are order from left to
right and top to bottom. These one were generated over a
sequence of approximatively 5 seconds. The aim of these
sequence is too visualize the way the robot moves.
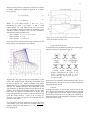
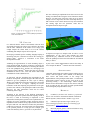
As we can see in the plots depicted in the subsection specific
to each experiments, a maximum of 240 iterations for the PSO
seems to be a value allowing to converge toward a solution.
Indeed, due to the random initialization of the 50 particles of
the swarm, the first iterations give wrong performance and
then, as the number of iterations increased, the performance
increases until it reached an asymptotic limit. The performance
for all experiments oscillated between approximatively 7 and
17.
a) Experiment 1
Optimized a function having 64 parameters is quite a
challenge, using a systematic search the cardinality of the
space would have been 264 which implies approximatively
19
1.84∗10 sets of possible parameters. A way to distribute
such a simulation, doing a systematic search, could be to ask
each inhabitants of the world[25] to run 2.78∗10 9
evaluations. Then, considering each one of them has a
computer able to run the simulation 32 times faster. The
Figure 46: Experiment 1 - Plot
performance over 240 iterations.
of
PSO
b) Experiment 2
Compared to the experiment 1, the cardinality of the problem
is divided by two. Doing the same analogy about the number
of world inhabitants, each one of them would have to run only
one simulation for less than a seconds.
Observing Table 7, we can see the dog is “walking” backward.
Since the control unit of the robot is heavy compared to the
rest of the body, this one being located toward the torso, a
backward gait could be a possible solution to overcome the
stability problem. That hypothesis seems to be suitable to
justify the behavior observed.










![車内用遮光カーテンの吸盤による収れん火災[PDF形式]](http://vs1.manualzilla.com/store/data/006579377_2-768baee3d855017d186cabe94961eeb4-150x150.png)