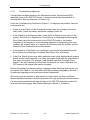
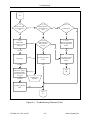
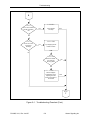
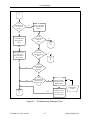
1
Diagnostics
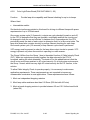
6.3.3.
Error Queue
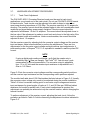
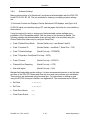
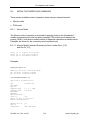
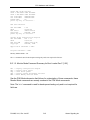
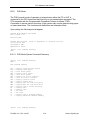
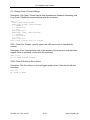
The error queue can be accessed with the RS-232 Interface Port. Use the DEQ
command to display the entire Error Queue. Use the CEQ command to clear the Error
Queue.
6.3.4.
Event Queue
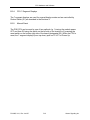
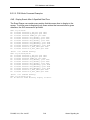
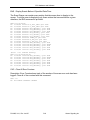
The Event Queue can be a useful diagnostic tool in addition to the Error Queue. The
Event Queue stores a log of system events and can be used to investigate changes to
system parameters over time. For example, when a lamp is turned on or a track circuit
becomes occupied, the date and time of the event is logged. This information, along
with the comparison of timestamps with the Error Queue, can be valuable. Use the DVQ
command to display the Event Queue.
6.4.
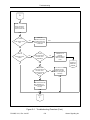
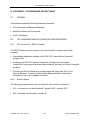
INTERRUPTING A RESET LOOP
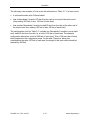
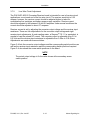
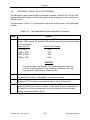
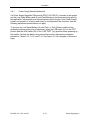
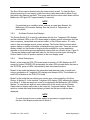
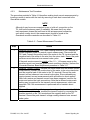
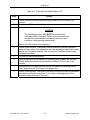
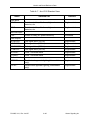
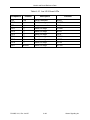
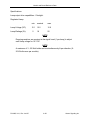
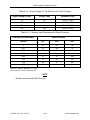
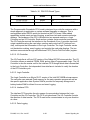
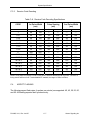
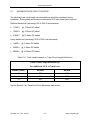
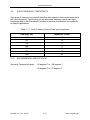
Two methods are available for interrupting a reset loop in order to access the system
diagnostics and enter Monitor mode. The preferred method is to connect a PC to the
PGK CPU serial port and enter Monitor Mode as described in Table 6–1. The second
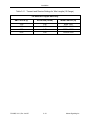
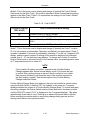
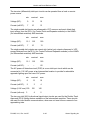
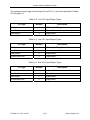
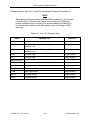
method that should be used with extreme caution is to remove the Watchdog jumper as
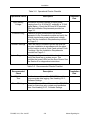
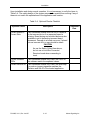
described in Table 6–2.
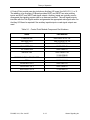
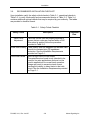
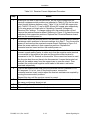
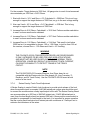
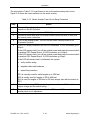
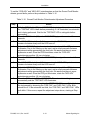
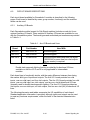
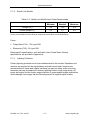
Table 6–1. Enter Monitor Mode With a PC
Step
Action
1
Leave the Watchdog jumper in and connect a null modem DB9 serial cable
from the laptop to the CPU.
2
Run a terminal emulation program at 1200 bps, 8-None-1. See Appendix B
for more details on connecting to the serial port.
3
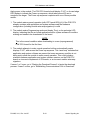
As the CPU goes through the repeated Startup Sequence, the terminal
displays “Press <Enter> now to enter Monitor Mode”
Press the <Enter> key and the Monitor Mode prompt is displayed (MON>).
Then the DEQ and CEQ commands are available to display and clear the
Error Queue, respectively. Note that the Event Queue is not available in
Monitor Mode.
P2160B, Vol.1, Rev. Jan/07
6–6
Alstom Signaling Inc.