1
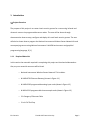
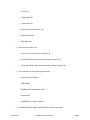
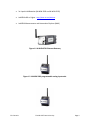
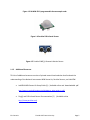
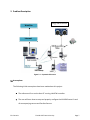
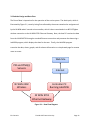
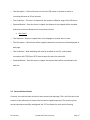
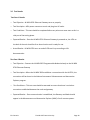
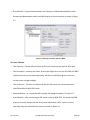
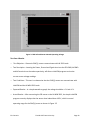
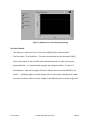
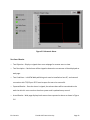
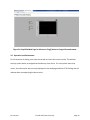
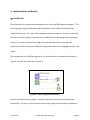
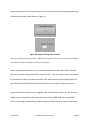
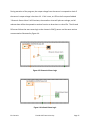
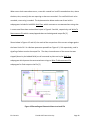
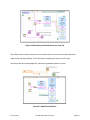
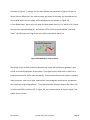
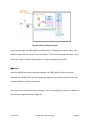
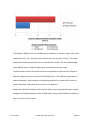
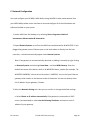
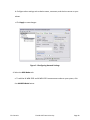
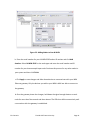
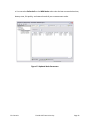
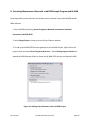
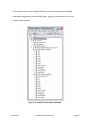
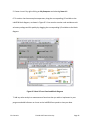
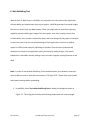
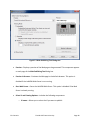
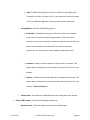
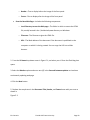
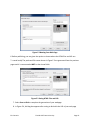
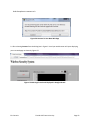
Wireless Network Security System Programmed in LabVIEW Eric Carestia Dr. Janusz Zalewski CEN 4931 Spring 2011 – Independent Study Florida Gulf Coast University Ft. Myers, Florida April 2011 Eric Carestia Florida Gulf Coast University Page 1 1. Introduction Project Overview The purpose of this project is to create a basic security system for a room using infrared and ultrasonic sensors via programmable sensor nodes. The user will be shown through documentation how to setup, configure and deploy this small scale security system. The user will also be shown how to program the National Instruments Wireless Starter Network Kit and accompanying sensors using National Instruments' LabVIEW environment and graphical programming language, G [1]. 1.1.1 Required Materials In this section the materials required in completing this project are listed and elaborated on. Also, any non‐essential resources will be listed. o National Instruments Wireless Starter Network. This includes: o NI‐WSN‐9791 Ethernet Gateway (shown in Figure 1.1 ) o NI‐WSN‐3202 programmable analog input node (shown in Figure 1.2) o NI WSN‐3212 programmable thermocouple node (shown in Figure 1.3) o 3‐ft Category 6 Ethernet Cable o 3 inch PVC End Cap. Eric Carestia Florida Gulf Coast University Page 2 o ¼’ x 3 inch . o ¼’ Washers (x3). o ¼’ Hex nuts (x3). o 18 inch section of wood (2’ x 4’). o Removable Silicon. o 8 AA Batteries. Sensors from Parallax, Inc. o Parallax PIR Sensor (shown in Figure 1.4) o Parallax PING))) Ultrasonic Sensor (shown in Figure 1.5) o 2x Parallax 10‐inch 3‐pin extension cords (shown in Figure 1.6) Host Computer with the following specifications o Intel Core Duo Processor o 1GB of RAM o Windows XP Professional / Vista / 7 o Ethernet NIC o LabVIEW 8.6 or higher installed Standard AC Power Supply (NI‐WSN‐9791 Ethernet Controller) Eric Carestia Florida Gulf Coast University Page 3 2x 4‐pack AAA Batteries (NI‐WSN‐3202 and NI‐WSN‐3212) LabVIEW v8.6 or higher. Http://www.ni.com/labview LabVIEW Measurements and Automation Explorer (MAX) Figure 1.1 NI‐WSN‐9791 Ethernet Gateway Figure 1.2 NI‐WSN‐3202 programmable analog input node. Eric Carestia Florida Gulf Coast University Page 4 Figure 1.3 NI‐WSN‐3212 programmable thermocouple node. Figure 1.4 Parallax PIR Infrared Sensor. Figure 1.5 Parallax PING))) Ultrasonic Motion Sensor. 1.1.2 Additional Resources This list of additional resources consists of printed material and websites that furthered the understanding of the National Instruments WSN Starter kit, Parallax Sensors, and LabVIEW. LabVIEW WSN Starter Kit Setup Guide [1] ( Available online and downloadable .pdf http://www.ni.com/pdf/products/us/350909A‐01_WSN_guide_lr.pdf ) Ping))) and PIR Infrared Sensor Documentation [2] ( Available online http://www.parallax.com) Eric Carestia Florida Gulf Coast University Page 5 Bishop, Robert [3]. LabVIEW 8 Student Edition. [3] 2007 Pearson /Prentice Hall Publishing, Upper Saddle River ISBN: 0131999184 Eric Carestia Florida Gulf Coast University Page 6 2. Problem Description Web Site Ping))) and PIR Sensors Internet Figure 2.1 – System Architecture Assumptions The following initial assumptions have been made about this project: The software will run on the Host PC running LabVIEW controller. The user will learn how to setup and properly configure the NI WSN Starter Kit and all accompanying sensors and Parallax Sensors. Eric Carestia Florida Gulf Coast University Page 7 The user will understand the functionality of the software and be able to use it based on documentation. There will be no need to reprogram the sensors once the program has been loaded and is running. The program will work correctly each time it is ran. Specific Requirements The intended sequence of operations should follow: o Turn Host PC on. o Turn NI‐WSN‐9791 and all sensors on. o Assure network connectivity for NI‐WSN‐9791 o Open LabVIEW on the Host PC. o Run the software. o The software will send alerts when the alarm is triggered to a simple web page for remote users to view. o User terminates the running VI software. o The user must have access to an internet connection that can accept connections on TCP/IP port 3537 (default web communication port of LabVIEW). Eric Carestia Florida Gulf Coast University Page 8 Interface Requirements The following assumptions have been made regarding the system’s user interface: GUI to display data in LabVIEW. The user interface of the web page will be the same as the LabVIEW GUI on the host PC. Physical Environment Requirements The following assumptions have been made about the physical operating environment of this system: The software will be run in LabVIEW, which will be run on the Host PC. As long as the host PC is plugged in to a power source and the sensors have adequate battery power, the software can be run. Ambient temperature for the NI‐WSN Nodes shall not be greater than 70 ⁰C and not less than ‐40 ⁰C [1]. Voltage to both PIR and PING))) sensors shall not exceed 6 V [2]. Users and Human Factors Requirements The following assumptions have been made regarding the software’s user and human factors: Eric Carestia Florida Gulf Coast University Page 9 The types of users that will utilize this software will be those interested in a small security system for a given room. Users must have basic computer knowledge (e.g. Dragging and Dropping, File Folder Navigation, etc.) in a Microsoft Windows XP/Vista/7 environment. Users must know how to read and comprehend the English language. Users must be able to follow simple instructions. Documentation Requirements The following documentation will be provided to end users: There will be a set of instructions printed for the user to setup the NI‐WSN Starter Kit, Parallax sensors, and the software. These will be in Basic English instructions that instruct users how to use the software. Data Requirements The following assumptions have been made regarding the data gathered and produced from this software: The data will be collected from NI‐WSN nodes and Parallax sensors and are available for display on the Host‐PC and web page. LabVIEW, LabVIEW VI software will be stored locally on the Host‐PC. Eric Carestia Florida Gulf Coast University Page 10 3. Solution Plan. 3.1 Solution Plan Details The plan for creating a solution to the problem described in Section 2.1 is a three phase plan of action, as follows: Phase 1 – Since there is no previous knowledge of how the National Instruments Wireless Starter Kit is programmed, the instructions from National Instruments will be followed in order to get the device working properly. A simple demo program will be created and executed and tested to make sure that the unit is functioning as described. Once this is accomplished, Phase 2 will begin. Phase 2 –The WSN Starter Kit Security System will be planned out using diagrams before any code is developed. Once this is finished, the development of the LabVIEW code that will produce the security system will start. Once the code has been created it will be loaded into the controller PC and Phase 3 will begin. Phase 2 is discussed in greater detail in the Section 3.2 (Solution Design). Phase 3 – After the LabVIEW program has been written and loaded successfully into the controller PC, testing will begin. The testing plan will be developed and then each individual test that needs to be run to achieve the will be ran in sequential order to ensure that the security system is working properly. The test plan will be updated in the case that there are problems that arise during the testing phase. Phase 3 will be discussed in more detail in the Section 3.2 (Solution Design). Eric Carestia Florida Gulf Coast University Page 11 3.2 Solution Design and Data Flow The flow of data is imperative for the operation of the entire system. The data’s path, which is illustrated by Figure 3.1, starts by being first collected by the sensors attached to and governed by the NI‐WSN nodes’ internal microcontroller, which is then transmitted via an 802.15 Zigbee wireless connection to the NI‐WSN 9791 Ethernet Gateway. Next, the host PC receives the data from the NI‐WSN 9791 through a standard Ethernet connection and processes the data using a LabVIEW program, which displays the data for the user. Finally, the LabVIEW program transmits the data, charts, graphs, and all relevant information to a simple web page for remote users to access. Web Site PIR and PING))) Sensors Internet NI WSN 3202 Wireless Controller PC Running LabVIEW NI WSN 9791 Ethernet Gateway Figure 3.1 – Data Flow Diagram Eric Carestia Florida Gulf Coast University Page 12 3.2 Pseudo Code of Solution The program’s operation should follow the sequence of actions shown in the pseudocode in Figure 3.2 1. While ( user hasn’t terminated the program) a. Case (infrared alarm is tripped) i. Activate ‘Infrared Alarm Tripped’ LED on Web page front panel. ii. Activate ‘Infrared Alarm Tripped’ LEDs on LabVIEW front panel. iii. Write date‐time of alarm to local file on host PC b. Case (Ultrasonic Alarm is tripped) i. Activate ‘Ultrasonic Alarm Tripped’ LED on Web page front panel ii. Activate ‘Ultrasonic Alarm Tripped’ LED on LabVIEW front panel. iii. Write date‐time of alarm to local file on host PC. c. Case (The node with sensors has low battery power) i. Activate ‘Low Node Power’ LED on Web page front panel. ii. Activate ‘Low Node Power’ LED on LabVIEW front panel. d. Case (There is poor signal quality between node and gateway) i. Display “Poor Link Quality” LED on Web page front panel. ii. Display “Poor Link Quality” LED on LabVIEW front panel. Figure 3.2 Pseudocode of Program Operation Eric Carestia Florida Gulf Coast University Page 13 3.3 Test Plan 3.3.1 Description of Test Environment The test environment will be the Host PC running LabVIEW. The Host PC will be loaded with the security system virtual instrument and will be started to ensure the security system executes properly. The test environment will simulate the environment in which the software will ultimately operate on. 3.3.2 Stopping Criteria If an error occurs during any test case, the testing phase will continue until the security system performs correctly. The subsequent result of the test will then be recorded and documented accordingly. The test result documentation will be updated for every iteration of the test phase. If the error occurs during the security system’s operation, the above will be executed and will return to development phase in order to ensure that the LabVIEW code operates according to design specifications. The system will be deemed complete when each and all test phase can be completed with zero errors. Once this happens, the documentation will be updated with the final test results and the system can then be demonstrated. Eric Carestia Florida Gulf Coast University Page 14 3.3.3 Description of Individual Test Cases Test Case 1 o Test Objective – NI WSN 9791 Ethernet Gateway turns on properly. o Test Description –Affix power connector to unit and plug into AC outlet. o Test Conditions – This test should be completed before any other test cases start as this is a vital part of the testing phase. o Expected Results – Once the NI WSN 9791 Ethernet Gateway is powered on, the LEDs on the back of the unit should be lit to show that the unit is ready for use. Test Case 2 o Test Objective – Connect the NI WSN 3202 Programmable Node wirelessly to the NI WSN 9791 Ethernet Gateway o Test Description –When the NI WSN 3202 establishes a connection with the NI 9791, the connection will be shown in the National Instruments’ Measurement and Automation Explorer program. o Test Conditions – This test case should be executed to ensure that there is a good connection between the node and gateway. o Expected Results – Once communication is established, the Gateway and Node should appear in the Measurement and Automation Explorer (MAX). Eric Carestia Florida Gulf Coast University Page 15 Test Case 3 o Test Objective – Passive Infrared Sensor (PIR) sensor communicates with NI 3202 node o Test Description –inserting the Power, Ground and Signal wires into the SEN PWR, AI0 GND and AI0 terminals on the node respectively, will allow a simple LabVIEW program to view the current sensor voltage readings. o Test Conditions – This test is to determine that the PIR sensor can communicate with LabVIEW and the NI WSN 3202 node. o Expected Results – In a simple waveform graph, the voltage should be > 0 V and <6 V. Test Case 4 o Test Objective – Ultrasonic PING))) Sensor communicates with the NI 3202 node. o Test Description – inserting the Power, Ground and Signal wires into the SEN PWR, AI0 GND and AI0 terminals on the node respectively will activate the activity LED on the PING))) sensor and pulse. o Test Conditions –Test is designed to determine that the PING))) sensor can communicate with LabVIEW and the NI WSN 3202 node. o Expected Results – The ‘Activity’ LED on the PING))) sensor pulses. Test Case 5 o Test Objective – PIR Alarm is tripped. Eric Carestia Florida Gulf Coast University Page 16 o Test Description – Tester will move in front of the PIR sensor to activate an alarm at increasing distances of 10 cm intervals. o Test Conditions – This test is to determine the maximum effective range of the PIR Sensor. o Expected Results – Once the alarm is tripped, the distance it was tripped will be recorded and move to the next distance until a maximum is found. Test Case 6 o Test Objective – Display a tripped alarm on a webpage for remote users to view. o Test Description – Both alarms will be tripped to determine correctness of data displayed on web page. o Test Conditions – Web publishing tool must be installed on host PC, and network connection with TCP/IP port 3537 must be open for test to be successful. o Expected Results – Once the alarm is tripped, the relevant data will be transmitted to the web site. 3.4 Current Solution Results Currently, the code has been written for both sensors and web page. This is the final step in the creation of the software as it shows initial and alarm tripped sequences. The security system can be executed successfully as designed. See 3.5 Test Results for each result of testing. Eric Carestia Florida Gulf Coast University Page 17 3.5 Test Results Test Case 1 Results o Test Objective – NI WSN 9791 Ethernet Gateway turns on properly. o Test Description –Affix power connector to unit and plug into AC outlet. o Test Conditions – This test should be completed before any other test cases start as this is a vital part of the testing phase. o Expected Results – Once the NI WSN 9791 Ethernet Gateway is powered on, the LEDs on the back of the unit should be lit to show that the unit is ready for use. o Actual Results – NI WSN 9791 turns on and all LEDs are lit up according to NI’s documentation. Test Case 2 Results o Test Objective – Connect the NI WSN 3202 Programmable Node wirelessly to the NI WSN 9791 Ethernet Gateway o Test Description –When the NI WSN 3202 establishes a connection with the NI 9791, the connection will be shown in the National Instruments’ Measurement and Automation Explorer program. o Test Conditions – This test case should be executed to ensure that there is a wireless connection established between the node and gateway. o Expected Results – Once communication is established, the Gateway and Node should appear in the Measurement and Automation Explorer (MAX)’s list of remote systems. Eric Carestia Florida Gulf Coast University Page 18 o Actual Results ‐ Communication between the Gateway and Node was established, both Gateway and Node appear within the MAX’s display of remote systems as shown in Figure 3.3 Figure 3.3 Gateway and Nodes appear in MAX Test Case 3 Results o Test Objective – Passive Infrared Sensor (PIR) sensor communicates with NI 3202 node o Test Description –inserting the Power, Ground and Signal wires into the SEN PWR, AI0 GND and AI0 terminals on the node respectively, will allow a LabVIEW program to view the current sensor voltage readings. o Test Conditions – This test is to determine that the PIR sensor can communicate with LabVIEW and the NI WSN 3202 node. o Expected Results – In a simple waveform graph, the voltage should be > 0 V and <6 V. o Actual Results – After connecting the PIR sensor to the NI WSN 3202, the simple LabVIEW program correctly displays that the sensor does indeed have 4.65 V, which is normal operating range for the Parallax PIR sensor as shown in figure 3.4 Eric Carestia Florida Gulf Coast University Page 19 Figure 3.5 PIR Infrared Sensor Normal Operating Voltage Test Case 4 Results o Test Objective – Ultrasonic PING))) sensor communicates with NI 3202 node o Test Description –inserting the Power, Ground and Signal wires into the SEN PWR, AI0 GND and AI0 terminals on the node respectively, will allow a LabVIEW program to view the current sensor voltage readings. o Test Conditions – This test is to determine that the PING))) sensor can communicate with LabVIEW and the NI WSN 3202 node. o Expected Results – In a simple waveform graph, the voltage should be > 0 V and <6 V. o Actual Results – After connecting the PIR sensor to the NI WSN 3202, the simple LabVIEW program correctly displays that the sensor does indeed have 4.65 V, which is normal operating range for the PING))) sensor as shown in Figure 3.5 Eric Carestia Florida Gulf Coast University Page 20 Figure 3.5 PING))) sensor’s normal operating voltage Test Case 5 Results o Test Objective – Motion in front of Ultrasonic PING))) Sensor creates an alarm. o Test Description –Test Conditions – This test is to determine that the Ultrasonic PING))) sensor can produce an alarm should motion be detected within 1 meter of the sensor.. o Expected Results – In a simple waveform graph, the voltage should be > 3 V and <6 V. Actual Results – After connecting the Ultrasonic PING))) sensor to the NI WSN 3202, the simple LabVIEW program correctly displays that the sensor does indeed have 0 V when an motion is present, which is normal voltage for the PING))) Sensor as shown in figure 3.5 Eric Carestia Florida Gulf Coast University Page 21 Figure 3.5 Ultrasonic Alarm Test Case 6 Results o Test Objective – Display a tripped alarm on a webpage for remote users to view. o Test Description – Both alarms will be tripped to determine correctness of data displayed on web page. o Test Conditions – LabVIEW Web publishing tool must be installed on host PC, and network connection with TCP/IP port 3537 must be open for test to be successful. o Expected Results – Once the alarm is tripped, the relevant data will be transmitted to the web site which is set to monitor the alarm system and is updated every second. o Actual Results – Web page displays both sensors have reported an alarm as shown in Figure 3.6. Eric Carestia Florida Gulf Coast University Page 22 Figure 3.6 Simplified Web Page for Ultrasonic Ping))) Alarm in Google Chrome Browser 3.6 Operation and Performance For all iterations of testing, each case was tested to ensure the correct results. The wireless security system works as designed each and every time of use. For every alarm event that occurs, the information was correctly displayed on the web page and host PC GUI along with all relevant data accompanying the alarm event. Eric Carestia Florida Gulf Coast University Page 23 Eric Carestia Florida Gulf Coast University Page 24 4. Implementation and Results LabVIEW Code The software for this system was developed entirely in the LabVIEW graphical language G. This type of programming has facilitated rapid development of the software and dramatically reduced coding time. The nature of this language provides an engineer, scientist, or technician who does not have training or familiarity with a traditional text‐based programming language such as C++ or Java to approach the design and implementation from a very high level perspective without the concerns traditional programmers face such as language semantics and syntax. The explanation of the LabVIEW program for this system follows the pseudocode outlined in Figure 3.2 and will be presented in that order. Figure 4.1 Loop Timing and Termination Once the user executes the program, it must be executed continuously to provide proper functionality. In Figure 4.1, the main loop of the program gives users the ability to adjust the Eric Carestia Florida Gulf Coast University Page 25 timing of execution and terminate the loop. Both of these controls are presented graphically in the front panel display shown below in Figure 4.2. Figure 4.2 Stop and Timing User Controls Note: The recommended timing of the loop is 100 milliseconds, values too low or high produce data and waveform charts that are not able to be read or are not current, respectively. Alarms are generated when the one of the sensors attached to the NI‐WSN 3202 node drive their current output voltage from 4.65 V down to 0 V [2]. Each alarm that occurs is then saved to a local text file (alarm.lvm) where the date, time, which sensor(s) were tripped Figures 4.3 and 4.4 show the PING))) Ultrasonic and PIR Infrared sensors’ logic for indicating an alarm. Implementation of the logic is very straightforward. As illustrated in Figure 4.3, the ultrasonic PING))) sensor is attached to the analog input slot on the NI‐WSN 3202 that is labeled AI0. The current voltage is plotted on a waveform chart to indicate the current state of the sensor. Eric Carestia Florida Gulf Coast University Page 26 During execution of the program, the output voltage from the sensor is compared to check if the sensor’s output voltage is less than 4 V. If this is true, an LED on the front panel labeled “Ultrasonic Sensor Alarm” will illuminate, the waveform chart will plot zero voltage, and all relevant data will be then passed to another function to be written to a local file. The infrared PIR sensor follows the exact same logic as the ultrasonic PING))) sensor and the same actions are executed as illustrated by Figure 4.4. Figure 4.3 Ultrasonic Alarm Logic Figure 4.4 Infrared Alarm Logic Eric Carestia Florida Gulf Coast University Page 27 When one or both cases above occur, a record is created in a local file named alarm.lvm, where the date, time, sensor(s) that are reporting an alarm are recorded. For each field that is to be recorded, a text string is needed. The implementation below makes use of two built‐in subprograms included in LabVIEW: Build Text, which constructs a concatenated text string that is constructed from data received from inputs in Figure 4.3 and 4.4, respectively; and Write To Measurement File which creates/appends data to the designated output file [3]. Shown below in Figures 4.5 and 4.6, the result of the comparison of the current voltage against the lower limit of 4 V is a Boolean parameter passed from Figure 4.3 / 4.4 respectively, used in signaling of when to write the output file. The date, time and name of the sensor that was tripped (shown by the labeled fields) are all converted to plain text by the Build Text subprogram which passes the constructed text strings to Write To Measurement File subprogram for final output to the file [3]. Figure 4.5 Recording an Ultrasonic Alarm to a Local File Eric Carestia Florida Gulf Coast University Page 28 Figure 4.6 Recording an Infrared Alarm to a Local File The software also monitors two parts of the system that are critical to successful operation: node power and signal quality. Since the node is powering the sensors and its own microcontroller and radio equipment, maintaining adequate power is a must. Figure 4.7 Node Power Monitor Eric Carestia Florida Gulf Coast University Page 29 As shown in Figure 4.7, the logic for this alarm follows that presented in Figures 4.3 and 4.4 where the only difference is this code monitors the power of the node, not attached sensors. The NI WSN 3202’s current voltage will be displayed on the indicator in Figure 4.8. A “Low Node Power” alarm will occur when the node power level is ≤ 4 V, which is 0.4 V above the minimum required voltage [4]. An indicator LED on the front panel labeled “Low Node Power” will illuminate and a log of this event will be recorded in alarm.lvm. Figure 4.8 Node Battery Power Indicator The quality of the wireless connection between the nodes and the Ethernet gateway is also critical to successful operation of the system. Poor signal quality could result in data loss or losing communication with a node completely. Environmental factors such indoor or outdoor node placement, clear line of sight, obstructions, electromagnetic interference, and weather can contribute to signal degradation. The stated maximum effective range of the nodes is 90 m indoors and 300 m outdoors [4]. In Figure 4.8, the implementation of the poor signal / link quality alarm is shown. Eric Carestia Florida Gulf Coast University Page 30 Figure 4.8 Poor Link Quality Alarm Using the same logic and subprograms as the ultrasonic, infrared and low power alarms, this sequence illuminates an indicator “Poor Link Quality” LED on the front panel and writes it as an alarm out to alarm.lvm when signal quality has a signal strength less than 30%. Results After the LabVIEW code was tested and complete, the PING))) and PIR sensor were each attached to the NI‐WSN 3202 node and began testing them to determine response times and maximum effective ranges of the sensors. The sensors were tested at distances starting at 1 cm in increasing 50 cm intervals to determine the maximum range illustrated in Figure 4.9 Eric Carestia Florida Gulf Coast University Page 31 The ultrasonic PING))) sensor has excellent motion detection as shown in Figure 4.9 at close ranges (distance ≤ 1 m). Detection and response times are very fast (~20 ms). This sensor performed reliably and consistently for an extended time period. The main disadvantages of the PING))) sensor is relatively high power consumption and short range. The performance of the PIR Infrared sensor was comparable in response time, but had an effective range nearly four times that of the PING))) sensor. The additional range was not without drawbacks. High humidity or low lighting conditions can cause the PIR sensor to signal a false alarm when there was no motion to be detected. Despite the individual limitations of the sensors, when correctly placed and used in tandem alongside the flexible placement of the NI‐WSN nodes, they provide an effective solution to alert of any entry into the room. Eric Carestia Florida Gulf Coast University Page 32 5. Conclusion My time studying wireless sensor networks with LabVIEW has been very exciting but it was not without its hurdles to clear. My previous experience in programming has been only in traditional languages like Java, C++ and Assembly, so the idea of rapidly creating software through ‘drag‐and‐drop’ operations was very appealing. A particular stumbling block was getting a feel for a graphical language and its’ limitations compared to a traditional language. Some unexpected obstacles cropped up, while it was exponentially easier to initiate network communication between two remote devices with G, there were simpler tasks that were exponentially harder. Casting to a different data type, string operations, and declaring / accessing arrays (even how arrays are created) were definitely frustrating and took some time to become accustomed to. Originally, the main purpose of this project was to create software and remotely access the Ethernet gateway. Unfortunately, through the course of this study, the model that was shipped (NI‐WSN 9791) is incapable of such ability. The model required to allow this type of functionality is the NI‐WSN 9792 Real‐Time Ethernet Gateway Controller. Overall, this project has been very informative and has given me exposure to programming embedded systems and sensor technologies that I was previously unfamiliar with. I would recommend a project similar to this to anyone interested in learning about wireless sensor networks and / or graphical programming. Eric Carestia Florida Gulf Coast University Page 33 6. References [1] National Instruments Corporation, Wireless Sensor Network Starter Kit User Guide, National Instruments Corporation, 2009, (http://www.ni.com/pdf/products/us/350909A‐ 01_WSN_guide_lr.pdf ) [2] Parallax, Inc., Ping))) and PIR Infrared Documentation, Feb 8, 2011 (http://www.parallax.com) [3]Bishop, Robert. LabVIEW 8 Student Edition. Pearson /Prentice Hall Publishing, 2007. ISBN: 0131999184` [4] National Instruments Corporation, Wireless Sensor Node Data Sheet (NI WSN 3202 & NI WSN 3212) , National Instruments Corporation, 2009, http://www.ni.com/pdf/products/us/cat_wsn32xx.pdf Eric Carestia Florida Gulf Coast University Page 34 Appendix‐ User Manual To create this project, the following user manual has been created. This section gives instructions for setting up LabVIEW, NI WSN Drivers, the creation of a simple program for taking measurements and using the web publishing tool. A. Installing LabVIEW 2010 LabVIEW is required to interface with the NI‐WSN nodes and develop software for them. NI wireless sensor networks (WSNs) require a host controller to communicate with the WSN Ethernet gateway. The host controller can be a PC running a Windows Vista/XP or LabVIEW Real‐Time OS host controller, such as NI CompactRIO. First follow these instructions: 1. Close all other applications running on the host controller along with any anti‐virus application to improve installation time 2. Install NI LabVIEW and NI‐WSN software, follow the on‐screen instructions, and reboot when prompted. 3. If you are using programmable WSN Measurement Nodes, also install the NI LabVIEW Wireless Sensor Network Module Pioneer, following the on‐screen instructions. With the NI LabVIEW WSN Module Pioneer, you can use graphical programming to customize the node's behavior, adding intelligence to extend battery life, increase analog and digital input performance, and interface with sensors. LabVIEW WSN applications can be downloaded over the air to NI WSN measurement nodes, allowing seamless updates to deployed nodes[1]. . Eric Carestia Florida Gulf Coast University Page 35 B. Hardware Setup This tutorial helps you set up and configure the hardware contained in the NI Wireless Sensor Network (WSN) Starter Kit. This kit contains everything needed to set up an NI wireless sensor network quickly and easily, including the following: NI WSN‐9791 Ethernet gateway NI WSN‐3202 programmable +‐10 V analog input node NI WSN‐3212 programmable thermocouple input node LabVIEW WSN Pioneer evaluation CD NI LabVIEW evaluation CD Desktop power supply and U.S. power cord for the NI WSN‐9791 Ethernet gateway Two sets of 4 AA batteries for NI WSN measurement nodes Ethernet cable Parallax Ultrasonic PING))) sensor J‐type thermocouple (2) To set up the NI WSN‐9791 Ethernet gateway, follow these steps: 1. Attach the antenna to the NI WSN‐9791. Eric Carestia Florida Gulf Coast University Page 36 2. Connect the Ethernet cable between the NI WSN‐9791 and your network router. If you are connecting directly to the gateway from your PC and your network card does not support direct connections, you need to use an Ethernet crossover cable. 3. Connect the desktop power supply to your wall outlet, and the power cord between the desktop power supply and the 2‐position power terminal on the NI WSN‐9791. 4. Check LEDs for power and status information. To set up the NI WSN measurement nodes, follow these steps: 1. Attach the antennae, 18‐position screw‐terminal connectors, and corresponding labels to the measurement nodes. 2. Connect the PING))) or PIR sensor and thermocouple to your measurement nodes. If you are not using the NI WSN Starter Kit, connect your sensors to the appropriate screw terminals on the WSN measurement nodes. a. Connect the red Signal and black GND wires from the PIR or PING))) sensor to the AI0 and AI GND screw terminals on the NI WSN‐3202 analog input node, respectively. Connect the red Power wire to the SEN PWR terminal. This sensor power channel delivers up to 12 V and 20 mA of power to drive external sensors, so you can attach the PING))) or PIR directly to the sensor node for testing. Eric Carestia Florida Gulf Coast University Page 37 b. Connect the positive wire (white insulation) of your thermocouple to the TC0+ screw terminal on the NI WSN‐3212 and the negative wire (red insulation) to the TC0‐ screw terminal. 3. Install the batteries and secure the battery compartment cover using the screwdriver. You also can use a 9 to 30 V external supply to power the measurement nodes[4]. Eric Carestia Florida Gulf Coast University Page 38 C. Network Configuration You must configure your NI WSN in MAX before using LabVIEW to take measurements from your WSN. MAX provides a user interface to view and configure all of the NI hardware and software installed on your system. 1. Launch MAX from the desktop or by selecting Start>>Programs>>National Instruments>>Measurement & Automation. 2. Expand Remote Systems to confirm that MAX has auto detected the NI WSN‐9791. If you plugged the gateway into an Ethernet port on the local subnet or directly into the host controller, it should automatically appear under Remote Systems. Note: If the gateway is not automatically detected, try adding it manually by right‐clicking on Remote Systems and selecting Create New… and then WSN Gateway. Enter the default host name of the device, which is NI‐WSN9791‐0serial_number (for example, "NI‐ WSN9791‐0140B2B1," where the serial number is 140B2B1). You can find your Ethernet gateway serial number on the bottom sticker of the device. You also can directly enter the IP address of your gateway, if known. 3. Select the Network Settings tab. Here you can confirm or change the default settings. a. Select Obtain an IP address automatically if the gateway is connected to a DHCP server (recommended) or select Use the following IP address: and enter a static IP address for your gateway. Eric Carestia Florida Gulf Coast University Page 39 b. Configure other settings such as device name, comments, and the time server on your subnet. c. Click Apply to save changes. Figure C.1 Configuring Network Settings 4. Select the WSN Nodes tab. a. To add the NI WSN‐3202 and NI WSN‐3212 measurement nodes to your system, click the Add WSN Node button. Eric Carestia Florida Gulf Coast University Page 40 Figure C.2 Adding Nodes to Your NI WSN b. Enter the serial number for your NI WSN‐3202 and an ID number and click Add Another. Select NI WSN‐3212 for the node type and enter the serial number and ID number for your thermocouple input node. Continue this process for any other nodes in your system and then click Finish. c. Click Apply to save changes and allow these devices to communicate with your WSN Ethernet gateway. Only the devices you add to your WSN in MAX are able to connect to the gateway. d. Once the gateway shows the changes, hold down the signal strength button on each node for more than five seconds and then release. The LEDs then blink consecutively until a connection with the gateway is established. Eric Carestia Florida Gulf Coast University Page 41 e. You can select Refresh all on the WSN Nodes tab to view the last communication time, battery state, link quality, and network mode of your measurement nodes. Figure C.3 Updated Node Parameters Eric Carestia Florida Gulf Coast University Page 42 D. Extracting Measurement Data with a LabVIEW Sample Program and NI‐WSN Extracting measurement data from the wireless sensor network is easy with LabVIEW and NI‐ WSN software. 1. Start LabVIEW by selecting Start>>Programs>>National Instruments>>National Instruments LabVIEW 2010. 2. Select Empty Project to bring up a new Project Explorer window. 3. To add your NI WSN‐9791 Ethernet gateway to the LabVIEW Project, right‐click on the project name and select New>>Targets and Devices… Select Existing target or device and expand the WSN Gateway folder to choose the NI WSN‐9791 that you configured in MAX. Figure D.1 Adding a New Gateway to the LabVIEW Project Eric Carestia Florida Gulf Coast University Page 43 4. The measurement nodes configured with your network are automatically added underneath the gateway in the LabVIEW Project, giving you instant access to their I/O variables and properties. Figure D.2 NI WSN Project Explorer Window Eric Carestia Florida Gulf Coast University Page 44 5. Create a host VI by right‐clicking on My Computer and selecting New>>VI. 6. To monitor the thermocouple temperature, drag the corresponding I/O variable to the LabVIEW block diagram, as shown in Figure D.3. You can also monitor node attributes such as battery voltage and link quality by dragging the corresponding I/O variables to the block diagram. Figure D.3 Host VI Front Panel and Block Diagram 7. Add any other analysis or measurement functions that you wish to implement in your program and add indicators or charts to the LabVIEW front panel to view your data. Eric Carestia Florida Gulf Coast University Page 45 8. When you are finished building your Host Controller VI, click the Run button to instantly acquire measurements from your NI wireless sensor network. Eric Carestia Florida Gulf Coast University Page 46 E. Web Publishing Tool With the built‐in Web Server in LabVIEW, you can publish the front panel of the application without adding any development time to your project. LabVIEW generates front panel images that you can access from any Web browser. Often, you might want to extend the reporting capability beyond publishing an image of the front panel, such as by creating a report that includes tables, lists, operator information, dates, and times along with the graphs and analysis on the front panel. You also can take advantage of report generation functions to publish reports in HTML format ready for publishing to the Web. These functions professionally document the results of an application quickly and easily by adding images, front panels, bulleted lists, and tables, thereby making it easy to further integrate your applications on the Web. Note: In order to use the Web Publishing Tool as outlined below, your network connection must be able to connect, send and receive data on TCP port 3537. Please check your firewall and network settings before proceeding. 1. In LabVIEW, Select Tools»Web Publishing Tool to display this dialog box shown in Figure E.1. This dialog box includes the following components and series of pages: Eric Carestia Florida Gulf Coast University Page 47 Figure E.1 Web Publishing Tool Dialog Box Preview—Displays a preview of the Web page to be generated. This component appears on each page of the Web Publishing Tool dialog box. Preview in Browser—Previews the Web page in the default browser. This option is disabled if the LabVIEW Web Server is not running. Start Web Server—Starts the LabVIEW Web Server. This option is disabled if the Web Server is already running. Select VI and Viewing Options—Includes the following components: o VI name—Allows you to select the VI you want to publish. Eric Carestia Florida Gulf Coast University Page 48 Note The Web Publishing Tool creates an HTML file in the application instance from which you open the VI. If you close the VI and then reopen the VI in a different application instance, clients cannot view the VI. o Viewing Mode—Contains the following options: Embedded—Embeds the front panel of the VI so clients can view and control the front panel remotely using a browser. The VI must be in memory on the server computer so clients can view and control the front panel. You can embed only standard VIs for remote front panel connections. For example, you cannot embed a polymorphic VI[1]. Snapshot—Displays a static image of the front panel in a browser. This option does not allow you to interact with the controls of the VI from the browser. Monitor—Displays an animated snapshot that updates continuously. This option does not allow you to interact with the controls of the VI from the browser. *Select this option* o Show border—Surrounds the embedded front panel image with a thin border. Select HTML Output—Includes the following components: o Document title—Text that appears as the title of the Web page. Eric Carestia Florida Gulf Coast University Page 49 o Header—Text to display before the image of the front panel. o Footer—Text to display after the image of the front panel. Save the New Web Page—Includes the following components: o Local Directory to save the Web page—The folder in which to create the HTML file, usually located in the .\thelabview\www directory on Windows. o Filename—The filename to give the HTML file. o URL—The Web address of the document if the document is published on the computer on which it is being created. You can copy the URL into a Web browser. 2. From the VI Name drop‐down menu in Figure E.1, and select your VI from the file dialog that opens. 3. Select the Monitor option and enter zero (0) in the Seconds between updates to simulate a continuously updating web page. 4. Click the Next button 5. Replace the sample text in the Document Title, Header, and Footer boxes with your text as shown in Figure E.2. Eric Carestia Florida Gulf Coast University Page 50 Figure E.2 Naming Your Web Page 6. Before publishing, you are given the option to choose where the HTML files and URL are 7. stored locally The paths and file names shown in Figure E.3 are generated from the previous pages and it is recommended NOT to alter these fields. Figure E.3 Saving HTML Files and URL 7. Select Save to Disk to complete the generation of your webpage. 8. In Figure E.4, A dialog box appears after saving to disk with the URL of your web page Eric Carestia Florida Gulf Coast University Page 51 And the option to connect to it. Figure E.4 Connect To Your New Web Page 9. After selecting Connect from the dialog box in Figure E.4 and your web browser will open displaying your new web page as shown by Figure E.5. Figure E.5 Web Page Front Panel Displayed in Google Chrome Eric Carestia Florida Gulf Coast University Page 52