1
Data Acquisition with NI WSN Gateway and Nodes
Chris Ruskai
Mike Hannaford
Garrett Colas
CDA 4170
Dr. Janusz Zalewski
FGCU
December 15, 2011
Wireless Sensor Network 1
1. Introduction
The National Instruments Wireless Security Network (NI-WSN) 9791 gateway is a
programmable Ethernet gateway that connects the remote NI-WSN nodes to a
computer for data acquisition and control. The NI-WSN 3202 and the NI-WSN 3212
nodes are programmable wireless receivers housing several analog and digital inputs.
These nodes can be connected to a variety of sensors including, but not limited to,
ultrasonic sensors and infrared sensors. The objective of this project is to transmit data
from various sensors via a wireless network to a computer running LabVIEW. To prove
this concept we have designed a security system to be detailed below.
Wireless Sensor Network 2
2. Device Description and Interface
2.1 Wireless Devices
The devices used in this project include:
● NI WSN 9791 Ethernet Gateway: used to route the connection from the nodes to
the host computer
● NI WSN 3202 Node: used to relay data gathered from analog or digital sensors
to the host computer
● NI WSN 3212 Node: used to relay data obtained from thermocouples or digital
sensors to the host computer
● Parallax PING Ultrasonic Sensor: used to detect the proximity of an object.
● Parallax PIR Infrared Sensor: used to detect the proximity of an object using
infrared signals
● Basic K-type Thermocouple: used to detect changes in temperature.
● LED Light: used to signal the triggering of an alarm.
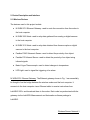
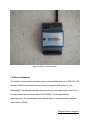
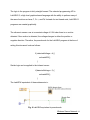
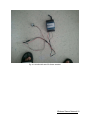
NI WSN 9791 Ethernet Gateway. The Ethernet gateway shown in Fig. 1 can essentially
be thought of as the bridge between the wireless nodes and the host computer. It
connects to the host computer via an Ethernet cable to receive instructions from
LabVIEW 2010+ and broadcast them to the nodes. Each node is synchronized with the
gateway via the LabVIEW Measurement and Automation software package in
LabVIEW.
Wireless Sensor Network 3
Fig. 1. NI WSN 9791 Ethernet Gateway
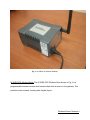
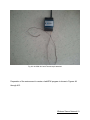
NI WSN 3202 Wireless Node. The NI WSN 3202 Wireless Node shown in Fig. 2 is a
programmable wireless receiver that transmits data from a sensor to the gateway. This
particular node contains 4 analog and 4 digital inputs.
Wireless Sensor Network 4
Fig. 2. NI WSN 3202 Wireless Node
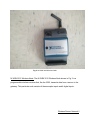
NI WSN 3212 Wireless Node. The NI WSN 3212 Wireless Node shown in Fig. 3 is a
programmable wireless receiver that, like the 3202, transmits data from a sensor to the
gateway. This particular node contains 4 thermocouple inputs and 4 digital inputs.
Wireless Sensor Network 5
Fig. 3. NI WSN 3212 Wireless Node
2.2 Wireless Standards
The wireless communication between nodes in accomplished with use of IEEE 802.15.4
standard. While the standard can be purchased, we gained free access to it via
Wikipedia[5]. This standard specifies the physical layer and media access control for a
low-rate wireless personal area network (LR-WPAN). The standard defines
specifications for the fundamental lower network layers of a certain wireless personal
area network (WPAN).
Wireless Sensor Network 6
In general, the standard is intended for very low cost devices that communicate over a
short range. The basic framework provides for a 10-meter range with an average
transfer rate of 250 kbit/s. Initially, lower rates of transfer were considered, but later
opted out of. 20 and 40 kbit/s were the initial definitions and 100 kbit/s is the current
definition. Even lower rates can be achieved with less power consumption being the
benefit. The standard allows for those low powered devices to utilize power
management functions such as link quality and energy detection.
Important features of this standard include the ability of real time data transfer. This is
accomplished by guaranteed reservation of time slots during transmissions.
Additionally, the medium access involves Carrier Sense Multiple Access with Collision
Avoidance (CSMA/CA). The final contributor to real time suitability is the integrated
support for secure communications.
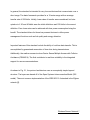
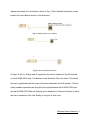
As shown in Fig. 3.1, the protocol architecture uses a conceptually simple layered
structure. The layers are based off of the Open Systems Interconnection Model (OSI
model). The most common implementation of the IEEE 802.15.4 standard is the Zigbee
network [6].
Wireless Sensor Network 7
Fig 3.1. Stack protocol of IEEE 802.15.4 [5]
2.3 Sensing Devices and Peripherals
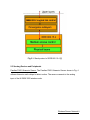
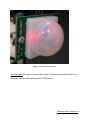
Parallax PING Ultrasonic Sensor. The Parallax PING Ultrasonic Sensor shown in Fig. 4
utilizes ultrasonic audio chirps to detect motion. The sensor connects to the analog
input of the NI WSN 3202 wireless node.
Wireless Sensor Network 8
Fig. 4. Parallax PING UltraSonic Sensor
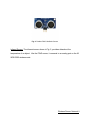
Infrared Sensor. The infrared sensor shown in Fig. 5, provides data about the
temperature of an object. Like the PING sensor, it connects to an analog port on the NI
WSN 3202 wireless node.
Wireless Sensor Network 9
Fig. 5. Parallax PIR Infrared Sensor
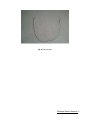
Thermocouples Although, not used in this project, thermocouples (shown in Fig 6) are
the default sensors delivered with this NI-WSN system.
Wireless Sensor Network 10
Fig. 6 Thermocouple
Wireless Sensor Network 11
3. Programming Principles
Each of the sensors is monitored via a LabVIEW 2010 programming. First, the sensor
nodes must be connected to the Ethernet gateway via NI Measurement and Automation
Explorer. To do so, follow the following steps:
● Open NI Measurement and Automation Explorer.
● Expand the Remote Systems Tree.
● The NI WSN 9791 Ethernet Gateway should automatically be detected. Click it.
● On the screen that appears after clicking the gateway, click the nodes tab.
● Click add nodes.
● Enter the type of node and the serial number of the node.
● Repeat for each additional node.
Once the nodes are added to the gateway, the user can now create an empty LabVIEW
project. Once the project is created in LabVIEW, right click the project name. Select
New >> Targets and Devices... Select Existing Targets or Devices and expand the
WSN Gateway folder to choose the 9791 Ethernet Gateway configured in Measurement
and Automation. The measurement nodes configured with the network are automatically
added underneath the gateway in the LabVIEW Project, giving the user instant access
to their I/O variables and properties.
Graphical programming of instruments is very different than in traditional text-based
languages, specifically, the explicit sending of data to device registers. An equivalent
operation in LabVIEW is performed by graphically connecting respective visual
elements. For example, to connect the sensor data to an indicator, all one should do is
drag the AI0 from the 3202’s I/O tree on the left hand side of the screen onto the block
Wireless Sensor Network 12
diagram and attach it to an indicator, shown in Fig. 7. More detailed information can be
found in the User Manual section of this document.
Fig. 7. Attaching input to an indicator
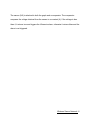
Fig. 8 Connecting shared variables.
In Figure 8, AI0 (or Analog Input 0) represents the sensor attached to the AI0 terminal
on the NI-WSN 3202 node. It is attached to the Waveform Chart via a wire. This allows
the user to graphically see the output of a sensor attached to the AI0 terminal. The link
quality variable represents the strength of the signal between the NI-WSN 3202 node
and the NI-WSN 9791 Ethernet Gateway and is attached to a Numeric Indicator to allow
the user to determine if the Link Quality is too poor for their uses.
Wireless Sensor Network 13
The logic to the program is fairly straight-forward. The selected programming API is
LabVIEW G, a high level graphics based language with the ability to perform many of
the same functions as Java, C, C++, and C#. Instead of a text based code, LabVIEW G
programs are created graphically.
The ultrasonic sensor runs at a constant voltage of 0.5V when there is no motion
detected. Once motion is detected, the voltage changes in either the positive or
negative direction. Therefore, the pseudocode for the LabVIEW program at the time of
writing this document looks as follows:
if (detectedVoltage < 4) {
activateLED();
}
Similar logic can be applied to the infrared sensor:
if(detectedVoltage > 3) {
activateLED();
}
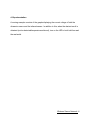
The LabVIEW equivalent of these statements is:
Fig. 9 LabVIEW equivalent to pseudocode
Wireless Sensor Network 14
The sensor (AI0) is attached to both the graph and a comparator. The comparator
compares the voltage obtained from the sensor to a constant (4). If the voltage is less
than 4, it returns true and triggers the Ultrasonic alarm, otherwise it returns false and the
alarm is not triggered.
Wireless Sensor Network 15
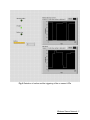
4. Experimentation
A running example consists of the graphs displaying the correct voltage of both the
ultrasonic sensor and the infrared sensor. In addition to this, when the desired result is
obtained (motion detected/temperature achieved), turn on the LED in both LabView and
the real world.
Wireless Sensor Network 16
Fig. 9 Detection of motion and the triggering of the on screen LEDs
Wireless Sensor Network 17
5. Conclusion
The most difficult hurdles to overcome in this project were damaged sensors, horrible
and inaccurate documentation in previous products as well as the broken, non-working
source code of the previous project, and the power limitations of the NI-WSN 3202 node
(limit of two devices per node). As such, this project is, as of the time of writing, the first
and only project at Florida Gulf Coast University dealing with the NI-WSN 3202 sensor
node and the NI-WSN 9791 to be fully functional. In this project, we’ve learned how to
program in LabVIEW as well as how to troubleshoot analog signals. Future projects
could add another NI-WSN 3202 node and either more PIR and PING))) sensors or
entirely different analog sensors.
Wireless Sensor Network 18
6. References
[1] Parallax PING Ultrasonic Sensor Documentation:
http://www.parallax.com/Portals/0/Downloads/docs/prod/acc/28015-PING-v1.6.pdf
[2] Parallax PIR Sensor Documentation:
http://www.parallax.com/dl/docs/prod/audiovis/pirsensor-v1.2.pdf
[3] Getting Started with NI Wireless Sensor Networks:
http://zone.ni.com/devzone/cda/tut/p/id/8890
[4] IEEE 802.15.4 standard documentation:
http://standards.ieee.org/getieee802/download/802.15.4d-2009.pdf
[5] IEEE 802.15.4 stack protocol:
http://en.wikipedia.org/wiki/IEEE_802.15.4
[6] ZigBee Alliance Standards:
http://www.zigbee.org/Specifications/ZigBee/Overview.aspx
Wireless Sensor Network 19
Appendix
User Manual
A1. Connecting the sensors to the NI-WSN 3202/NI-WSN 3212 nodes:
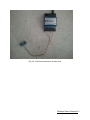
Connect the ultrasonic sensor to the 3202 node by connecting the power, ground, and
signal wires to the SEN PWR, AI0 GND and AI0 terminals on the node respectively, as
shown in Figure A1. Perform the same action for the IR sensor, using AI1 and AI1
ground instead (Fig. A2). If used, connect the thermocouple positive and negative to the
NI WSN 3212 TC0+ and TC0- terminals respectively (Fig. A3).
Wireless Sensor Network 20
Fig. A1. PING Sensor attached to NI WSN 3202
Wireless Sensor Network 21
Fig. A2. NI WSN 3202 with PIR Sensor attached.
Wireless Sensor Network 22
Fig. A3. NI WSN 3212 with Thermocouple attached
Preparation of the environment to create a LabVIEW program is shown in Figures A4
through A13.
Wireless Sensor Network 23
A2. Adding the nodes to the WSN 9791 ethernet gateway:
Preparation of the environment to create a LabVIEW program is shown in Figures A4
through A13.
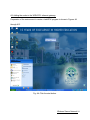
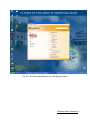
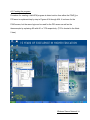
Fig. A4. Click the start button.
Wireless Sensor Network 24
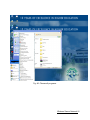
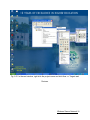
Fig. A5. Choose all programs.
Wireless Sensor Network 25
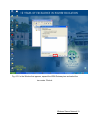
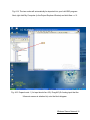
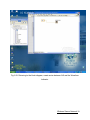
Fig. A6. Navigate to the National Instruments folder and choose Measurement and
Automation.
Wireless Sensor Network 26
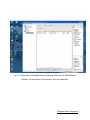
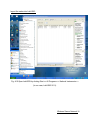
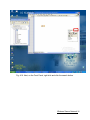
Fig. A7. Expand the tree labeled Remote Systems. Select the NI-WSN Ethernet
Gateway. On the bottom of the window, click the Nodes tab.
Wireless Sensor Network 27
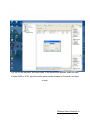
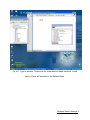
Fig. A8. On the top panel, click add nodes. In the window that appears, select the type
of node (3202 or 3212), input the node’s serial number (located on the back), and input
a node
Wireless Sensor Network 28
Fig. A9. ID (0-50). Close Measurement and Automation.
Wireless Sensor Network 29
Import the nodes into LabVIEW:
Fig. A10 Open LabVIEW by clicking Start >> All Programs >> National Instruments >>
(In our case, LabVIEW 2011).
Wireless Sensor Network 30
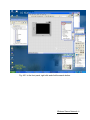
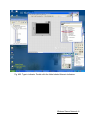
Fig. A11. On the screen that pops up, click Empty Project.
Wireless Sensor Network 31
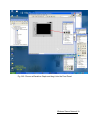
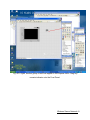
Fig. A12. In the next window, right click the project name and click New >> Targets and
Devices.
Wireless Sensor Network 32
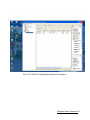
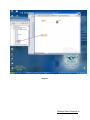
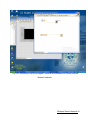
Fig. A13. In the Window that appears, expand the WSN Gateway tree and select the
two nodes. Click ok.
Wireless Sensor Network 33
A3. Creating the program:
Procedure for creating a LabVIEW program to detect motion from either the PING))) or
PIR senor is explained step by step in Figures A14 through A24. It is shown for the
PING sensor, but the same logic can be used for the PIR sensor as well as the
thermocouple by replacing AI0 with AI1 or TC0 respectively. (TC0 is located in the Node
2 tree).
Wireless Sensor Network 34
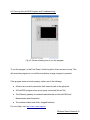
Fig. A14. The two nodes will automatically be imported into your LabVIEW program.
Next, right click My Computer (in the Project Explorer Window) and click New >> VI.
Fig. A15. Expand node 1 (1st input should be: AI0). Drag AI0 (Or Analog input that the
Ultrasonic sensor is attached to) onto the block diagram.
Wireless Sensor Network 35
Fig. A16. Next, on the Front Panel, right click and click the search button.
Wireless Sensor Network 36
Fig. A17. Type in indicator. Double click the folder labeled Graph Indicators. A new
group of items will be added to the Express Menu.
Wireless Sensor Network 37
Fig. A18. Choose a Waveform Graph and drag it into the Front Panel.
Wireless Sensor Network 38
Fig. A19. Returning to the block diagram, create a wire between AI0 and the Waveform
Indicator.
Wireless Sensor Network 39
Fig. A20. Next, from the Project Explorer window, drag Link Quality onto the block
diagram.
Wireless Sensor Network 40
Fig. A21. In the front panel, right click and click the search button.
Wireless Sensor Network 41
Fig. A22. Type in indicator. Double click the folder labeled Numeric Indicators.
Wireless Sensor Network 42
Fig. A23. Again, another group of items will appear in the Express menu. Drag any
numeric indicator onto the Front Panel.
Wireless Sensor Network 43
Fig. A24. Returning to the block diagram, create a wire between Link Quality and the
Numeric Indicator.
Wireless Sensor Network 44
A4. Running the LabVIEW Program and Troubleshooting:
Fig. 25. Screen showing how to run the program.
To run the program, in the Front Panel, click the symbol of two arrows in a loop. This
will cause the program to run until the stop button (orange octagon) is pressed.
If the program does not work properly, make sure of the following:
● All wires are correctly connected, both securely and in the right ports
● All LabVIEW program wires are properly connected (No red X’s)
● The Ethernet gateway is connected and detected in both LabVIEW and
Measurement and Automation.
● The wireless nodes have fresh, charged batteries.
For more help, visit: http://www.ni.com/support/
Wireless Sensor Network 45