1
Seneca College - School of Information and Communications Technology - C. Rodgers
DCM555 - Data Communications
Lab 6
Transferring Waveforms over the LAN
Name: __________________________
St. #: _____________________
Section: ______
(Note: Show all of your calculations, express your answer to the appropriate number of significant digits (at least
three) and use the correct units in your answer. Place your answer in the space provided.)
Lab Objectives
• to review LAN & GPIB configuration procedures for remote control of Agilent instruments
• to access and vary settings for the built-in waveforms of the Agilent 33220A Function /Arbitrary
Waveform Generator
• to use Agilent Visual Engineering Environment (VEE Pro) to create arbitrary waveforms and send
them to the Agilent 33220A Function /Arbitrary Waveform Generator over the LAN for production
Components Required
• none
Equipment Required
• Agilent 33220A Arbitrary Waveform Generator
• Agilent/Keysight DSO-X 2002A Mixed Signal Oscilloscope
• Agilent Visual Engineering Environment (VEE Pro)
With DSO-X 2000
series Oscilloscope
Lab Exercise
Built-in Arbitrary Waveforms
1. Turn on the Agilent 33220A Function /Arbitrary Waveform Generator and the Agilent DSO-X 2002A
Mixed Signal Oscilloscope. Determine the LAN address for each instrument/device to be used and record
them below. Do not change any of the LAN/IP addresses and configuration!
•
Agilent 33220A Function /Arbitrary Waveform Generator: Utility > I/O > LAN, Current Config
33220A IP Address ______
•
Agilent DSO-X 2002A Mixed Signal Oscilloscope: Utility > I/O > LAN Settings, then IP Address
DSO-X 2002A IP Address ______
2. Turn on one of the lab station PCs and log on.
3. From Windows launch VEE Pro (from the desktop icon Agilent folder...).
4. It will be necessary to first establish the LAN connection interfaces in VEE Pro for all devices to be
used. Follow the procedure used in the previous Intro lab to initialize the VEE LAN(TCP/IP) interface.
NOTE: It is often a good idea to keep a VEE Pro template file set up for your lab station. If the "Save I/O
Configurations with Program" box is checked when saving the file in the last lab, all interface configuration
data will be retained, and it will be unnecessary to repeat these steps the next time, when you simply open
the template file in VEE Pro, then save it with a new name, keeping your template file pristine for future
use.
1 of 10
Seneca College - School of Information and Communications Technology - C. Rodgers
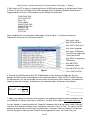
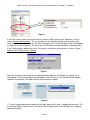
5. We'll now use VEE to access a function built into the 33220A which produces an AM waveform. Create
a "Direct I/O" box for the 33220A into the VEE workspace. Enter the following Standard Commands for
Programmable Instruments (SCPI) program into the 33220A transaction box:
"FUNC:SHAP SIN"
"VOLT:UNIT VPP"
"VOLT 1.0"
"FREQ 100E3"
"AM:INT:FUNC SIN"
"AM:INT:FREQ 1E3"
"AM:DEPT 50"
"AM:STAT ON"
"OUTP ON"
When completed, the transaction box should appear similar to Figure 1. Examine the command
explanations and make sense of them for yourself:
Sets carrier signal
type (FUNC) to SINe
Sets VOLTs UNIT to VP-P
Sets carrier amplitude
Sets carrier FREQuency
Sets INTernal modulating
signal type to SINe
Sets INTernal modulating
FREQuency
Sets AM DEPTh
(modulation index)
Sets AM STATus to ON
Figure 1
Turns OUTPut to ON
6. Connect the 33220A output to the DSO-X 2002A probe. Set the time base to 500µs/div. Run the
program. An AM waveform should appear on the oscilloscope display. "Stop" the DSO-X 2002A and view
the AM waveform. Use the oscilloscope cursor functions to measure the carrier frequency and modulating
frequency (from the envelope). Also determine the modulation index. Record your values below:
Re call m =
B−A
B+ A
fC = _______________
fi = _______________
m = _______________
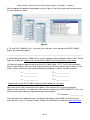
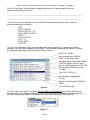
7. Modify your program to make the carrier frequency, the intelligence frequency and the modulation index
all variable from a slide bar (from Data > Continuous > Real64). (Don't forget to put a space before the ".)
As each slide bar is inserted, examine the "Properties" window on the left of the screen. Under "Behavior"
select the "Auto Execute" pull-down menu. Change the value from "False" to "True". This causes the VEE
program to automatically run whenever the slider position is changed. From the "Properties" window you
can also change the slider titles from "Real64" to more appropriate names, like Carrier Freq., etc.
2 of 10
Seneca College - School of Information and Communications Technology - C. Rodgers
When completed, the program should appear similar to Figure 2. Set the minimum and maximum values
for each slide bar as shown:
Figure 2
8. Turn the DSO-X 2002A to "Run". Vary each of the slide bars in turn and look at the DSO-X 2002A
display. Describe what happens:
____________________________________________________________________________________
9. Set the AM waveform for a 100kHz carrier, a 1kHz intelligence and a modulation index of 100%. Set the
time base to 500µs/div. Capture and save the DSO-X 2002A time domain display for your report.
10. Select the frequency domain function of the DSO-X 2002A (Math > FFT). Turn Off the time domain
display. Under Settings, adjust the Center frequency to that of the carrier and the Span to 10kHz. Use the
cursor functions to measure the three peak frequencies and powers (in dBV). Record them below:
f1 = _______________
P1 = _______________
f2 = _______________
P2 = _______________
f3 = _______________
P3 = _______________
Capture and save the DSO-X 2002A frequency domain display for your report.
Adjust each of the sliders and monitor what happens in the spectrum. By varying the intelligence
frequency lower and lower, try to determine the maximum resolution of the DSO-X 2002A FFT, that is, the
minimum discernable frequency separation between spectral peaks.
FFT resolution = _______________
There are other built-in modulation types and arbitrary waveforms in the 33220A, all of which can be
accessed from a User I/O interface as above. (Search for the 33220A User Manual at www.agilent.com)
3 of 10
Seneca College - School of Information and Communications Technology - C. Rodgers
User-Defined Arbitrary Waveforms
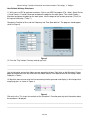
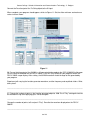
11. We'll now use VEE to generate waveforms. Start a new VEE Pro program (File > New). Select Device
> Virtual Source > Function Generator and place the object on the work space. Then select Display >
Waveform and place the object on the work space. Join the output of the function generator ("Func") to
the input of the display ("Trace 1").
Change the Function to Sine, and the Frequency and Time Span both to 1.The program should appear
similar to Figure 3.
Figure 3
12. Push the "Play" button. Precisely what do you see?
____________________________________________________________________________________
____________________________________________________________________________________
Use the horizontal and vertical sliders to move around the display. Right click on the Waveform Display
object and experiment with the Auto Scale and Zoom features. Also experiment with the settings under
Properties > Scales.
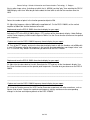
13. Move the mouse cursor over the line connecting function generator and display. It will change into a
magnifying glass as shown in Figure 4.
Figure 4
Click on the line. This shows the contents of the "waveform". Describe precisely what information about
the waveform is displayed:
____________________________________________________________________________________
____________________________________________________________________________________
4 of 10
Seneca College - School of Information and Communications Technology - C. Rodgers
14. How does the number of elements in the array correspond to the number of points set in the function
generator object?
____________________________________________________________________________________
Record the value in any element of the array (except the first) and the element index. (You will use this
later.)
Array value = ____________
Array index = ____________
15. We will now prepare the waveform data for transfer to the 33220A Arbitrary Waveform generator. The
waveform data is actually a composite data type consisting of the array and a Time Span. We need to
Unbuild the waveform first. Insert an Unbuild Waveform object into the work space from Data > Unbuild
Data > Waveform. Double click on the object. Insert two alphnumeric displays from Display >
Alphanumeric and connect them to the "Real64 Ary" and "Time Span" outputs of the Unbuild object. The
program should appear similar to Figure 5.
Figure 5
Push the "Play" button. What do the two alphanumeric displays show? (Use the slide bar if present.)
____________________________________________________________________________________
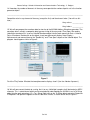
16. We will now convert the data to a string, that is to say, 8 bit digital samples of will be treated as ASCII
character. This is a data format which can be received and understood by the 33220A. Insert a To String
object into the work space from I/O > To > String. Right click on the To String object and select Properties.
A Properties side panel will appear on the left side of the screen, as shown on the left of Figure 6.
5 of 10
Seneca College - School of Information and Communications Technology - C. Rodgers
Figure 6
In the Data Format section, ensure that the Array Format is Block, and the Array Separator is set to a
comma (between double quotes). This uses a comma as the delimiter between each character of the
string, which is formed from the array. The Data Format part of the To String Properties box should appear
as shown on the right of Figure 6. This will insert an ASCII comma character between sample characters.
In the To String object, double click on the Transaction Line and form a transaction as shown in Figure 7.
Make sure the String Format is selected.
Figure 7
Select OK and connect the output of the Unbuild Waveform object to the "Real64 Ary" input of the To
String object. This part of the program should appear similar to Figure 8. The Unbuild Waveform object
separates the waveform Time Span from the actual waveform samples.
Figure 8
17. Insert a Logging Alphanumeric object into the work space from Display > Logging Alphanumeric. (This
is the type of display used for strings.) Connect the Result output of the To String Object to the Logging
Alphanumeric input.
6 of 10
Seneca College - School of Information and Communications Technology - C. Rodgers
Push the "Play" button. Describe how the Logging Alphanumeric Display data differs from the
Alphanumeric Display of the array?
____________________________________________________________________________________
____________________________________________________________________________________
18. From the Instrument Manager, insert a 33220A transaction box into the work space. Enter the
following sequence of transactions:
"*RST"
"OUTP:LOAD INF"
"DATA VOLATILE, ", W
"FUNC:USER VOLATILE"
"FREQ ", F
"VOLT:UNIT VPP"
"VOLT ", A
"FUNC USER"
"OUTP ON"
This will insert three inputs on the transaction box, one each for frequency (F), amplitude (A) and the
waveform string (W). When complete, the 33220A I/O transaction box should look like Figure 9. Examine
the command explanations and make sense of them for yourself:
ReSeTs the 33220A
Sets the output for an INFinite
LOAD (i.e. the scope: 1MΩ)
Waveform to be transferred to 33220A
VOLATILE memory from "W" input
Sets the USER waveform to VOLATILE
Sets waveform FREQuency from
"F" input
Sets VOLTs UNIT to VP-P
Sets waveform amplitude from
"A" input
Assigns current waveform (FUNC) to
USER
Figure 9
Turns OUTPut to ON
19. Insert sliders for F and A, as in Step 8. Set each slider to "Auto Execute" by setting the AutoExecute
Behaviour in the slider Properties window to True. This will cause your VEE program to execute whenever
the slider settings are changed, eliminating the need to push the Play button. (See Figure 10.)
Figure 10
7 of 10
Seneca College - School of Information and Communications Technology - C. Rodgers
Connect the Result output of the To String object to the W input.
When complete, your program should appear similar to Figure 11. Set the slider minimum and maximum
values to those shown.
Figure 11
20. Ensure that the output of the 33220A is still connected to the probe to the DSO-X 2002A Oscilloscope.
Push the Auto Scale button on the DSO-X 2002A. Push the "Play" button for your program. Watch the
DSO-X 2002A scope display. After a delay, the 33220A waveform should change to that generated by
your program.
Experiment with varying the function generator waveform, and the frequency and amplitude sliders. What
takes place?
____________________________________________________________________________________
____________________________________________________________________________________
21. Change the number of points in the function generator object to 1000. Push "Play" and again examine
the waveform using the magnifying glass. What changed?
____________________________________________________________________________________
Change the number of points to 5 and push "Play". Describe the waveform displayed on the DSO-X
2002A?
____________________________________________________________________________________
8 of 10
Seneca College - School of Information and Communications Technology - C. Rodgers
Also try other larger values (including up to 64k, that is, 65,536), pushing "play" then watching the DSO-X
2002A display each time. What do you notice about the time taken to transfer the waveform over the
LAN?
____________________________________________________________________________________
Return the number of points in the function generator object to 256.
22. Adjust the frequency slider to 1000 and the amplitude to 2. On the DSO-X 2002A, set the vertical
amplifier to 500mV/div and the timebase to 2ms/div.
Capture and save the DSO-X 2002A time domain display for your report.
Activate the FFT of the DSO-X 2002A (Math > FFT) and turn off the time domain display. Under Settings
set the Center frequency to 5kHz and the Span to 10kHz. Use the Cursor function to measure the spectral
peak frequency.
Capture and save the DSO-X 2002A frequency domain display for your report.
23. Turn off the FFT display, and turn the time domain display back on with the timebase set to 500µs/div.
In your VEE program, change the frequency in the function generator object to a non-integral value, such
as 1.2. Push the "Play" button. Describe what you observe on the DSO-X 2002A
____________________________________________________________________________________
____________________________________________________________________________________
Capture and save the DSO-X 2002A time domain display for your report.
24. Adjust the time base back to 2ms/div. Reactivate the FFT and turn off the time domain display. Use
the Cursor function to measure the spectral peak frequencies. Describe what you observe on the DSO-X
2002A.
____________________________________________________________________________________
____________________________________________________________________________________
____________________________________________________________________________________
Capture and save the DSO-X 2002A frequency domain display for your report.
25. Using the Function menu of the VEE Function Generator, experiment with other waveforms, such as
Square, and so forth. Change the amplitude and frequency settings and observe the corresponding
changes in the time and frequency domain of the DSO-X 2002A.
9 of 10
Seneca College - School of Information and Communications Technology - C. Rodgers
Further study
26. In Step 6, did the measured values for fC, fi and m equal those specified by the program? If not, offer a
possible reason why:
____________________________________________________________________________________
27. Describe the advantage of the slide bar Auto Execute feature:
____________________________________________________________________________________
____________________________________________________________________________________
28. How does your estimate FFT resolution in Step 11 compare with the IFR spectrum analyzer used
previously in A4056? Why is spectrum analysis (FFT) resolution important?
____________________________________________________________________________________
____________________________________________________________________________________
29. From the array index you recorded in Step 14, calculate what the array value should be. (Hint: You
divided one sine wave cycle into 255 intervals.) How does this compare with the value recorded in Step
14?
Calculated Array value = ____________
30. Based on Step 15, give the advantage and disadvantage of increasing the number of waveform points:
____________________________________________________________________________________
____________________________________________________________________________________
31. The waveform generated in your program was transmitted in a string format. Describe a disadvantage
of transmitting the waveform as a string:
____________________________________________________________________________________
____________________________________________________________________________________
32. What was the difference between the 33220A waveform in Steps 22 and 23?
____________________________________________________________________________________
____________________________________________________________________________________
Based on the FFT Spectra for Step 22 and 23, describe the precautions which must in general be taken
when transmitting an arbitrary waveform:
____________________________________________________________________________________
____________________________________________________________________________________
____________________________________________________________________________________
10 of 10