1
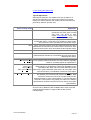
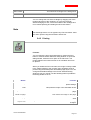
Standard
Deviation
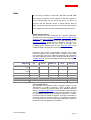
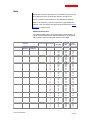
Standard deviation
Mean Energy
Average image energy
Root Mean
Square (RMS)
Root mean square value
Skewness
Skewness of the distribution
Some of the parameters are specified in scientific exponential
notation, e.g. Pixel = 3.28e+005 = 327680 (corresponds to a
scan format of 640 x 512).
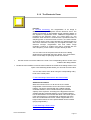
Note
Using the maximum and minimum values of intensity, the gain
values and offset values can be optimally configured for the
detectors.
5.3.2 Measuring a Profile in a Single Image
Function
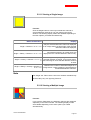
Use the Profile function to measure a specific dimension over a
line segment and display it graphically. The profile is measured
from the data record selected in the Viewer window. The data
record can be a single image or an image series from raw data
or a processed image. Depending on the dimension represented
in the image, either a measured curve of intensity values (I) or
height values (µm) is calculated.
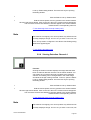
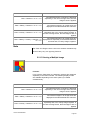
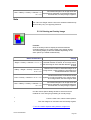
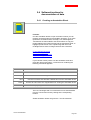
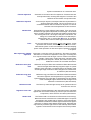
When you click the Profile button, the line segment to be
measured appears in the Viewer window as a white line in the
image. You can change the length and position of the line
segment by clicking the line and, while clicking and holding the
grab point with the left mouse button, dragging it to the desired
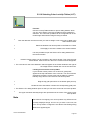
position. The Profile viewer window opens, too, which displays a
profile curve for each detection channel and subsequent
statistical calculations:
Version: RK09052000
Page 67