1
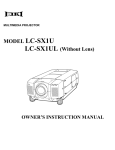
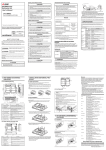
Introduction to QGIS 0.9 and GRASS 6.2
March 24, 2008
Prepared by
Scott Mitchell
for the Ottawa Chapter, OSGEO Foundation
http://wiki.osgeo.org/index.php/Ottawa_Chapter
This tutorial is licensed under Creative Commons Attribution-Share Alike 2.5 Canada License
1
1
Introduction
This document provides an introduction to QGIS 0.9, GRASS 6.2, and how they can work together. If you have
received this document in an OSGEO workshop, we may not cover exactly the steps outlined in this document,
or all of them, but you should feel free to work ahead if you find yourself working faster than other people in the
room, and on the other hand, if you felt rushed during the workshop, you can keep this document and return to
any of these activities on your own time.
1.1
Intended Audience
This workshop does not assume any previous experience with QGIS or GRASS. At the same time, we do not provide
much introduction to Geographic Information Systems (GIS) overall, on the assumption that the majority of people
we will attract will already have some sort of GIS background, or at least an understanding of map coordinates,
projections, scale, etc. If this is all new to you, try it out anyway! There are many resources to fill in the gaps, and I
would be happy to discuss them with you.
1.2
Platforms
This document is mostly written assuming you are working on the Linux platform - specifically, in our lab, we’re
using the Fedora distribution, version 7. For the QGIS part of the tutorial, you could quite happily do the same
steps whether you’re running Linux, Windows, or MacOS X. To ”happily” run GRASS GIS, UNIX-based or UNIXlike operating systems, such as Linux or Mac OS X, are currently the best choice, since GRASS still depends on
many things which only exist in the UNIX world. For Windows systems, there are some workarounds to add such
facilities, and there are also ongoing efforts in GRASS development to lessen the reliability on these UNIX-specific
systems so that a truly native Windows port of GRASS - but at the time of this writing, this portability objective is
not quite finished.
In the meantime, the QGIS part of the tutorial will work on all common operating systems. GRASS runs wonderfully on PC hardware under Linux, Apple computers running Mac OS X, as well as on more traditional UNIX
systems. The Windows version of QGIS actually includes GRASS processing modules in the default install, which
provides an easy way to access the power of GRASS on Windows systems, as we shall see later on in this tutorial.
Therefore, if you are using this tutorial on a Windows machine, you might want to start with section 2, skim the
concepts in section 3, but proceed to section 4 to access GRASS functionality through QGIS.
1.3
Origins and future versions of this tutorial
This tutorial was originally developed for a workshop held by the OSGEO Ottawa chapter, in December 2007.
Suggestions and bug fixes are welcome. The original author, Scott Mitchell, intends to update it periodically
and use it in coursework at Carleton University. Others are also welcome to use it as they see fit, and modify
as required - it is licensed under the Creative Commons Attribution-Share Alike 2.5 Canada License, which essentially means that you can feel free to take it, use it, modify it, and circulate it as you see fit, as long as you
give credit to the original/preceding author(s), and make your derivate works generally available. See http:
//creativecommons.org/licenses/by-sa/2.5/ca/for more details. Some materials used herein are derived from Neteler, 2005, ”GRASS in a Nutshell”, a tutorial developed for the Open Source Geospatial conference
in Minnesota, 2005, and ideas for vector database exercises were derived from Neteler and Mitasova (2007).
1.4
Data
The dataset used in this workshop is the North Carolina location assembled for “the third GRASS book” (Neteler
and Mitasova, 2007, “Open Source GIS: A GRASS GIS Approach”, 3rd Edition, Springer, 424pp.). The data set
is available for download at the book’s webiste http://www.grassbook.org. Specifically, we will use the
GRASS database version as well as the generic shapefile and GeoTIFF versions, all of which can be found at
http://www.grassbook.org/data_menu3rd.php
2
Figure 1: QGIS interface
2
Quantum GIS (QGIS)
Quantum GIS was born in the age of Graphical User Interfaces, was designed to be a user-friendly interface to
GIS, and has a modern streamlined user interaction as a result. It is also an open source (GPL) project, and can be
used on Linux, Unix, Mac OS X, and Windows. It started out mainly as a data viewer and thematic mapping tool
for many common data formats (e.g. ESRI shapefiles, geotiff), but its plugin architecture extends this functionality
considerably. The extensions included with the main application allow additional capabilities such as full access to
GRASS data and many of GRASS GIS processing modules, as well as access to data on GPS units for downloading
and mapping track/waypoint data. It also provides a relatively friendly data input / editing tool for vector data in
either shapefile or GRASS vector formats. As of this writing, version 0.9.1 has been released and will be used in this
workshop. The user’s manual for the software is available at the QGIS Documentation page http://qgis.org/
content/view/106/79/.
2.1
Starting QGIS
The details of starting the software will vary by operating system / distribution. On our Linux workstations,
you can type qgis in to any command prompt to launch the program. Unlike GRASS, there is no command prompt
interface, but status messages and errors will be displayed in the terminal used to launch the program if this method
is used. On a Windows or MacOS X machine, there should be an icon in the Start Menu / Applications folder.
Start up QGIS now - you should get a window that looks like the one in Figure 1.
2.2
Adding raster data (generic)
Click the Add a Raster Layer button in the tool box, or find the relevant entry under the Layer menu. Navigate to the
proper directory for the GeoTIFF data, and choose the elevation.tif file. Click on Open, and the raster map should
load in to the main Map View. We can be reasonably confident that the spatial metadata has been successfully
imported because sensible-looking coordinates appear in the status display at the bottom right when we move the
pointer over the map, and we can be further assured by double clicking on the layer name in the table of contents
to bring up the Properties dialogue, and then choosing the Metadata tab.
3
2.3
Adding vector data (generic)
Click on the Add a Vector Layer button
(or, in the menus, Layer -> Add vector layer), and choose the streets_wake.shp
file from the folder where you have been provided with the shapefiles version on the sample data (or wherever you
put it yourself if you’re doing this on your own). Note that MapInfo files, ArcInfo coverages, and PostGIS layers
can also be loaded. Tutorials are available online for connecting QGIS to a PostGIS server, and the ”SPIT Plugin”
(Shapefile to PostGIS Import Tool) is a handy way to quickly load multiple shapefiles into a PostGIS database.
2.4
Symbology
To change display settings for any layer, double click on it in the Table of Contents and choose the Symbology tab.
For raster files, you have control over the colour assignment for multi-band files, and can choose transparency levels
for overlaying multiple layers. For vector layers, you have control over symbol widths, fills, and colours, and the
symbolization can be driven by the attributes. To demonstrate this, let’s set the colour of the streets according to the
CARTOLEVEL field in the attribute table for the streets file:
• double click on the streets_level layer in the ”Legend” area of the main QGIS window to bring up the layer
properties window
• in the Symbology tab of the layer properties window, choose ”Unique value” for the legend type
• if you click on the drop-down list beside ”Classification Field”, you will get a list of all the fields available in
the attribute data for this layer - in this case, choose CARTOLEVEL
• Press the Classify button - the software will read in all the unique values in the database for this field, and
assign a unique colour to each of them. Modify the symbology (colour, width, etc), and press the OK button
when you’re satisfied. The roads will be redrawn in the main mapping window accordingly, and the legend
will be changed to show the classification used.
2.5
Navigating through the map
The QGIS map navigation tools should be familiar to anyone used to common GIS tools, including proprietary GIS
software, or even web mapping interfaces. Briefly, the basic zoom and pan tools are available in the main toolbar,
with standard icons (a ”hand” for panning, and variations on a magnifying class for zooming). Depending on your
toolbar layout, you may only see one icon, for panning (
); if that’s the case, you can make the other appear by
clicking on the arrows ( ) beside the hand tool. You can also set the zoom level to show the entire extent of a given
layer by right clicking on the layer in the Legend pane, and choosing ”Zoom to layer extent”.
In the data loaded so far, a limited access highway generally follows a valley - note that towards the eastern edge of
the elevation model extent, there are a couple of major interchanges relatively ”deep” in the valley (i.e. they occur
in a darker area of the underlying elevation layer, which by default is displayed with darker colours where there is
lower elevation). Zoom into this area until you can see details of the DEM in the area surrounding the interchanges,
and you will see that you can actually see the difference in elevation of the highway roadbed and ramps compared
to the surrounding terrain. One of the advantages of this sample dataset is that it contains free LiDAR data (high
quality, high resolution elevation data) and various derivatives, which is still pretty rare given the relatively recent
sensor development and high costs of acquiring this kind of data.
2.6
Labelling
QGIS has decent labelling options, but it isn’t up to doing a good job of labelling the detailed streets map you have
loaded now without lots of extra work (labels that automatically follow the vectors is still a ”wish list” item, for
example). For a quick look at the labelling options, let’s load a simpler file, the ”roadsmajor.shp” file available in
the shapefiles version of the dataset. After adding this vector layer, double click on it in the Legend to bring up
4
the properties, then click on the Labels tab. Turn on the ”Display labels” check box, then choose ROAD_NAME for
the field containing the labels. If it says ”Label” for the ”Default label”, delete this text altogether. Play with the
font options if you want, then press OK. The state and Interstate highway numbers will be drawn on your map (if
necessary, zoom out to see the highways).
2.7
Plugins
Under the Plugins menu, choose Plugin Manager - you should be presented with a list of plugins installed on your
machine. Some of them add relatively specific capabilities, such as adding a scalebar to your map. Others are very
diverse and powerful, such as the GRASS plugin. Turn on the checkboxes beside the GRASS, Scale bar, and North
Arrow plugins, and then press OK. The map window is updated with a north arrow and a dynamic scale bar, and
controls for all three plugins have been added to the Plugins menu and the toolbars.
2.8
Accessing GRASS data (one layer at a time)
Now that the GRASS plugin is loaded, there should be another item called GRASS under the Plugin menu, and
another set of tools enabled on the toolbar. Using either of these interfaces, find the tool to add a GRASS vector
layer. Fill in the database directory with the PARENT directory where the GRASS version of the nc_spm dataset is
located on your machine (/usr/local/share/data/GRASS on the Linux partition on Carleton’s GIS lab machines),
and the possibilities should fill in automatically for locations, mapsets, and layers. Choose one of the NC_SPM
maps, and load it in to QGIS.
Now do the same thing for raster data, using the Add GRASS raster layer tool.
Confirm that the GRASS layers behave in the user interface just like any other layer. Try creating a thematic map of
Wake County soils (soils_wake layer), using a Unique Value renderer, based on the DSL_NAME attribute.
2.9
Digitizing in QGIS
From the Layer menu, choose ”New Vector Layer...” then choose Polygon as the layer type, leave the file format
as ESRI Shapefile, and add an Integer attribute called ”cat”. Press OK, and then specify a new filename - I will use
”mynewfile”.
At present, only shapefiles can be created from scratch. However PostGIS and GRASS layers can be edited. You
can, of course, also create data in a shapefile, and then import it into GRASS.
Click on the Toggle Editing Mode tool, and then the Capture Polygon tool in the digitizing section of the toolbar.
Start clicking in the map window with the left mouse button to draw a polygon. When you’re finished, use the
right mouse button. Enter a value for the category attribute when the table pops up.
Once you have at least one polygon digitized, turn off editing mode by pressing the Toggle Edit mode button.
Answer yes when it prompts you to save your changes. You now have a valid shapefile.
Detailed instructions for the digitizing tools are provided in the Users’s manual - note that snapping tolerances are
implemented, as well as ”ring” and ”island” polygons.
2.10
Queries
The simplest queries are accomplished with the Identify tool (
). This allows you to click on features in your
mapping window and get information about the attributes of the selected object. There is also a query builder
which can be used to select records using SQL for any OGR-supported1 vector data source.
1 From the GDAL website (www.gdal.org/ogr):”The OGR Simple Features Library is a C++ open source library (and commandline tools)
providing read (and sometimes write) access to a variety of vector file formats including ESRI Shapefiles, S-57, SDTS, PostGIS, Oracle Spatial,
and Mapinfo mid/mif and TAB formats. ... OGR is a part of the GDAL library.”
This library is used by QGIS to handle vector data access (and GDAL provides raster access).
5
The query builder is accessed by opening the attribute table for a layer (by, for example, right clicking on the layer
in the Legend, then choosing ”Open Attribute Table”), then pressing the ”Advanced” button at the bottom right of
the table’s window (a simple ”search” dialogue is also available right from the attribute table window itself).
The query syntax should be familiar to anyone used to performing this task in other GIS software. For example, the
query in the following figure would find all streets that have ”AVE” as their street type. When features are selected,
they can be saved to a separate shapefile by right clicking on the relevant layer in the Legend and choosing ”Save
selection as shapefile...”.
2.11
OGC Data
QGIS also supports WMS (web map service) and WFS (web feature service) as data sources, which means that
layers can be added from remote servers.
To demonstrate, we first need to turn on the on the fly reprojection option, so that our current map layers will line
up with services from the web. From the Settings menu, choose Project Properties. While we’re here, under the
General tab, let’s fix the map units - you may have noticed that the scalebar is displaying distances in degrees, not
the most convenient choice of units! Change the map units to meters. Next, choose the Projection tab, and turn on
the checkbox marked ”Enable on the fly projection”, then click OK. Now right click on the streets_wake layer in
your legend, and choose ”Zoom to layer extent”, to get the data back into the current map view.
To add a WMS layer, use the Add WMS layer function, either from the Layer menu or the toolbar button (
).
The WMS server list will be empty if this function has never been used before on the computer you’re using - if
that is the case, press the ”Add default servers” button and then click OK on the resulting dialogue box. Choose
NASA(JPL) in the server drop down box, and then press the Connect button. Choose the us_landsat_wgs84 layer
with the mouse, and then press the Add button. This layer will be added to your Legend, and after a short delay
while the data is transferred from NASA, it should show up in your Map View.
Now we’ll move on to GRASS. If you aren’t running GRASS on your computer, skim through the following, especially sections 3.1 to 3.3, and then continue on with section 4 of the tutorial.
3
3.1
Introduction to GRASS
The “seeds” of GRASS (sorry...)
GRASS was originally developed in a civilian laboratory (Construction Engineering Research Laboratory - CERL)
in the United States Army Corps of Engineers. It was one of the earliest “open source” projects, predating developments such as the GNU General Public License. Between 1995 and 1998, GRASS was “reborn,” with CERL
ceasing official involvement, but other groups, especially in Texas and Germany, taking over and giving birth to a
GPL-licensed, collaborative open-source development project. Today, GRASS is an official project within the Open
Source Geospatial Foundation (OSGEO.org http://www.osgeo.org). Much more information about GRASS
and software downloads are available at http://grass.osgeo.org.
3.2
The GRASS database
GRASS was developed to be able to share data in a multi-user system. Therefore the database model is a little more
complicated than your average desktop application’s. Therefore, while it is perhaps not the most user- or beginnerfriendly way to start up, the first thing one needs to specify when starting GRASS is the database layout. This is
perhaps a weakness in the user-friendliness department, but a strength in the power and flexibility of the software.
GRASS data are stored in a directory in the file system referred to as a data location (formerly/sometimes called the
database). This directory has to be created with your operating system’s normal file maintenance tools (e.g. the
command prompt, the graphical file manager, Windows’ Explorer, MacOS’s Finder) before starting to work with
GRASS. Within this database directory, projects are organized by the geographical areas with consistent coordinate
systems and projections, called locations, and each of these is again stored in a separate subdirectory (located under
6
the data location directory). The subdirectories and files defining a location are created automatically when GRASS is
started the first time with a new location.
Each location can have several mapsets. One motivation for maintaining different mapsets is to store maps related to
specific project issues or subregions. Another motivation is to support simultaneous access by several users to the
map layers stored within the same location, i.e. teams working on the same project. For team efforts, a centralized
GRASS database would be created on a network file system (e.g. NFS). Besides access to his/her own mapset, each
user can also read map layers in other users’ mapsets, but s/he can modify or remove only the map layers in his/her
own mapset.
When creating a new location, GRASS automatically creates a special mapset called PERMANENT where the core
data for the project can be stored. Data in the PERMANENT mapset can only be added, modified or removed by the
owner of the PERMANENT mapset, however, they can be accessed, analyzed, and copied into their own mapset by
the other users. The PERMANENT mapset is useful for providing general spatial data (e.g. an elevation model), accessible but write-protected to all users who are working in the same location as the database owner. To manipulate
or add data to PERMANENT, the owner would start GRASS and choose the relevant location and the PERMANENT
mapset. This mapset also contains the DEFAULT_WIND file, which holds the default region boundary coordinate
values for the location (which all users will inherit when they start using the database). Additionally, a WIND file is
kept in all mapsets for storing the current boundary coordinate values and the currently selected raster resolution.
Users have the option of switching back to the default region at any time.
3.3
GRASS user interaction
GRASS is made up of a large number of modules, each of which perform a particular task on the geographic
database. Reflecting GRASS’ heritage, these modules can be accessed at a text-based prompt, and this interface
is often preferred by experienced users, as well as being very useful for scripting repetitive or automated tasks.
A lot of work has also been invested in developing graphical user interfaces (GUIs) for GRASS. The built-in GIS
Manager (gis.m) is a Tcl/Tk-based system which starts by default on modern GRASS distributions. It provides
integrated access to each GRASS module, related help files, progress tracking, as well as mapping and data input
capabilities specifically developed for the GUI interface. While GIS Manager has provided great new capabilities
and user-friendliness to GRASS, the developers have concluded that it has reached its limit in terms of integration
and portability objectives, and work has begun on a Python-based replacement interface.
In a parallel effort, QGIS can actually be considered as an interface to GRASS, which is why it is included in this
workshop and will be treated separately below. It has gained this status due to the combination of its native support
for GRASS databases (read and write), its ability to act as a digitizing interface for GRASS, and because while it does
not have GIS analysis capabilities itself, it can call on GRASS modules to provide powerful analytic functions.
Other interfaces have been developed in the past, and some will probably come into prominence in the future, but
these seem to be the main options today.
This section of the tutorial continues using the GIS Manager interface, and the GRASS command prompt, which
is simply a modification of your operating system’s / user environment’s shell prompt. We’ll start by launching
GRASS, and specifying the database to use with this interface. For any of the GRASS commands we use in the
tutorial (or for all of GRASS, for that matter), you can get a terse help text at the command prompt by typing the
command followed by –help, you can get a full manual page in a web browser by entering g.manual commandname
at the prompt, and you can also access the same manual page by pressing the Help button in the GUI interface to
the command module. The full manual system is also accessible from the Help menu in the main GIS Manager
window.
3.4
Starting GRASS
The first step to launch GRASS depends on the operating system being used. On Windows or MacOS, an icon or
Start Menu item has probably been installed. On Linux machines, there may be a menu item to start the software,
but you can also start GRASS from the command line. On the machines in this lab, you can start the software at a
Terminal window, by typing grass62 at the prompt and pressing Enter.
7
Figure 2: GRASS graphical startup screen - choice of or creation of GRASS data set
The next step, as GRASS launches, is to either select or create a new database. If the graphics environment on your
computer is set up correctly, you should see a GUI version of the dialogue to get this information from you, and it
should look like the dialogue in figure 1.
The “GIS Data Directory” refers to the overall database location in the file system, under which locations are
stored, each of which can have multiple mapsets (see section 2.2). For our workshop, the directory to fill in here
is /usr/local/share/data/GRASS - you can fill this in by typing, or using the Browse button (but in this case it’s
probably fastest to type it). Once you fill that in and press Return, the available locations should show up. Choose
“nc_spm_06” to load the example North Carolina database2 . We could use any of the mapsets that you have permission to write to, but today we’ll create a new mapset, to make it clear which maps we make ourselves, and which
were already in the database. To do so, fill in a name in the box under “Create new mapset in selected location”, and
then press the “Create new mapset” button. This will create a new directory structure for you under the location
directory, and all the files you create will be stored there.
The other options in this dialogue, in the bottom right hand corner, for future reference, are the options to create
a new location - you have the choice of pointing to an existing georeferenced file, using an EPSG code (a database
of projection and coordinate systems), or manually entering all the parameters about the projection and coordinate
system to be used in your location’s data.
Once you have entered in all the information, press the “Enter GRASS” button. If all goes well, the GIS Manager
should start up, launching several windows.
2 If you try this later on your own machines, you will need to download the dataset and then extract the data into a directory of your choosing.
The Data Location is the directory into which you extracted the data, and the Location will be the nc_spm_06 directory created when you did
the extraction.
8
Figure 3: GIS Manager main screen
3.5
GIS Manager
The GIS Manager splits your GRASS interaction into a number of windows. First, the main GIS Manager windows
has menus for accessing all the GRASS modules, as well as the controls for building maps (Figure 2). Along the top,
the menus provide access to all the modules. The next two rows of buttons controls the construction of maps in the
separate Map Display window (Figure 3); hover your mouse over each button to get a ”tool tip” describing what
the button does. For example, there are buttons to add a raster layer to the map, add a vector layer, add scalebars,
etc. Moving down further, the next section shows the current table of contents for the map, and the bottom section
controls the options for the currently selected layer in the table of contents.
Let’s explore! In the main GIS Manager window, click on the ”Add raster” button. A pop-up window will appear,
showing you the mapsets you have access to, and any raster maps already in your own mapset. If you’ve started
this tutorial with a new mapset, no maps will be showing yet, since you have not created any rasters, but if you click
on the ”+” symbol beside the PERMANENT mapset, it will expand to show you all of the raster maps available.
Choose one, and click OK. Then in the Map Display window, press the ”Display Active Layers” button at the top
left. Your map should be drawn into that Map Display window. Not all of the maps in the NC_SPM dataset have the
same extents, so it’s possible that the map you’ve chosen may not fill the display. Your map window was originally
set to the extent and resolution specified in your mapset’s ”current region” which itself was set to the default region
for the entire location, which was specified when the dataset was first created. You can change the view in the Map
Display Window using the ”Zoom to...” button which near the centre of the tool bar on the display window. This
button expands into a menu with a number of choices, including the ability to adjust the current working region,
which will be enforced for all subsequent processing done with GRASS modules.
9
Figure 4: GIS Manager Map Display window (showing the ”elevation” raster layer in the NC_SPM demonstration
dataset)
10
Figure 5: Raster processing menu
Get comfortable with the GIS Manager mapping interface - add a vector layer or two, and experiment with the
options. The interface has some similarities with other GIS mapping interfaces, except that it is split across multiple
windows. This seems to be a ”love it or hate it” design feature.
3.6
Raster processing
Raster processing was the original strength of GRASS, and this is reflected in a rich array of capabilities. In GIS
Manager, the raster processing modules are grouped under their own appropriately-named menu (Figure 4), and
the command modules all start with the prefix ”r.”.
3.6.1
Current Region
For our first demonstration of raster processing, we’ll create raster buffers around the lakes in the dataset. First of
all, you may all have different current regions and zoom levels from our previous GIS Manager experiments. So
first, let’s make sure we’re all set up the same way in terms of extents and resolution, by running the following
command in the Terminal window where you first started GRASS3 :
g.region -p rast=lakes
That command requested that the current working region be set to be the same as the extents and resolution of the
raster map ”lakes”, and the -p requested that this information be printed to the terminal. The effect of setting this
current working region is that any analysis that we now perform will be conducted within this region, and new
files that are created will have the same extent and resolution. This command has the prefix ”g.” because it is a
”general” command in GRASS, applicable to work on any kind of data.
3 All GRASS modules can be accessed through GIS Manager, and all non-GUI-specific programs can be run from the GRASS command
prompt; I tend to use the command prompt in my own work and will tend to use it in this tutorial since it’s a lot easier to put many commands
into this document than describe all the mouse clicks you would need to perform in the GUI. However, you may also want to explore the
commands in the GUI to see what all the other options are.
11
Finally, in your Map Display window, click on the ”Zoom to...” button, and choose the option to zoom to the
Current Region. Now, display the lakes layer in the map window to see what we’ll be working with. You can see
some metadata about the lakes layer by entering this command:
r.info lakes
3.6.2
Raster buffers
Back in the main GIS Manager window, go to the Raster menu, and click on ”Create Raster Buffers”. A new window
will open which controls the r.buffer module. Underneath ”Name of input raster map:”, either type in lakes, or click
on the raster map icon to the left of that text input field to graphically select the lakes map. Note that as you enter
parameters in to the GUI module dialogue, it is building a command-line version of what you’re requesting at the
bottom of the window. This is a very useful tool for learning the software, and you can even copy and paste the
commands into a text file to save for later, or even to build a script. Carry on, choosing a new name for your output
raster, and choosing buffer widths of 100 and 250 metres (enter the two distances with a comma between them).
Back in the GIS manager, display your new map to verify it did what you expected.
3.6.3
Raster statistics
Now imagine that we wanted to know something about other variables that fall within these buffers. One tool to
draw upon is r.statistics, which describes the distribution of values in a ”cover layer” based on their intersection
with a ”base layer”. The distribution can be output in a table, or summarized using standard descriptive statistics. For example, we can print a table of the distributions of land cover classes within each buffer category using
(substitute whatever name you gave your r.buffer output in the previous step for ”lakebuffer”):
r.statistics base=lakebuffer cover=landclass96 method=distribution
A simple way to see the ”legends” for these maps are, i.e. to see what the numbers in the first two columns of
output mean, is to run the r.cats command on the file, e.g. (and you can do the same for your buffer map):
r.cats landclass96
Similarly, we could find out what the most common geological unit within each of our buffers is, using the following
command (again, substitute the name of your buffer map for ”lakebuffer”):
r.statistics -c base=lakebuffer cover=geology_30m method=mode output=buffergeol
You can examine the output by displaying and then querying the new output map in the Map Display window, or
you can quickly see what categories were found with:
r.cats buffergeol
Not very exciting, huh?! This is because all areas within the three areas of the buffer map (the lakes themselves,
and the 100m and 250m buffers) are treated as a single unit when the statistics are calculated. Because the ”CZfg”
geological unit is the most common across the current study region, it shows up as the dominant unit for all three
categories in the buffer map. We might want to evaluate this question for each lake separately - to do that, we first
need to ”clump” our buffer zones, so that each one gets a unique ID:
r.clump input=lakebuffer output=uniquebuffers
Now we can run r.statistics again:
r.statistics -c base=uniquebuffers cover=geology_30m method=mode output=ubuffergeol
And again you can examine the results using a combination of r.cats output and querying the map itself.
Unfortunately, r.statistics has not yet been updated to handle floating point data. GRASS rasters used to be limited
to integer data, and not everything has been updated. Some of the most common statistics are completed, however,
and can be accessed using the separate modules r.mode, r.median, and r.average. So we can use these to, for
example, find out what the average elevation is within each of our unique lake buffers:
r.average base=uniquebuffers cover=elevation output=avgbuffelevs
If you query the resulting map, you’ll see that it holds the average elevation within each buffer zone around each
lake.
12
3.6.4
Map algebra
One of the most powerful tools in GRASS is r.mapcalc - the map algebra tool. If you read its help page (for example,
type g.manual r.mapcalc at the command prompt), you’ll see that it has a lot of options, and we’ll only cover a couple of examples here. Perhaps its simplest role is to perform arithmetic using raster maps. For example, this dataset
actually has a number of digital elevation models (DEMs) from different sources, and a common way to compare
elevation models is to look at per-pixel differences - we could calculate the difference between the elevation from
the National Elevation Dataset (”elevation”) and the model produced by the Shuttle Radar Topography Mission
(SRTM - map named ”elev_srtm_30m”) using the following command:
r.mapcalc ”elevdiff = elevation - elev_srtm_30m”
Again, you can map the resulting map (elevdiff), and it would also be useful to see the distribution of differences
using the histogram tool (4th icon from the left on the top row of tool buttons in GIS Manager). You can also get a
statistical summary of the elevation differences with the following:
r.univar elevdiff
You will probably get a better handle on r.mapcalc’s power, without going into too complicated an example, using
some examples of conditional processing. Let’s imagine that we need to find all areas in our study site with an
elevation above 125m and a slope below 5 degrees; we could create such a map using:
r.mapcalc ”suitable = if(elevation > 125) * if(slope < 5)”
Each of the if() commands in that command evaluate the enclosed condition each pixel, and if it evaluates to be
true, a value of 1 is returned, otherwise 0 is returned. Areas on the map with a ”No Data” code in any of the inputs
would return ”No Data” as the output for that pixel. Using simple multiplication, we end up with a map that has a
value of 1 everywhere both conditions are true (yes, we also could have used the boolean AND operator &&). Let’s
try a slightly more complicated example - maybe in the above condition, we weren’t finding enough possibilities,
so we decide that areas with slopes less than 5 degrees are ”best”, but as long as the slope is less than 15 degrees,
it’s also ”in the running” - we could map these possibilities using:
r.mapcalc ”suitabilitycode = if(elevation > 125) * (if(slope < 5, 2, if(slope < 15)))”
In this example, the first time we test slopes, we use a more complicated version of the if() command, which instead
of just being a binary result, allows us to specify ”if ... then ... else ...” actions - in this case, it’s saying ”if the slope
is less than 5, then the result is 2, otherwise run another if test which tests to see if the slope is less than 15”. Since
this last if statement uses the simpler ”yes / no - 1/0” form of the if command, this translates to ”if the slope is less
than 15, the answer is 1, otherwise the answer is zero”, so by nesting this all together, we get an output of 2 when
the slope is less than 5 degrees, 1 if the slope is less than 15 degrees, and zero in all other cases. This is multiplied
by the 1/0 result of the elevation check, to get the final map I wanted.
The r.mapcalc module can also do calculations based on a cell’s neighbourhood or row/column values, it’s category
labels, trigonometric and statistical functions, and calculate a lookup table based on graphing of monotonicallyincreasing dependencies of one variable upon another. These are all left as ”exercises for the readers” ;)
3.6.5
Raster data exchange
GRASS counts on PROJ.4 for projections support, and GDAL/OGR for most of its data import/export routines.
Therefore, if GDAL supports a particular raster format, it can be used with GRASS, subject to whatever drivers are
installed on the particular computer you’re using. The GRASS commands r.in.gdal and r.out.gdal handle translation
between the GRASS database and external raster formats. You can see which formats are supported for export on
your machine using:
r.out.gdal -l
Many of you are already familiar with the GDAL library and the gdalinfo utility, so this output will look familiar.
We can export our elevdiff file, for example, to GeoTIFF format, using:
r.out.gdal input=elevdiff output=elevdiff.tif format=GTiff type=Float32
This creates the elevdiff.tif file in the current working directory. You can verify that it ”worked” in that it created
a TIFF version of the map using the operating system’s file manager and default graphics viewer. We’ll verify that
the geographic coordinates were preserved later in the tutorial, when we fire up QGIS.
13
Figure 6: The i.group interface used to group individual raster files into an imagery database
3.6.6
Other raster modules
There are of course MANY other things you can do with raster data in GRASS. Feel free to explore the Raster menu,
as well as other relevant tutorial documents that I’ll have on hand at the workshop. I will also have copies of ”the
GRASS book” (Neteler and Mitasova, 2007), which has whole chapters on working with and analysing raster data
in GRASS.
3.7
Image processing
The distinction between image processing and raster processing is pretty artificial, since we’re still talking about
working with raster databases, but I separate it here because the functionality in GRASS that is specifically targetted at managing and analysing raster datasets holding image data is separated into ”imagery” modules - that is,
commands that start with ”i.”, and fall under the ”Imagery” menu in GIS Manager. Working on imagery can take a
fair bit of time - we’ll just do a brief exploration to highlight the capabilities. The North Carolina dataset we’re using includes a LANDSAT ETM scene from May 24 2002. To start our work with this image, set the current working
region to match the extent and resolution of this LANDSAT data:
g.region -p rast=lsat7_2002_10
In GIS Manager, you can take a look at any of the individual bands the same way you looked at other raster data in
the previous section. To make sure you’re looking at the same region, make sure you use the ”Zoom to...” button to
match the current region, or Zoom to one of the LANDSAT data layers (this will have the same effect, since we just
set the current region to match one of those bands). You can also build colour composites in GIS Manager, using
the ”Add RGB or HIS layer” button right beside the ”Add Raster” button (the icon looks like a stack of red, green,
and blue layers). For example, if you specify lsat7_2002_10 for the blue layer, lsat7_2002_20 for the green layer, and
lsat_2002_30 for the red layer, you can create a visible light (”true” colour) image in the Map Display.
Now we’ll do a quick image classification. First, we need to create an ”image group” - that is, we need to specify
a group of files that together make up an image, which each layer holding data about the reflectivity of each pixel
in a given range of wavelengths. We use the i.group command to do this, and it’s probably easiest to use the GUI
version of the command to do this step (Figure 5). Start this tool, either by finding it in the Imagery menu (Develop
images and groups -> Create/edit imagery group), or by typing in just i.group at the command prompt.
The ”Name of imagery group” is anything you want - I’ve used nclandsat2002 in Figure 5, and will refer to that
name in the coming examples. I have also created a ”sub-group” called ”allbands” - this allows you to have one
overall group with all of the possibilities listed, and then different subgroups including various combinations of
the possibilities. We need one subgroup defined for an upcoming step, so I’ve created the group and subgroup all
at once. The names of rasters to include in the group is a comma-separated list of all the raster datasets that to be
14
considered part of the image in further analysis. I have clicked the button to the left of this list multiple times, and
chosen each of the lsat7_2002_... images until I have them all selected. You can do the same, or select a subset, for
the purposes of this exercise. When you have them listed, press the Run button, and the group will be saved in the
database. From now on we can specify just the group name in many imagery commands, and they will use this full
list of input image bands.
Now we’ll perform image clustering, a common method to do unsupervised classification of imagery, or as an
early step in supervised classification. The i.cluster command is designed for this. You can use the GUI version of
the module (Imagery -> Classify image -> Clustering input for unsupervised classification), or run i.cluster at the
command line. The command I’ve used is:
i.cluster group=nclandsat2002 subgroup=allbands sigfile=mysigfile classes=6 reportfile=report.
which creates a new ”signature file” called mysigfile, with data about the statistics (mean, number of pixels and
variance-covariance matrix) for all of the input bands in the allbands subgroup for each cluster that was identified,
specifying that it should start off trying to identify 6 clusters in the data, and it should create a text file with a
report on the clustering process in the file report.txt. If you take a look at the report, you’ll get an idea about what
the program was trying to do (we don’t have time to cover this today). The next step is to use these clustering
statistics to classify the whole image, which examines each pixel in the current region, and assigns it to a particular
class, based on the statistics in the signature file. We’ll use the most common classification algorithm, maximum
likelihood classification, in the i.maxlik grass module:
i.maxlik group=nclandsat2002 subgroup=allbands sigfile=mysigfile class=myclassmap
When it finishes processing take a look at your map. It should have assigned each pixel to one of the six classes.
Congratulations, you’ve just mapped land cover types in North Carolina, based on LANDSAT ETM data!
3.8
Vector processing
The demo dataset includes a number of vector layers for you to explore. You’ll note that there are a lot more options
for displaying vectors in GIS Manager compared to rasters. You have control over symbology, labelling, which parts
of the dataset to show, and can even put in SQL queries to select specific records from the vector database. Again,
everything you do is affected by the current working region, although the resolution values which are so important
for raster data, have no effect on vector layers. To make sure we’re all using the same region, we’ll set it to a specific
window that is defined in the database using:
g.region region=swwake_10m -p
This reads in a pre-defined region called swwake_10m, which is stored in the PERMANENT mapset. Explore some
of the vector layers by displaying them in GIS Manager. You can see metadata on the files using the v.info command.
GRASS attribute data is stored in separate database tables. The default store for attribute tables is a DBF file, but
links to external DBMSs are also possible (ODBC, MySQL, SQLite, PostgreSQL, ...). In addition, (vector) spatial data
can be held in PostGIS. More details about the database management can be read with the manual page accessed
by:
g.manual databaseintro
We can view the attribute data for a layer a couple of ways. A quick and dirty dump of the entire attribute table is
possible with the v.db.select command, so, for example, we can see the table for the community colleges layer with
the following (note this is the whole table, NOT restricted to the current working region):
v.db.select comm_colleges
Vector data can also be queried in the Map Display window, using the Query button:
3.8.1
Database selection
To demonstrate querying features based on their attributes using a DBF table, we need to create a local copy of one
of the data layers. To keep it simple, let’s use the schools data. To make yourself a local copy, use the following
command:
15
g.copy vect=schools_wake,myschools
This read the schools_wake layer in the PERMANENT mapset and created a copy called myschools in your current mapset. We can find out what the current database connection is for our vector map, and then get a concise
description of that database, with the following commands:
v.db.connect -p myschools
db.describe myschools
Next we’ll select all schools that are in Raleigh, NC with a projected enrolment of over 750:
echo "SELECT * FROM myschools WHERE ADDRCITY = ’Raleigh’ AND PROJ_CAP > 750" | db.select
This used the relatively low-level db.select command to manipulate the attribute table itself, without paying attention to the spatial data - there are also v.db. commands which works on the vector maps AND there associated
attribute tables. This lets us do things like the following:
v.db.select myschools where="ADDRCITY = ’Raleigh’ AND PROJ_CAP > 750"
v.extract myschools out=bigraleighschools where=" ADDRCITY = ’Raleigh’ AND PROJ_CAP >
750"
The first command was just another way of executing the db.select command we did previously, but this time we
have specified the VECTOR MAP called myschools, not the table which happens to have the same name, so this
would work on whatever attribute table happened to be hooked up to that vector map (and is no longer restricted to
the current mapset). This step is a good way to test out your SQL query before doing actual processing, such as the
extraction in the second command, v.extract, which created a new vector map called bigraleighschools, which was
the result of the query in the where= argument. Check it out - you now have a vector map called bigraleighschools
which only includes schools in Raleigh, with projected capacities above 750.
3.8.2
Topology
The GRASS vector database uses a full topological model, which means that it keeps track of relationships between
all adjacent or otherwise connected spatial objects. By default, when you import vector data, the topology is immediately built. This includes things like line directions, which may just be the direction in which a line was digitized,
but it also may have special meaning, such as the flow direction of a street or stream. For example, we see the
direction of flow built in to the streams database, if you choose the ”line direction” option in the vector display
options in GIS Manager:
Other tools are available under Vector-> Develop Map for the examination and repair of topological data, as well as
a digitizing tool which can be used for manual editing of the data (we’ll save this kind of work for QGIS).
3.8.3
Vector buffers
For continuity, let’s create vector buffers around the lakes in this dataset. The vector version of the lakes data is
much more detailed than the raster file used above, so to speed the analysis up , we’ll first select just those lakes
that are larger than 250000 square meters. Also in the interests of speed, we won’t use the v.buffer command, which
does both internal and external buffers, and then dissolves all overlapping results (this takes way too long to fit
in to the workshop. Instead, we’ll use v.parallel, which just draws parallel lines on one side or the other of linear
features, including polygon boundaries:
v.extract lakes out=biglakes where="AREA > 250000"
v.parallel input=biglakes output=buffers distance=-100
What’s different about this map and your raster version? Why did I use a negative distance value, and why did
that not work perfectly? Look at the manual pages, and we’ll discuss.
16
3.8.4
Overlays and clipping
The main two types of overlays are distinguished by their boolean operators; using the OR operator, one ends
up with a combination of the two input layers, whereas the AND operation returns only those areas which exist
in both the inputs. This second form is often used in a ”clipping” operation, to create a data subset according to
spatial extents, by overlaying it with a simple polygon that inhabits desired subregion.
Imagine that you needed to keep track of geology separately for each municipality, so you wanted the geology
boundaries to line up with municipal boundaries4 . You could create a geology map that obeyed municipal boundaries with the command:
v.overlay ain=geology bin=boundary_municp out=lakes_or_munic op=or
Alternatively, we could ”clip” the geology map to include only (for example) the areas within the town of Cary
with:
v.extract input=boundary_municp output=cary where="TEXT_NAME = ’Cary’"
v.overlay ain=geology bin=cary out=cary_geology_clip op=and
Display your final map and query the attributes, to make sure it did what we expect.
3.8.5
Vector data exchange
As you should be able to guess by now, most of the vector import/export capabilities are handled by an interface to
OGR5 . This capability is accessed through the v.in.ogr and v.out.ogr modules. Use the following command to create
an ESRI shapefile of your clipped geology polygons:
v.out.ogr -e input=cary_geology_clip dsn=.
3.8.6
olayer=cary_geology_clip format=ESRI_Shapefile
Other vector processing, and vector/raster
Again, there’s WAY more that could be done. I was considering network analysis for this tutorial, for example,
using the school bus routes included in the dataset. There are all sorts of things to be done using a combination of
vector and raster data, too, such as sampling rasters at vector points, or summarizing rasters within polygons, as
well as interpolating rasters between known vector data points, etc. But we’d be in the lab all night, so we’ll save
some things for future work, and back to QGIS. Again, please feel free to look at other materials available in the lab
to get more ideas on what GRASS can do.
4
GRASS and QGIS together
4.1
The GRASS plugin’s GRASS Tools
One of the most interesting features of the QGIS GRASS plugin is the Tools interface. If you choose Open GRASS
Tools from the GRASS plugin (either in the toolbar, or in the menus: Plugins -> GRASS -> Open GRASS Tools), it
will scan all the modules installed in your local GRASS installation, and build a menu of modules that it can access
in QGIS. Once that list is built, you should recognize many commands. For example, the r.buffer steps performed
in section 3.6.2 of this document, could also be done through QGIS, by going through the relevant GRASS Tools
interface.
Why is this valuable? I think part of it is the concept - through an open architecture, the QGIS software is able to offer
all this analysis without having to program it all from scratch. And from a usability point of view, the much simpler
user experience in QGIS now has access to much more power than just a data viewer / mapping tool would be able
to provide. From a portability point of view this provides a welcome bonus, too - as mentioned above, GRASS is
still quite painful under Microsoft Windows - however, if you download the default binary distribution of QGIS for
Windows, it INCLUDES a full set of GRASS modules in its installation package, so this is a great way to access the
processing capabilities of GRASS on Windows with a single download without any prerequisites on your computer.
4 yes,
this IS silly, but it quickly illustrates the point - suggestions of more sensible examples using this dataset that don’t take too long to
process are welcome.
5 There are also some legacy import/export commands, which predate the incorporation of GDAL/OGR
17
4.2
Connecting to a GRASS mapset (for the REAL power...)
Instead of just loading individual GRASS files, you can also connect to complete GRASS mapset, to unlock the full
power of the GRASS plugin. To do so you first need to Open a Mapset in the GRASS plugin - again, specify your
GIS DBASE if this is not already filled in (/usr/local/share/data/GRASS in this lab), then choose nc_spm_06 for
the location, and user1 for the mapset. Clicking OK won’t seem to do much, but now you can EDIT data in this
GRASS dataset, and you can also access the ”GRASS tools”.
Note that if you start QGIS from the GRASS prompt, this connection to a mapset is already done for you.
4.3
Accessing GRASS modules from QGIS
With your mouse, go to Plugins -> GRASS -> Open GRASS Tools. There will be an initial delay as the available
GRASS modules are scanned and a tool menu is built. The available modules are grouped hierarchically by task
group. For example, some of the first modules in your list are likely the import tools. GRASS, and therefore QGIS,
has access to all the raster formats in your local copy of GDAL, all the vector formats in your local copy of OGR, as
well as some other legacy format convertors.
As an example, let’s try putting buffers around the firestations in the database. In the GRASS Tools window, click
on the Browser tab. This shows the GRASS database, including all MAPSETS in the current LOCATION (see section
3.2, above). Expand the PERMANENT mapset, and the vector subfolder within it, then click once on the firestations
layer to select it. Now press the ”Add selected map to canvas” button at the top left (
), and the layer will be
added to your map. Next, click on the Modules tab to get the list of GRASS modules back, and scroll down to the
Vector -> Spatial Analysis section, and find the v.buffer tool. Double click on it to open up a new tab with the user
inputs to this module. Note there are three ”sub-tabs” within this window - one for getting the user inputs, one
where the program’s output will be displayed, and one with the manual page for the module.
If it isn’t already filled in correctly, choose the firestations layer for the input vector map. Let’s try 1500m buffers for
the buffering distance (enter 1500 into the box, the units are a function of the map units, which you set in the properties dialogue back in step 2.11). Finally, choose a name for the output file, for example firestation_1500m_buffer.
Press the Run button, and you will be directed to the Output subtab to view the processing messages.
Move back to the Browser tab, and you should find the new firestation_1500m_buffer layer under the user1 mapset
in the vector category. Again, you can add it to the map using the Add selected map to canvas button (
).
Next, let’s export this layer of GRASS buffer polygons as a shapefile, using v.out.ogr. This GRASS Tool is under File
-> Export -> Export Vector -> ”v.out.ogr - Export vector layer to various formats (OGR library)”. Double click on
that tool, and its input tab will open in the GRASS Tools window. Choose your new buffer layer as the input vector
layer, use ESRI_Shapefile as the OGR format, and choose an output file path and name in the last box (you can use
the button at the right edge of this field to graphically choose an output directory). When you run the module, the
shapefile is created in the specified directory.
You should get the idea by now. Note that the steps that were completed through ”native” GRASS in section 3,
above, could also have been done through the GRASS Tools interface. In fact, even the command line mode of
interaction is possible - see the GRASS command shell right at the very top of the GRASS Tools list of modules.
5
Conclusions
Based on past experience, this document already has way more than enough material to explore in any given
workshop session, so I should stop now and save some exploration for other tutorials. If you are a fast worker in a
group workshop setting, feel free to go back to any sections that were glossed over by the workshop presenters, or to
check out other modules and documentation. Since all the software and data in this tutorial is freely downloadable
on the Internet, you can also follow up on your own computers, and try out other tutorials as well.
I welcome feedback from any users of this document. Further, I encourage more discussion among Ottawa OSGEO
members on the value of hands-on workshops as part of our activities, and what kinds of tools / data / whatever
we might want to explore in the future.
18
I would also like to acknowledge the ideas and support I’ve received from others in creating these materials, from
the provision of the North Carolina dataset by Helena Mitasova and Markus Neteler, to earlier tutorials I’ve based
my ideas on by many others in the GRASS and QGIS communities, and the help of Dave Sampson and OSGEO
Ottawa participants to help set up the open source options and test out initial tutorial versions in my teaching
laboratory at Carleton University.
Cheers,
Scott Mitchell - smitch AT spamcop.net
OSGEO Ottawa Chapter http://wiki.osgeo.org/index.php/Ottawa_Chapter
Carleton University Department of Geography and Environmental Studies http://www.carleton.ca/geography
Carleton Geomatics and Landscape Ecology Research Laboratory http://www.glel.carleton.ca
19