1
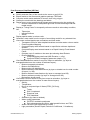
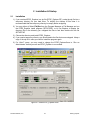
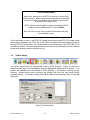
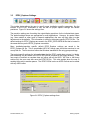
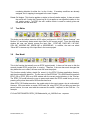
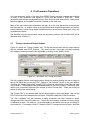
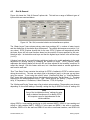
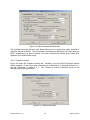
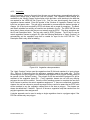
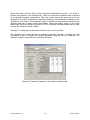
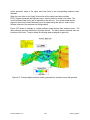
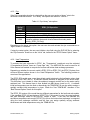
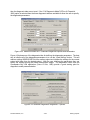
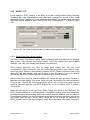
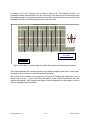
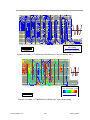
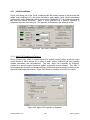
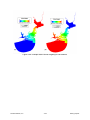
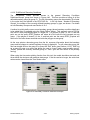
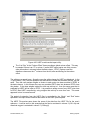
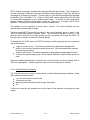
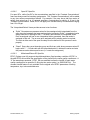
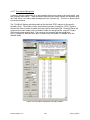
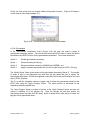
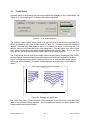
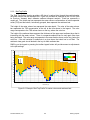
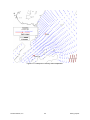
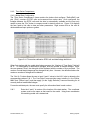
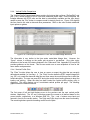
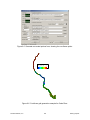
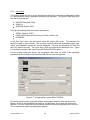
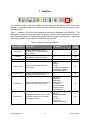
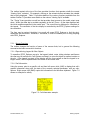
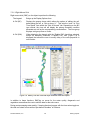
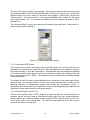
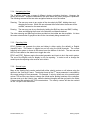
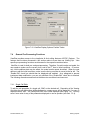
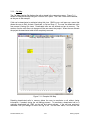
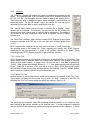
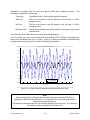
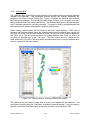
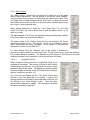
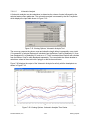
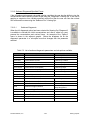
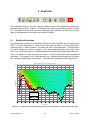
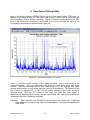
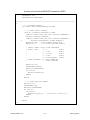
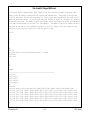
8 ViewProfile
The ViewProfile button of the main toolbar provides access to the profile/cross section postprocessing utility of EFDC_Explorer. An example of the type of plot available is shown in Figure
8-1. The contents of the current cell can be displayed, as in ViewPlan, by LMC’ing on the cell.
Many of the operations of this feature are similar to ViewPlan.
8.1
Slice/Profile Selection
The “Slice/Extraction Options” frame needs to be set first before a profile can be extracted from
EFDC. There are three options. The user may either select a value of I to extract the active J
cells along that I, or select a value of J to extract the active I cells along that J. The third option
is to use a “Drape Line”, which is a polyline in the same coordinate system as the LXLY data.
The I & J’s from along the line will be assembled and the profile will be output along that slice.
If an I or J extraction is used, the user can use the + /- keys to scroll up and down the selected
coordinate. For example, if the I5 was selected, the + keystroke would display the I6 section,
the – keystroke would display the I4 section. This feature is not applicable to the “Drape Line”.
'Cedar-Ortega-St Johns River Curvilinear Grid Model'
1
0
-1
-2
Elevation (m)
-3
-4
-5
-6
Legend
Specified IJ, Time: 117.25
-7
0
-8
-9
0
Salinity (ppt)
15
0 Sediment Mass 1000
Class: Coh(1), (kg/m^ 2)
2500
5000
7500
10000
12500
15000
17500
Distance (m)
Figure 8-1 ViewProfile example showing salinity at one snapshot in time during a tidal cycle
DS-International, LLC.
8-1
EFDC_Explorer