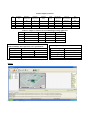
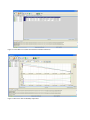
Figure 2. Tab in Mote-View (Data collected from initial data collection)
Figure 3. Mote-View chart for humidity temperature