1
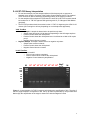
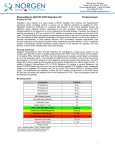
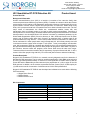
D. HIV RT-PCR Assay Interpretation For real-time analysis, use the analysis software of the thermocycler to generate a standard curve using the Ct values of the Positive Control Dilution Series. The standard curve can then be used to determine the starting quantity of the sample of interest. For the analysis of the end-point RT-PCR data, the entire 20 µL RT-PCR reaction should be loaded on a 1X TAE 2% Agarose DNA gel along with 10 L of Norgen’s DNA Marker (provided). The RT-PCR products should be resolved on the 1X TAE, 2% Agarose gel at 150V for 30 minutes (Gel running time will vary depending on an electrophoresis apparatus). Valid Test Run Positive Sample: A sample is determined to be positive only when: o Sample lanes shows the 142 bp band corresponding to the HIV target amplicon o Positive Control shows the 142 bp band o Positive Control shows the 142 bp band even it is diluted to as little as 20 copies per µL o Negative Control shows no bands Negative Sample: A sample is determined to be negative only when: o Sample lanes contain no bands o Positive Control shows the 142 bp band o Negative Control shows no bands Invalid Test Run A test run is invalid if: o The run has not been completed o Positive Control does not show the 142 bp band o Negative Control shows any amplification M 107 106 105 104 103 102 101 100 NegC M 2000 1500 1000 750 500 300 150 Figure 1: A representative 1X TAE 2% agarose gel showing the amplification of HIV. The size of the HIV target amplicon corresponds to the 142 np bp band represented by the provided DNA Marker (M). No amplification of the target is observed in with the Negative Control 6