1
92
Chapter 1
Functions, Graphs, and Limits
E X P L O R E ! U P D AT E
Explore! Updates are included at the end of each chapter of this textbook. These
Updates provide additional instructions and exercises for using a graphing utility to
explore calculus or the solutions for selected Explore! boxes found in each chapter.
An attempt has been made to use function keys that are standard on most hand-held
graphing utilities. The exact names of the function keys on your particular calculator
may vary, depending on the brand. Please consult your calculator user manual for
more specific details.
Store f(x) x2 4 into your graphing utility. Evaluate at x 3, 1, 0, 1, 3. Make
a table of values. Repeat using g(x) x2 1. Explain how the values of f(x) and
g(x) differ for each x value.
Write f(x) x2 4 in the function editor (Y5 key) as Y1 x2 4. You can
calculate functional values, such as Y1(3) by accessing the functional notation feature of your calculator. Press the VARS key. Then press the right arrow key until
Y-VARS is highlighted, and select 1:Function and 1:Y1. Make sure that you are on the
Home Screen when obtaining the Y1 symbol.
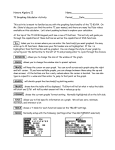
From the Home Screen (2nd MODE), you can also
obtain a list of functional values, using Y1 ({3, 1,
0, 1, 3}), where the pair of braces { } (above the parenthesis keys) encloses the listed values, as shown in the
figure.
Note
SOLUTION FOR EXPLORE!
EXERCISE ON PAGE 3
An Explore tip is that it is easier to view this list as a table of values through
the table option, making sure to set up the table parameters through the
TBLSET menu (2nd WINDOW).
Chapter 1
Explore! Update
93
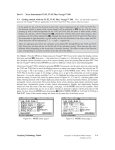
If you enter Y2 X2 1 into the equation editor (Y5), the table window will
display the functional values for this new function. Notice that the values differ by a
fixed constant of 5, since the two functions are simply vertical translations of
f(x) x2.
SOLUTION FOR EXPLORE!
EXERCISE ON PAGE 79
x3 8
using a standard window. Does this graph appear continuous?
x2
Now use a modified decimal window [4.7, 4.7]1 by [0, 14.4]1, and describe what
you observe. Which case is this most like in Example 6.3 (p. 77)?
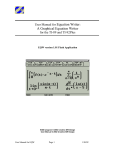
Graph f(x) The graph appears continuous using a standard window (select Z Standard from
the ZOOM menu). Examination of the graph using the decimal window [4.7, 4.7]1
by [0, 14.4]1, however, shows an exaggerated hole at x 2. (The decimal window
can also be selected from the ZOOM menu.)
The function is not continuous, specifically at x 2 where it is not defined. This case
is similar to Example 6.3, part (b). What value of y would fill up the hole in the
graph? Answer: lim f(x) 12.
x→2