1
56
Ed
Lk
(|1G
ZE
Dow QD. Iodr
A
Il
\
I
0he
I0o
,
Qy5.[ O
htrtp:1oxmr m.
GtA~ppile_%
ME L Ad EN
SOS
B
0tr
.ed61
ass
Pax-
WCP~OTMS.c.M - T. .. SsoI
CoT.N
f ows *
TA
.
dSo: Negato,...
9j ,, .
C.
tat,
I
SNORTER
Rapof
_
lcolhool
fl.r th. SNORTNowk Lebiane Dat.-ti
ti.eA -uti
onort
Syn.
so
3-_1e~ss2-U2005-02-1520-0-510
,
or
,....n0
-
;
:
.-
I
:
~~~~~~~~~~M
-
W
d-
- - -h
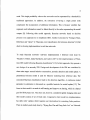
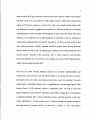
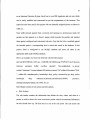
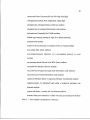
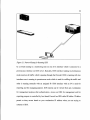
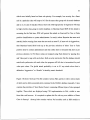
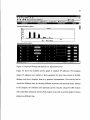
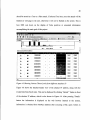
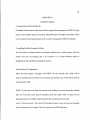
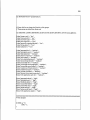
Figure 4.2 Login andActivity Graph ofAttackers IP Addresses
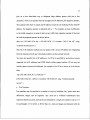
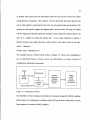
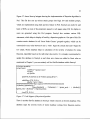
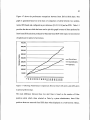
Figure 4.3 shows the detailed dispersion graph of attackers IP addresses. Dispersion
graph information is obtained by calculating the standard deviation from the different
type of attacks generated by a particular attacker after obtaining the stored information in
the MySQL database. Standard Deviation (SD) is calculated based on various attacks
done of various levels, such as high, medium and low by a particular attack IP address.
The SD calculation starts from the time since IIDS system came online and Snort started
sniffing packets on network, which were stored in MySQL database. Statistical approach
is used here to identify an attacker doing different attacks at various times, thinking
attackers activities will not be noticed by a dedicated IDS system like Snort or firewalls